Table of Contents |
In this course, you will write C++ programs, run them, and see what they produce. To do all of that, you need a workspace. GDB Online is that workspace. It puts everything you need in one browser window so you can start writing code immediately.
GDB Online is a free, browser-based development environment used to write, compile, and run C++ programs. Because it runs in a web browser, no software installation is required. You can access the workspace from any device with an internet connection.
GDB Online is also an integrated development environment, or IDE. An IDE combines tools for writing, compiling, and running programs in one place. The GDB Online workspace includes several components that you will use throughout this course.

You can use GDB Online without creating an account, but your work will not be saved after you close the browser tab or end your session. Creating a free account allows you to save your projects to your profile and access them again later from any device.
Saving projects also makes it easier to continue your work throughout this course because each project is stored in your account and can be reopened whenever you sign in.
The following table compares how GDB Online handles your work depending on whether you are logged in.
| Question | No Account | Logged In |
|---|---|---|
| Has work been saved between sessions? | No, the browser closes and the editor resets. | Yes, files are saved to your profile. |
| Can you name and organize your projects? | No | Yes |
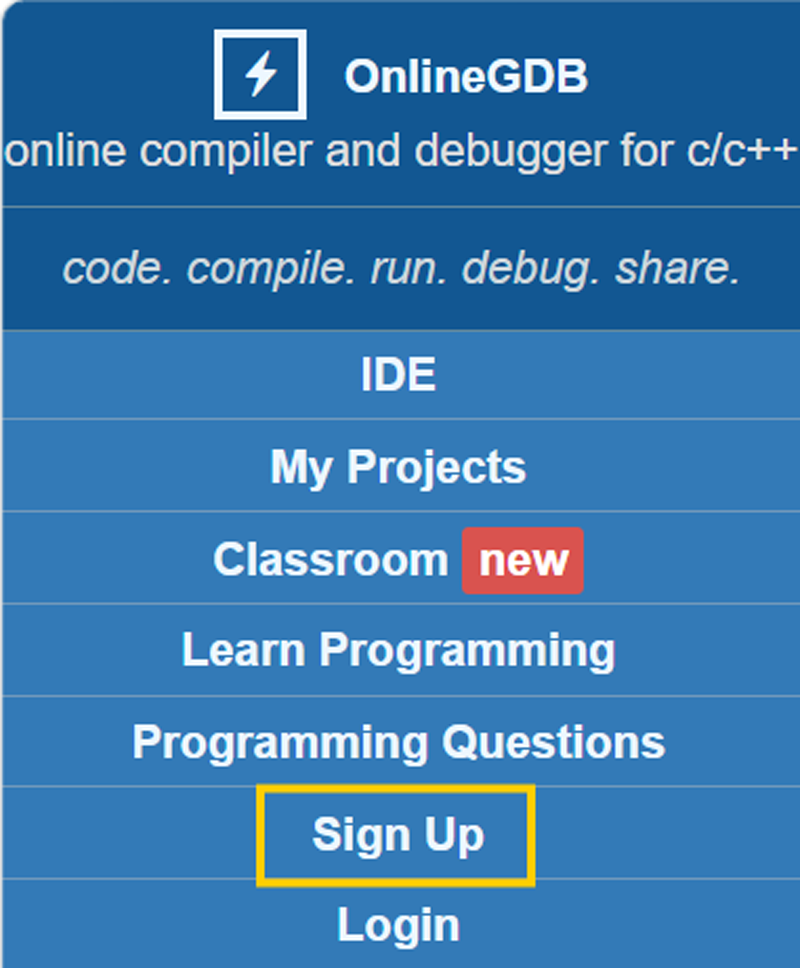
| How do you know your session is active? | You cannot tell. | Your username appears in the left menu panel, replacing the Sign Up/Login links. |
| What happens if you close the tab early? | Your code will be gone. | Your saved files will be waiting for you in the next session. |
Once your account is set up, take a closer look at the workspace. The parts of GDB Online fall into three groups: the toolbar controls at the top, the main areas where you write and view code, and the editor features that make writing code easier.
At the top of the screen is a toolbar with two controls you will use in every session.
The Run button compiles and runs your program in one click. When you click it, GDB Online checks your code, runs it, and shows the result.
The Language Selector controls which programming language GDB Online uses when it processes your code. Before clicking Run, check this drop-down near the top of the toolbar. You will see options for several programming languages and multiple versions of C++. For every program in this course, select the option labeled simply “C++.” Do not select a version-specific option. If a different programming language is selected, the compiler will not recognize your C++ code and will return errors. If a specific C++ version is selected instead of the default, your program may behave differently than expected. Checking this setting at the start of each session takes 1 s and prevents a common source of confusion.
Below the toolbar are the two areas where you spend most of your time. The code editor pane is the large text area where you type your code. It works like a text editor where you can click anywhere and start typing, but it includes features designed specifically for programming.
The input/output console, usually called the console, shows whatever your program produces after you click Run. Depending on your screen size, it appears either below or to the right of the code editor. It looks different from the editor—with a different background color and no line numbers—because it serves a different purpose.
The console and the code editor are separated by a draggable divider bar. You can drag that bar to adjust the size of either area. If a program produces a lot of output and you need more room to read it, drag the divider to give the console more space. If you need more room to type code, drag it the other way.
EXAMPLE
When you click Run on a working program, the output appears in the console. If your program has a line that prints “Hello, world!” that exact text appears in the console after the program finishes. The console keeps that text on screen until you click Run again.
The code editor includes a few features that make writing code easier.
Line numbers appear along the left edge of the editor. Every row gets its own number, starting from 1 at the top and increasing as you add code. They help you find specific lines quickly.
Syntax highlighting shows your code in different colors. Different types of code elements appear in different colors, which makes your code easier to read and helps you spot mistakes. These colors do not change how your program runs; they are purely a visual aid.
The editor also handles indentation—the spacing at the start of each line—automatically. When you press Enter, the cursor moves to the correct starting position for the next line. This keeps your code organized without you having to add spaces by hand.
With the GDB Online workspace mapped out, you have everything in place to start writing code. The next step is putting it into practice: writing, compiling, and running your first C++ program.
Source: THIS TUTORIAL WAS AUTHORED BY SOPHIA LEARNING. PLEASE SEE OUR TERMS OF USE.
REFERENCES
OnlineGDB. (n.d.). Home - GDB Online. www.onlinegdb.com