Table of Contents |
Earlier in the course, we analyzed the end behavior of power functions. It turns out that the end behavior of polynomial functions is closely related to that of a power function.
Consider a polynomial function  , where
  are real numbers. For extremely large values of x, the leading term will dominate the value of the output since the input is raised to the largest power.
The same can be said for extremely small values of x (-100, -1000, etc.).
Thus, the end behavior of a polynomial function is the same as the end behavior of its leading term.
is the same as the end behavior of 
The end behavior of polynomial functions can be summarized using the table.
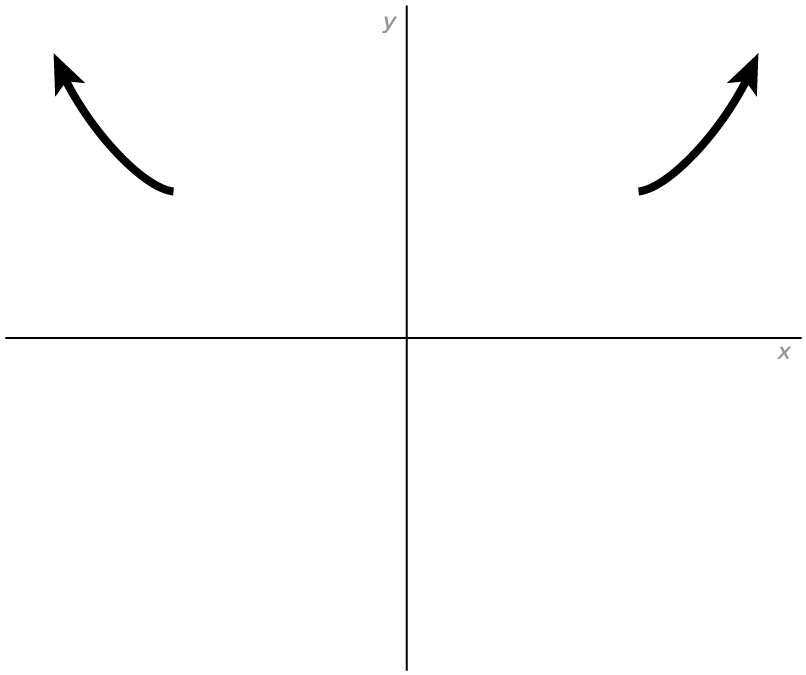
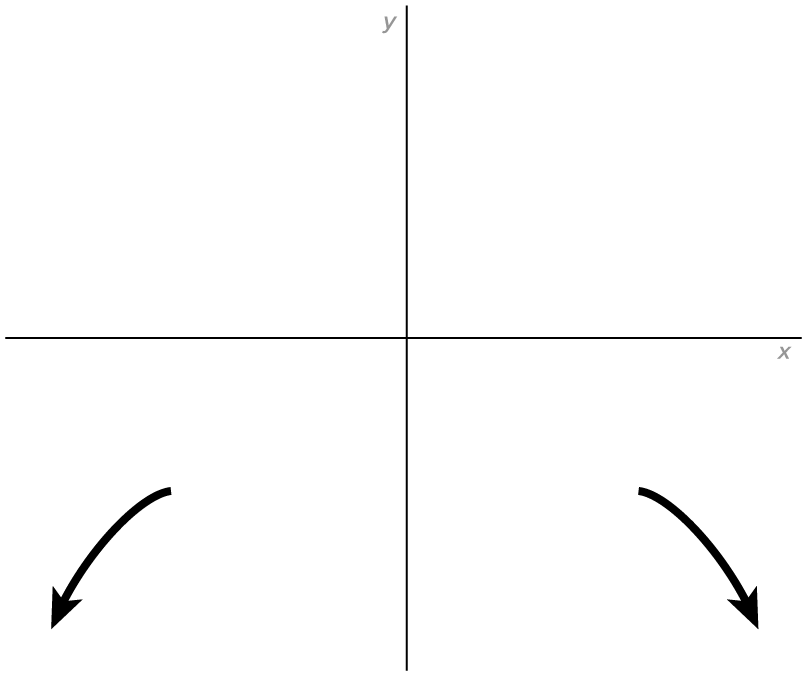
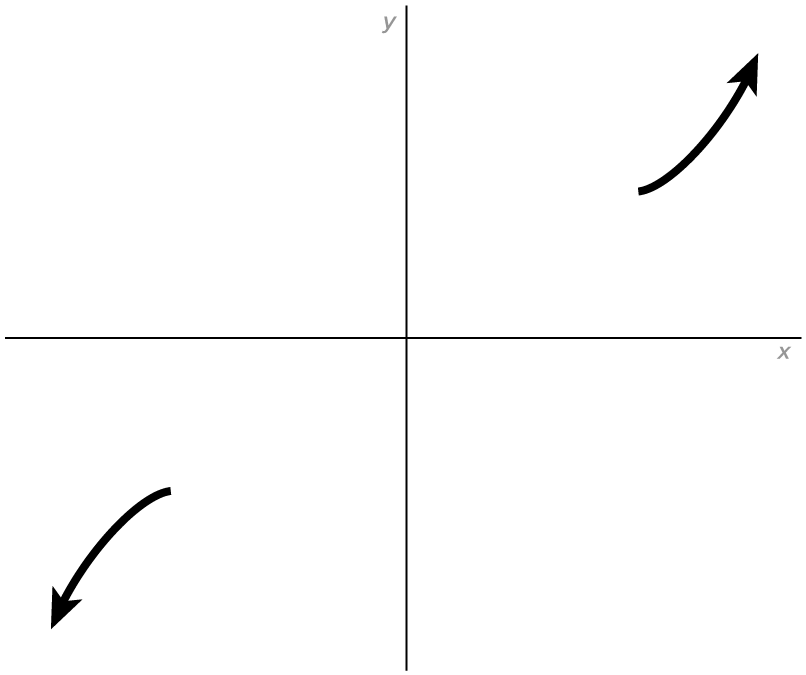
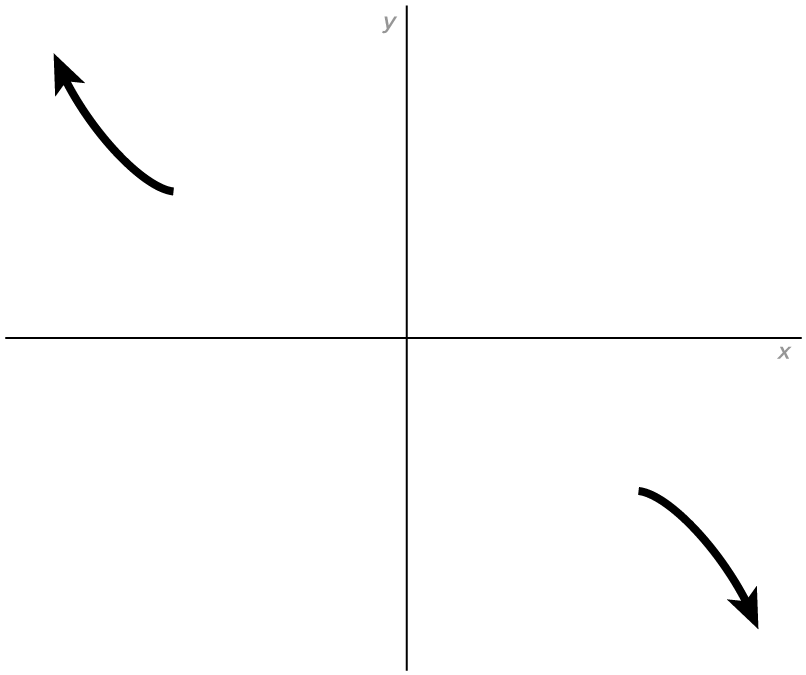
Remember that the end behavior of a power function depends on its degree (even or odd) as well as its coefficient (positive or negative).
Since the leading term of the polynomial is used to determine its end behavior, the leading coefficient of the polynomial and the degree of the polynomial are used to determine end behavior.
Positive Leading Coefficient, 
|
Negative Leading Coefficient, 
|
|
|---|---|---|
| Even Degree |
|
|
| Odd Degree |
|
|
Now that we have a process, here is an example:
EXAMPLE
Determine the end behavior of
 is the same as the end behavior of
  Since the leading coefficient is negative and the degree is even, the graph falls indefinitely on both sides.

 , and as

 , and as
To graph a polynomial function, there are several things to consider.
The degree of the polynomial is used to determine the end behavior, possible number of x-intercepts, and possible number of turning points.
The leading coefficient, along with the degree, is used to determine the end behavior of the graph of the polynomial.
When the zeros are real, they correspond to x-intercepts. The multiplicity of the zeros of the polynomial also determines the graph’s behavior around the corresponding x-intercepts, as we will investigate now.
Consider the graphs below, which all have x-intercepts at 

|

|
|---|---|
|
|

|

|
|
|
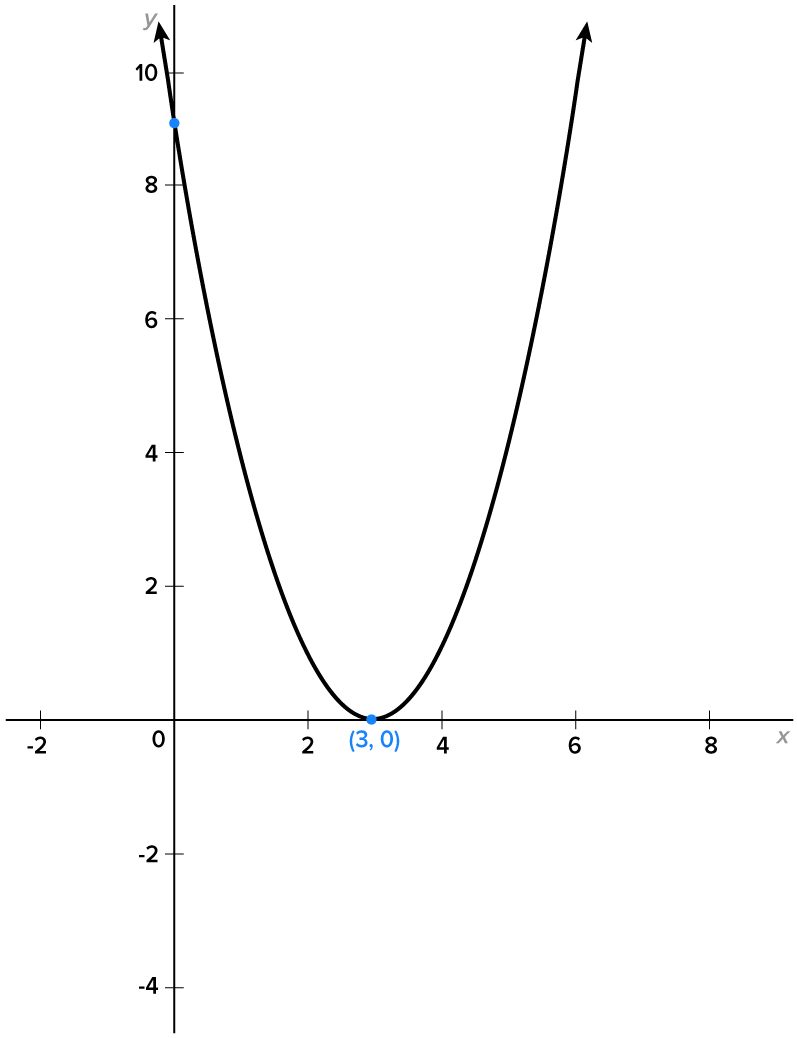
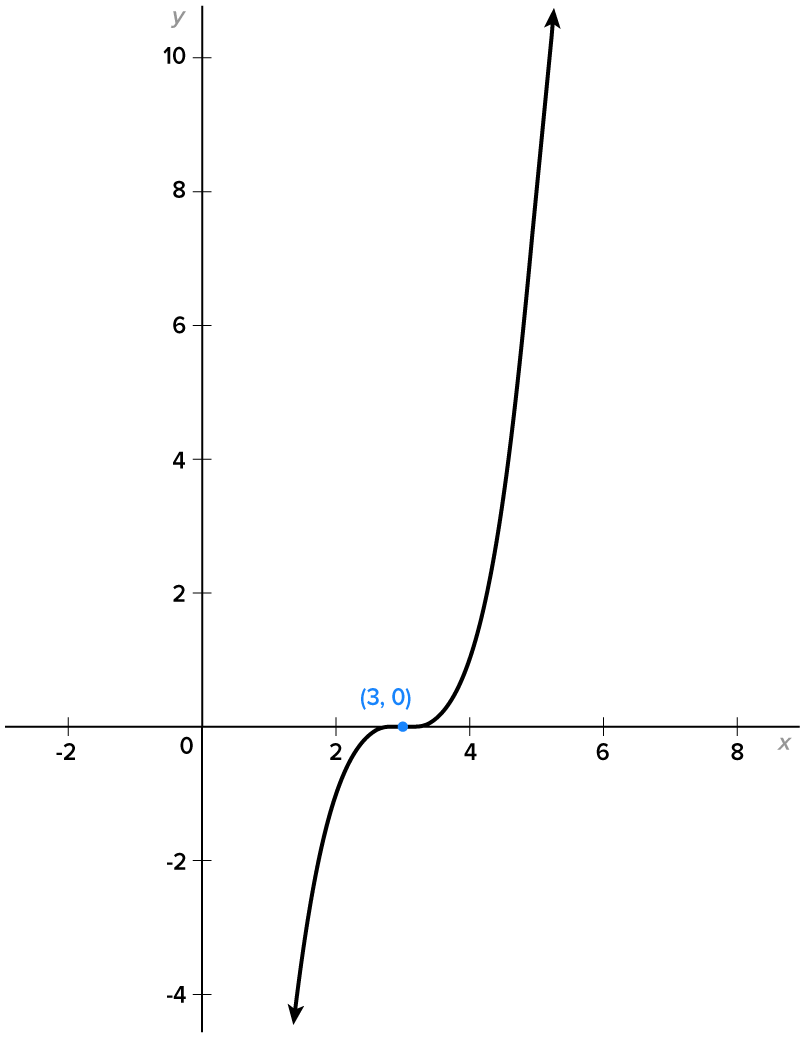
Note the behavior of the graph around the x-intercept
In the graphs of  and
and  the graph crosses the axis at Also notice in the graph of
  that the graph “levels out” at the x-intercept before crossing the axis.
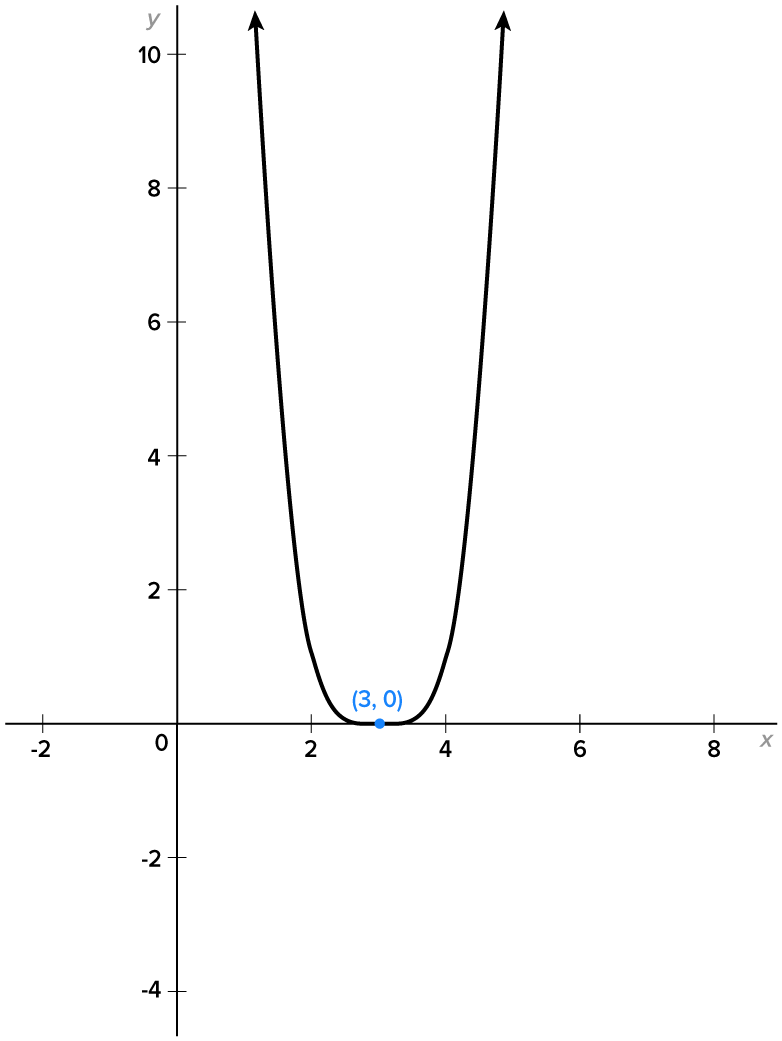
In the graphs of  and
and  the graph touches the axis at Also notice in the graph of
  is flatter around its x-intercept at
  .
.
Based on this, we can make the following generalization.
 is a real number, and if
  is a factor of a polynomial function
  then the graph crosses the x-axis at
  if k is odd, and touches the axis at when k is even.
Now that we have all the pieces, we can analyze polynomial functions and sketch their graphs.
EXAMPLE
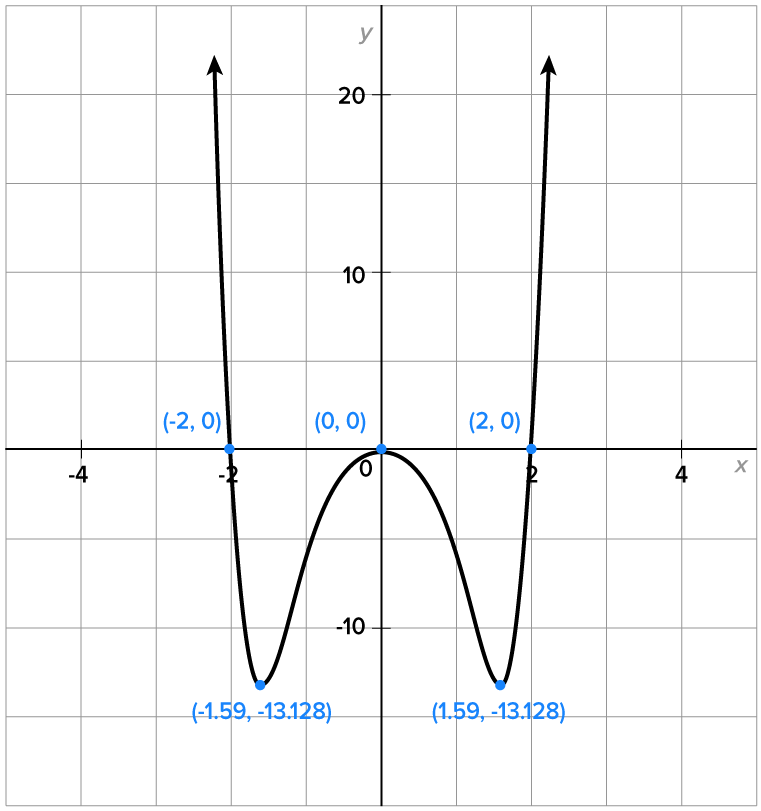
Find all relevant characteristics of the graph of
 , and as
 are 0 (with multiplicity 2), -2, 2, and
 do not correspond to x-intercepts since they are imaginary.
 and
and  and touches the x-axis at
  Since one of the x-intercepts is at
  we also already have the y-intercept.
is shown below.
we also already have the y-intercept.
is shown below.
Before looking at a different type of problem, here is something to consider.
 and
and 
Hopefully, you found that the zeros of each function are the same, therefore the “-4” has no effect on the zeros. In general,  and
and  have the same zeros. This information is helpful in writing a possible equation for a given polynomial graph. When doing so, the smallest possible degree is desired.
EXAMPLE
Write a possible equation with smallest degree for the polynomial that has the graph shown below.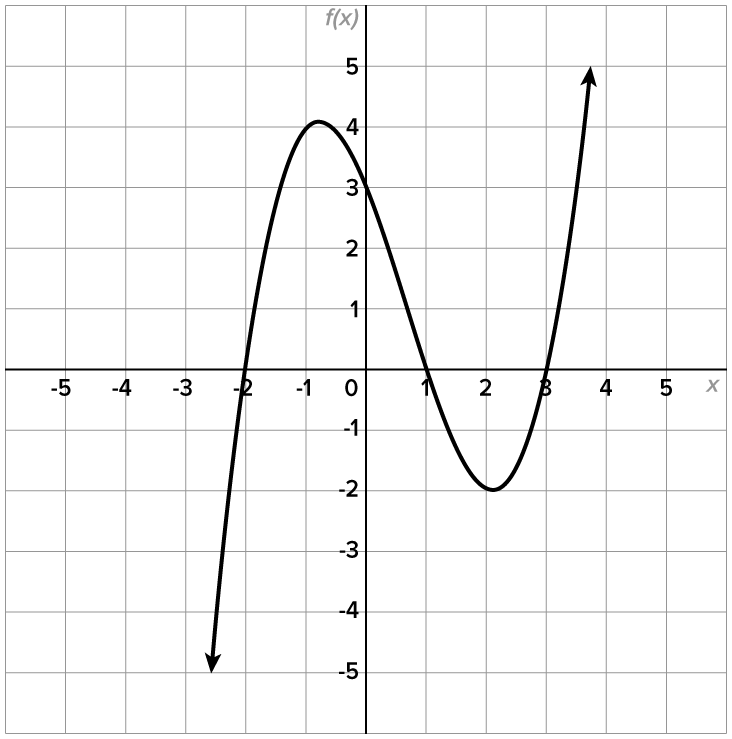 has a degree of at least 3.

 Also remember that any constant multiple,
  can be placed in front of the expression, which doesn’t affect the zeros.
 corresponds to the factor
 corresponds to the factor
 corresponds to the factor


 which means


Here is another example in which multiplicity is considered:
EXAMPLE
Write a possible equation for the polynomial graph shown below.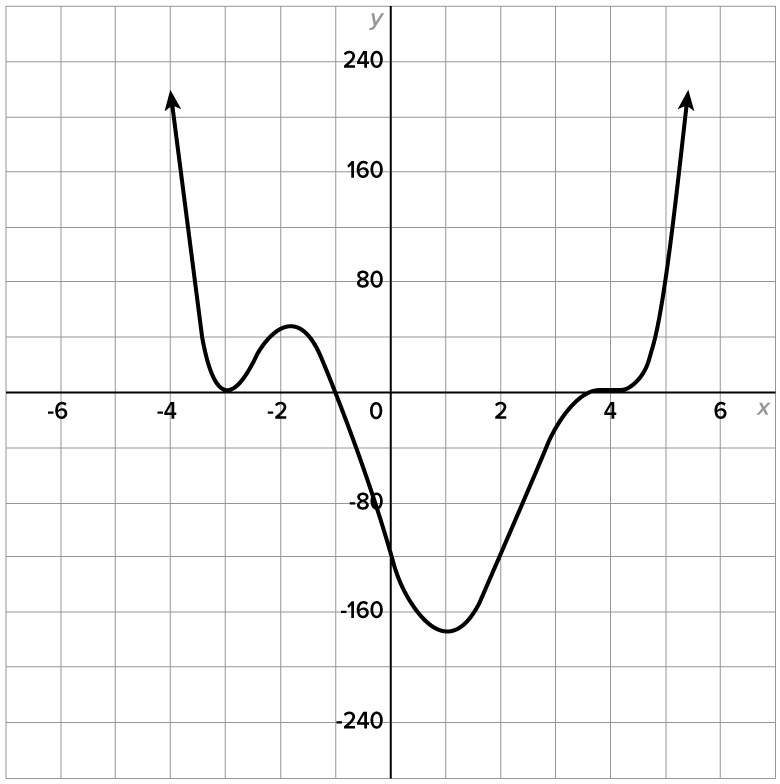

 and
and  suggesting that -3 is a zero with multiplicity 2. suggesting that -1 is a zero with multiplicity 1.
  but the curve flattens out around the intercept. This suggests that 4 is a zero with multiplicity 3.
  Also remember that any constant multiple can be placed in front of the expression, which doesn’t affect the zeros.
 with multiplicity 2 corresponds to the factor
 corresponds to the factor
 with multiplicity 3 corresponds to the factor

 is the y-intercept of the graph, we know that
 Then,
Then,  which means
 This means is a polynomial function with degree 6.

Notice that in the previous example, the resulting polynomial has degree 6, and the sum of the multiplicities is  This is not a coincidence.
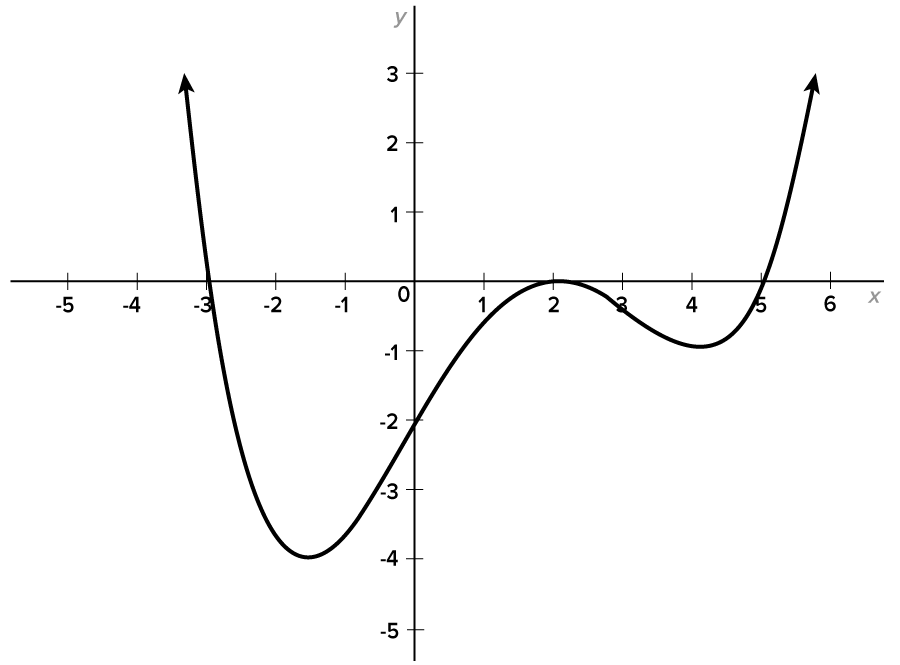 and
and  as well as y-intercept
 and
and  has factors of
  and
and  respectively.
 has a factor of
 to consider, since we must also ensure that the graph passes through

 since the y-intercept is

 Since is the product of 4 linear factors, has degree 4.
 SOURCE: THIS TUTORIAL HAS BEEN ADAPTED FROM OPENSTAX "PRECALCULUS” BY JAY ABRAMSON. ACCESS FOR FREE AT OPENSTAX.ORG/DETAILS/BOOKS/PRECALCULUS-2E. LICENSE: CREATIVE COMMONS ATTRIBUTION 4.0 INTERNATIONAL.