This lesson discusses identifying measures of center on a graph. By the end of this lesson, you should be able to identify the mode on a graph. Specifically, this lesson covers:
1. Identifying the Mode on a Bar Graph
There are three measures of center: mean, median, and mode. Representing these measures of center on a graph can help communicate information visually by summarizing and organizing the data set. This communicates something meaningful with the data. Take a quick look at a bar graph to refresh your memory.
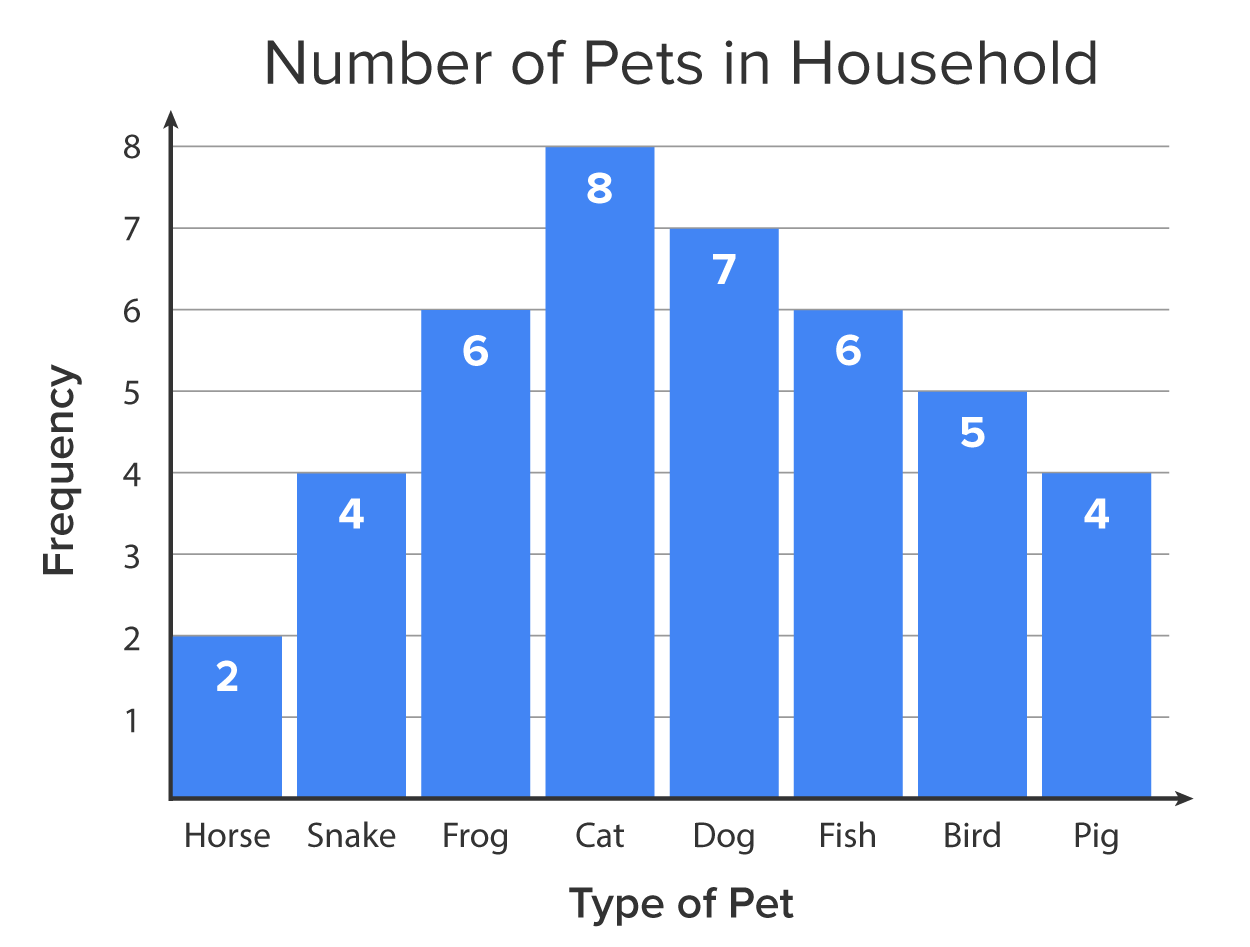
The horizontal axis tells what your variable is. The vertical axis tells how many of a particular observation there are. The individual bars are of a certain height based upon how many observations of a specific value of the variable exist.
Of the three measures of center, the mean is the average of a data set. The median is the middle value, where half of the other values are larger and half are smaller. The mode is simply the value that occurs most often.
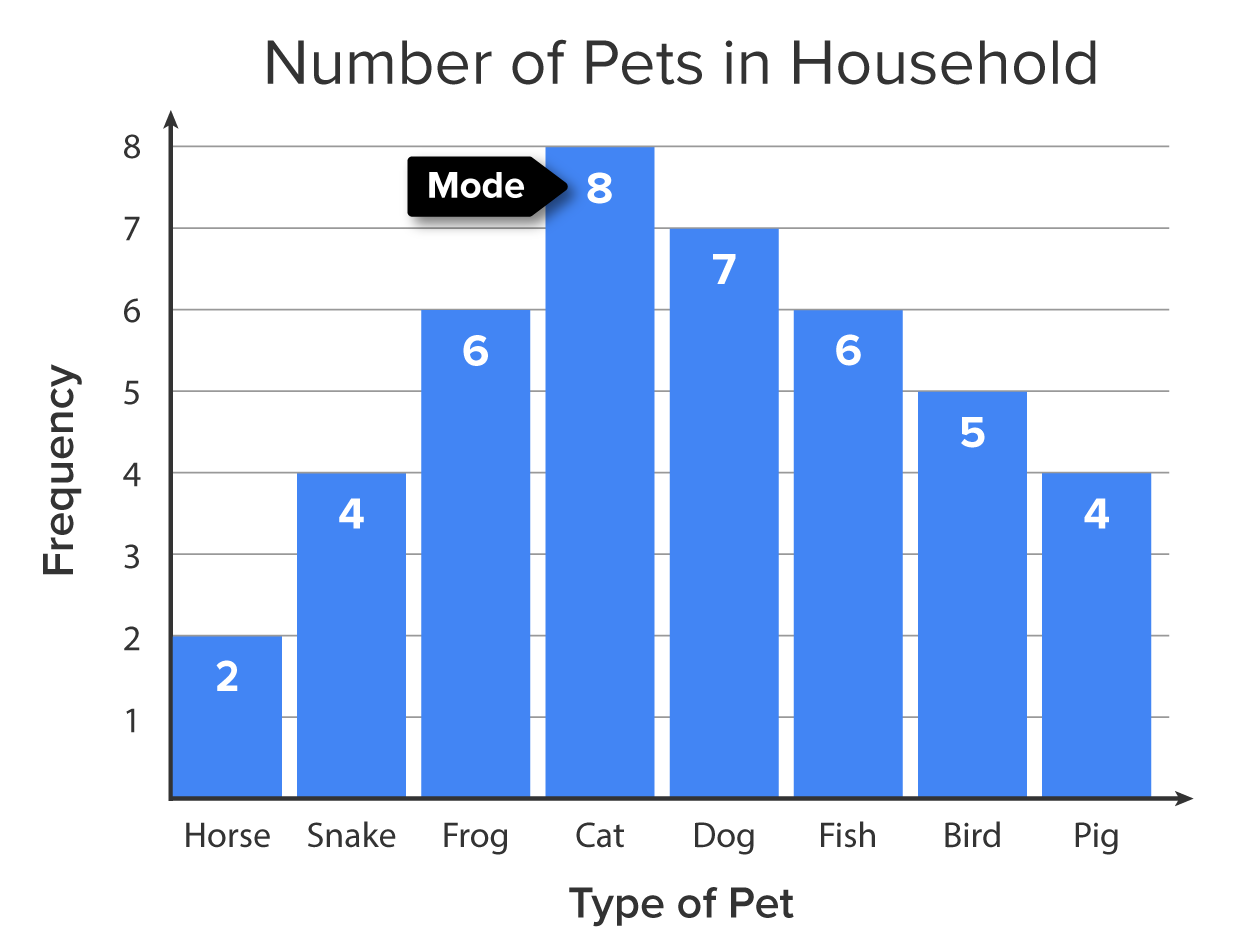
Two graphs often used in statistics are bar graphs and histograms. In a bar graph, the mode is the value on the horizontal axis with the highest bar.
-
EXAMPLE
This bar graph illustrates the grade distribution for a particular exam. You can see the tallest bar in this graph happens to represent the grade C.
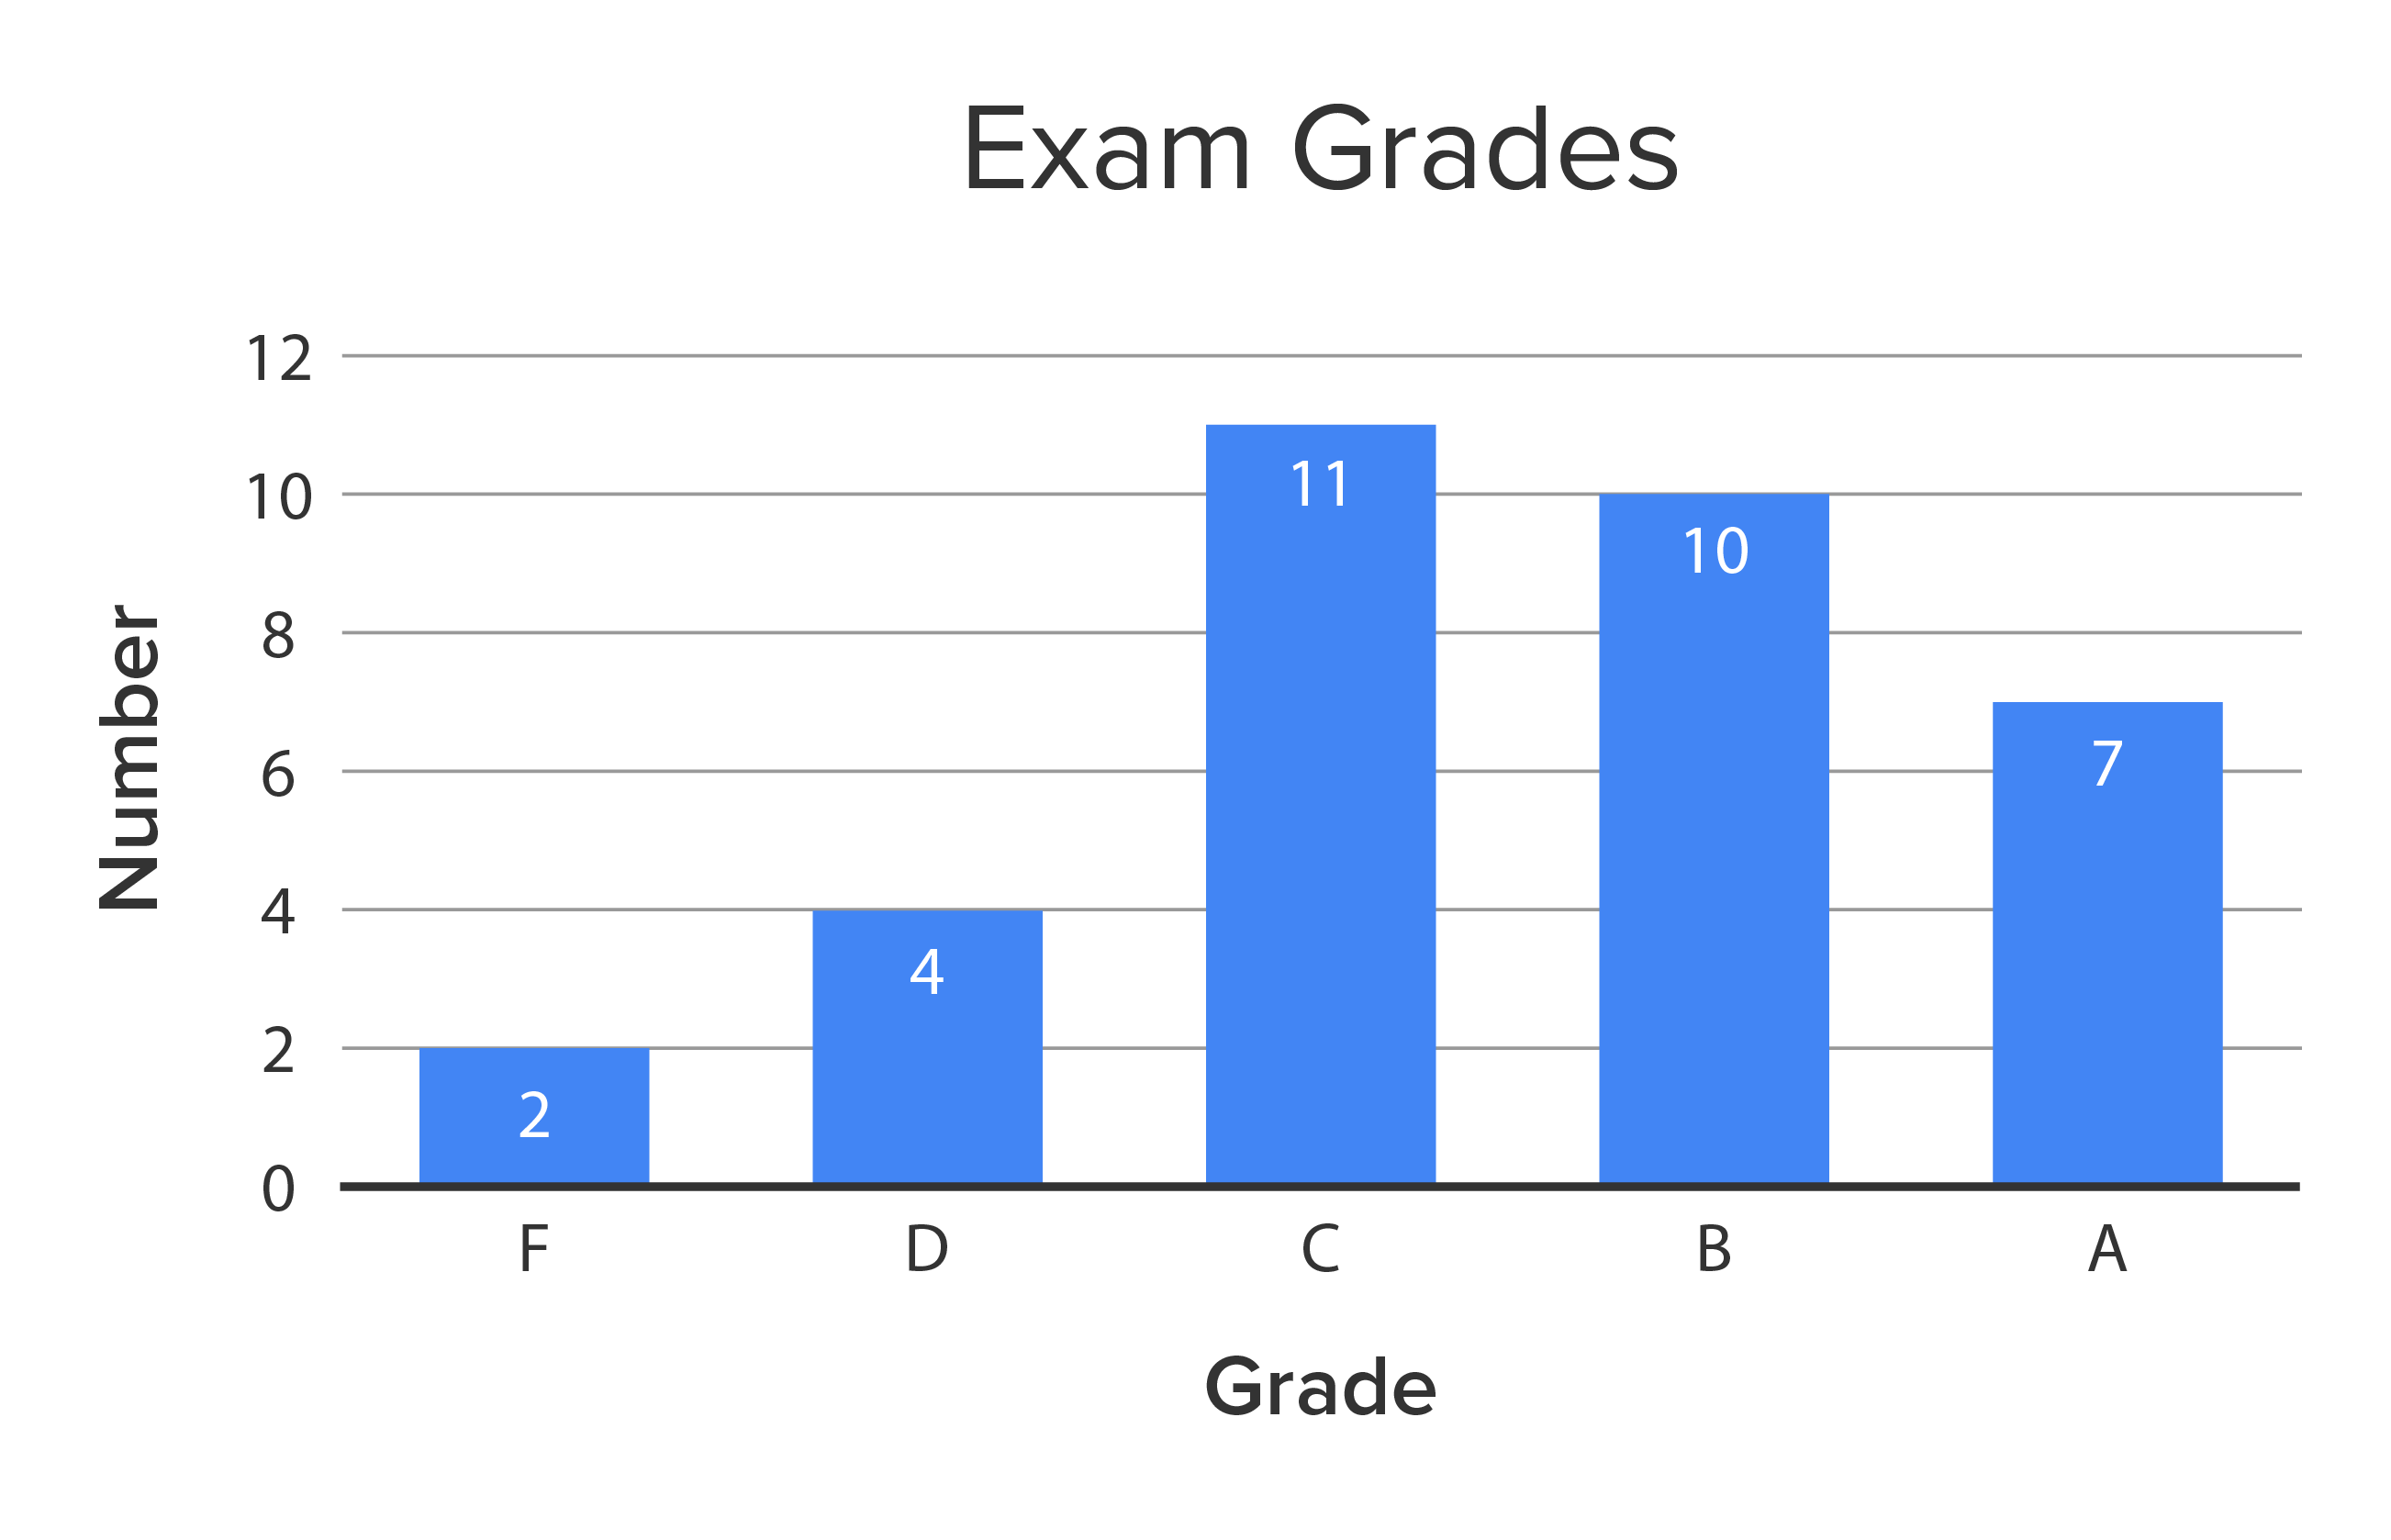
There are 11 Cs out of the entire class. This value would be considered the mode because it does occur most often in this data set.
2. Identifying the Mode on a Histogram
Histograms, on the other hand, show data grouped together in intervals. Since there are several values represented in each bar, you cannot state precisely what the mode is. If you have continuous data, it is possible that the data is unique, and there is no true mode. While there are methods used to approximate the mode from a histogram, we’ll use the midpoint of the highest bar.
Consider the histogram below.
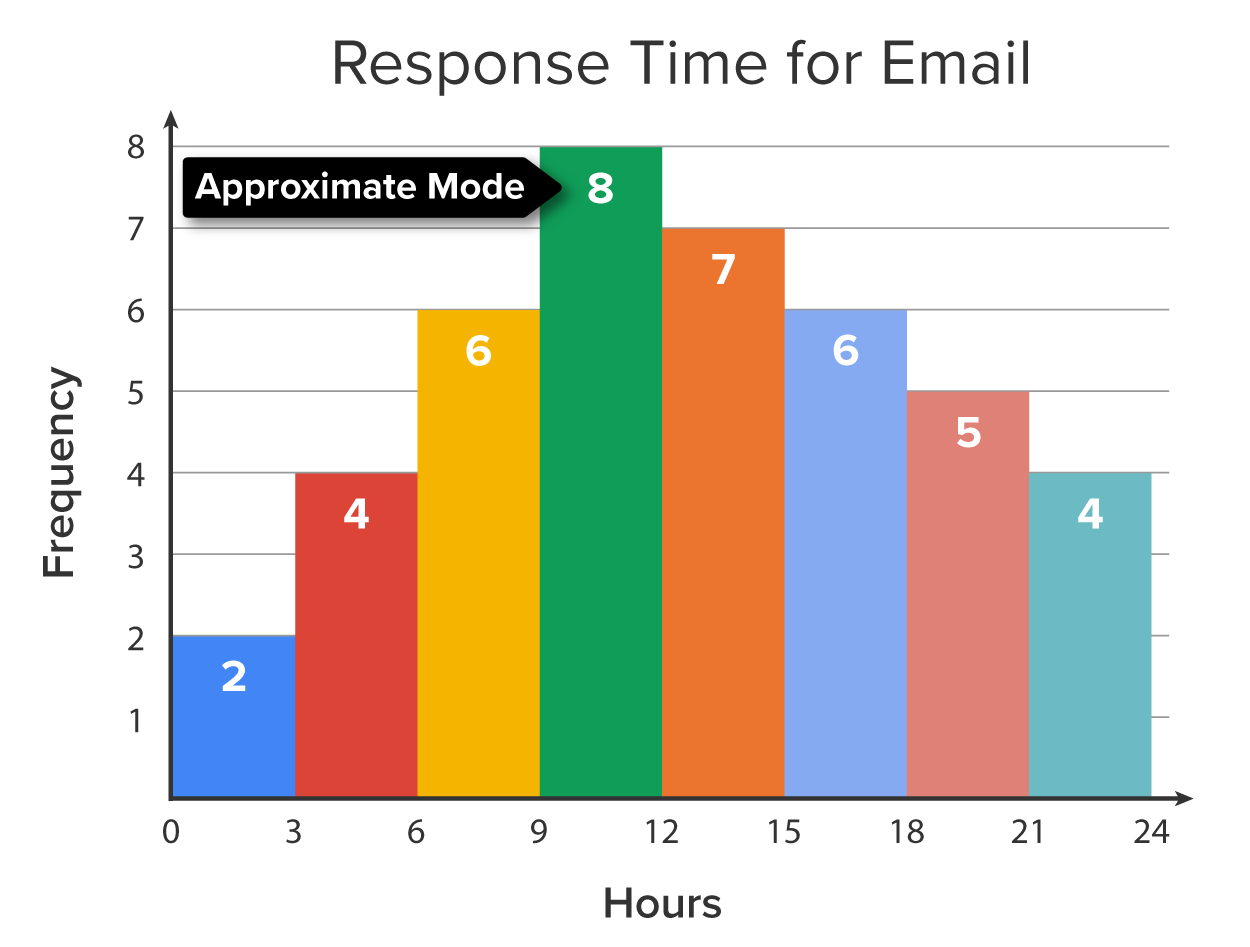
Notice the values on the horizontal axis (hours).
- The first bar contains values between 0 and 3, but does not include 3.
- The second bar contains values between 3 and 6 but does not include 6.
- In general, the left-hand value of each bar is included, and the right-hand value is not included.
- The numbers inside each bar represent the frequency of each interval of values. For example, there are 2 values between 0 and 3; 4 values between 3 and 6, etc.
In addition, we can say the following.
- The highest value represented by this histogram is less than 24, but at least 21.
- The highest frequency is 8, which means that the interval containing the most values is between 9 and 12 hours.
- The approximate mode is the midpoint between 9 and 12, or 10.5 hours.
-
EXAMPLE
Consider the histogram below, which represents the thermostat settings for a group of homes.

What is the approximate mode of the thermostat settings?
Solution: The highest value is 24, and that falls between the range of 69 and 72. With a histogram, you would say that the mode is the halfway point between 69 and 72 degrees Fahrenheit, or approximately 70½ degrees Fahrenheit.
In this lesson, you began with a review of the three measures of center: mean, median, and mode. Mean is the average of a data set; the median is the middle value, where half of the other values are larger and half are smaller; and mode is the value that occurs most often. Representing these measures of center on a graph can help communicate information visually by summarizing and organizing the data set. You learned that identifying the mode on a bar graph is simple: the mode is the value on the horizontal axis with the highest bar. You also learned that identifying the mode on a histogram is a bit trickier because histograms show data grouped together in intervals, so you cannot state precisely where the mode is. The mode is approximated by saying that it is in the center of the tallest bar.
Best of luck in your learning!