Table of Contents |
HR analytics is all about using data to make better decisions about people in a company. Insights from employee data are valuable for HR and business leaders. They provide useful information that can help improve business results. Leaders can use this data to plan for the future, whether it’s for the next few months or for long-term strategies. It’s crucial to make data meaningful. Just having a lot of data isn’t helpful unless it’s turned into something useful. In HR, people analytics can help make smart decisions about hiring, training, and keeping employees.
EXAMPLE
If a salesperson improves her sales with new techniques learned in a training session, that success can be used to create a new training program for the whole sales team.The term “people analytics” became popular thanks to Google, which calls its HR department People Operations. Google started its first formal people analytics group in 2007 to make all management decisions based on data. This shows the main goal of people analytics: to use data in decision-making processes that were usually based on experience and intuition.
HR analytics can be broken down into several types, each serving a unique purpose in helping HR leaders make informed decisions. Let’s explore a few key types and how they are used.
First, there’s descriptive analytics, which focuses on understanding what has happened in the past. This type of analytics involves collecting and analyzing historical data to identify trends and patterns. For example, an HR leader might use descriptive analytics to track employee turnover rates over the past five years. By understanding these trends, they can identify periods of high turnover and investigate the reasons behind them.
Next, we have predictive analytics, which is all about forecasting future outcomes based on historical data. This type of analytics can help HR leaders anticipate future challenges and opportunities. For instance, by analyzing data on employee performance and engagement, HR leaders can predict which employees are at risk of leaving the company. This allows them to take proactive measures to retain top talent, such as offering additional training or career development opportunities.
Prescriptive analytics goes a step further by not only predicting future outcomes but also recommending actions to achieve desired results. For example, if predictive analytics indicates a high risk of employee turnover, prescriptive analytics might suggest specific interventions, such as improving workplace culture or increasing employee benefits, to reduce this risk.
Diagnostic analytics is the last type of analytics we will explore. Diagnostic analytics aim to understand why something happened. This type of analytics involves digging deeper into data to uncover the root causes of certain events or trends. For example, if an organization experiences a sudden spike in employee absenteeism, diagnostic analytics can help identify the underlying factors, such as workplace stress or dissatisfaction with management.
By leveraging these different types of HR analytics, HR leaders can make more informed decisions, improve employee satisfaction, and ultimately drive better business outcomes.
IN CONTEXT
Case Study: Nielsen
Nielsen, a company specializing in measurement and data analytics, utilized people analytics to tackle an employee retention problem (Steiner, 2017). In 2015, the leader of one of Nielsen's most significant businesses sought help from the newly formed People Analytics group. She was concerned about the high attrition rate in her team and was losing her associates.
Indeed, turnover was a company-wide concern, and the people analytics team developed a model to address this issue. The initial model incorporated 20 employee data points, such as age, gender, tenure, and manager rating. A crucial discovery was that internal mobility was a vital factor in retention. Specifically, employees who had been promoted or had accepted a lateral job change within the past two years were far less likely to leave.
Armed with this knowledge, Nielsen established a "Ready to Rotate" group to assist employees interested in internal transfers. The company also used the data to pinpoint high performers who were "at-risk"—those most likely to leave the company within six months—and arranged discussions that led to 40% of them being transferred to new roles.
Another significant discovery was the importance of the first year of employment. To address this, Nielsen initiated a program called "Golden Year" to monitor an associate's first year.
So, what were the business outcomes of these changes?
Unsurprisingly, these impacts also bolstered the credibility of the people analytics team.
- Voluntary turnover fell by nearly 50%, resulting in substantial HR expense savings.
- Internal job changes increased eightfold in the first year of the initiative.
- The annual retention rate of at-risk employees rose by 5–10% in most groups.
HR metrics are crucial tools for any organization aiming to reach its goals. Think of them like a doctor checking a patient’s vital signs. These metrics give insights into different parts of the workforce, like employee turnover, engagement, and productivity. By looking at these data points, HR professionals can spot trends and areas that need improvement. Additionally, HR metrics help set realistic goals and track progress. They make sure the company’s strategies match its workforce’s abilities and needs.
EXAMPLE
If a company sees low productivity, it can investigate the reasons why, such as job dissatisfaction, poor training, or ergonomic issues. Fixing these issues can lead to a more stable and motivated workforce.In short, HR metrics are more than just numbers; they tell the story of a company’s health and direction. By regularly checking these metrics, companies can make smart decisions that lead to success and growth.
A sample of key metrics, with calculations, are shown in the following table (SHRM).
| Key HR Metrics | Calculations |
|---|---|
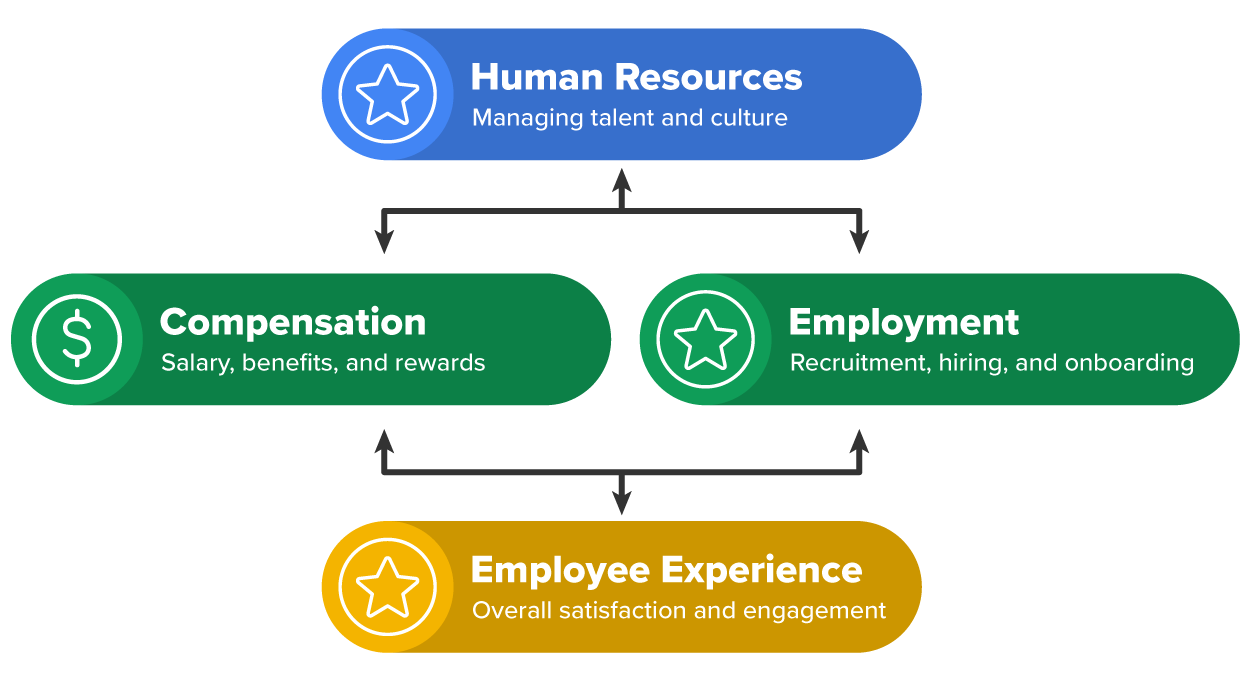
| Human Resources (Departmental) |
|
| Compensation |
|
| Employment |
|
It is important to understand the distinction between metrics and analytics. Metrics are the raw data points we collect, like turnover rates or average time to hire. They tell us what is happening. Analytics, on the other hand, is about interpreting those metrics to understand why things are happening and to predict future trends. For example, if metrics show high turnover, analytics might reveal it’s due to a lack of career advancement opportunities. Using both metrics and analytics allows HR to make informed decisions, address issues proactively, and strategically plan for the future.
IN CONTEXT
To understand the connection between HR metrics and people analytics, let’s consider the example illustrated by people analytics expert Erik van Vulpen below. (van Vulpen, 2018). Van Vulpen notes that the key distinction between metrics and analytics is that “metrics don’t say anything about a cause, they just measure the difference between numbers.” In contrast, people analytics makes the connection between people drivers and business outcomes. That is, people analytics determines not only why something is happening but also quantifies the impact. Then, so what? People analytics allows management to move from opinion to insight, as demonstrated in the following diagram.
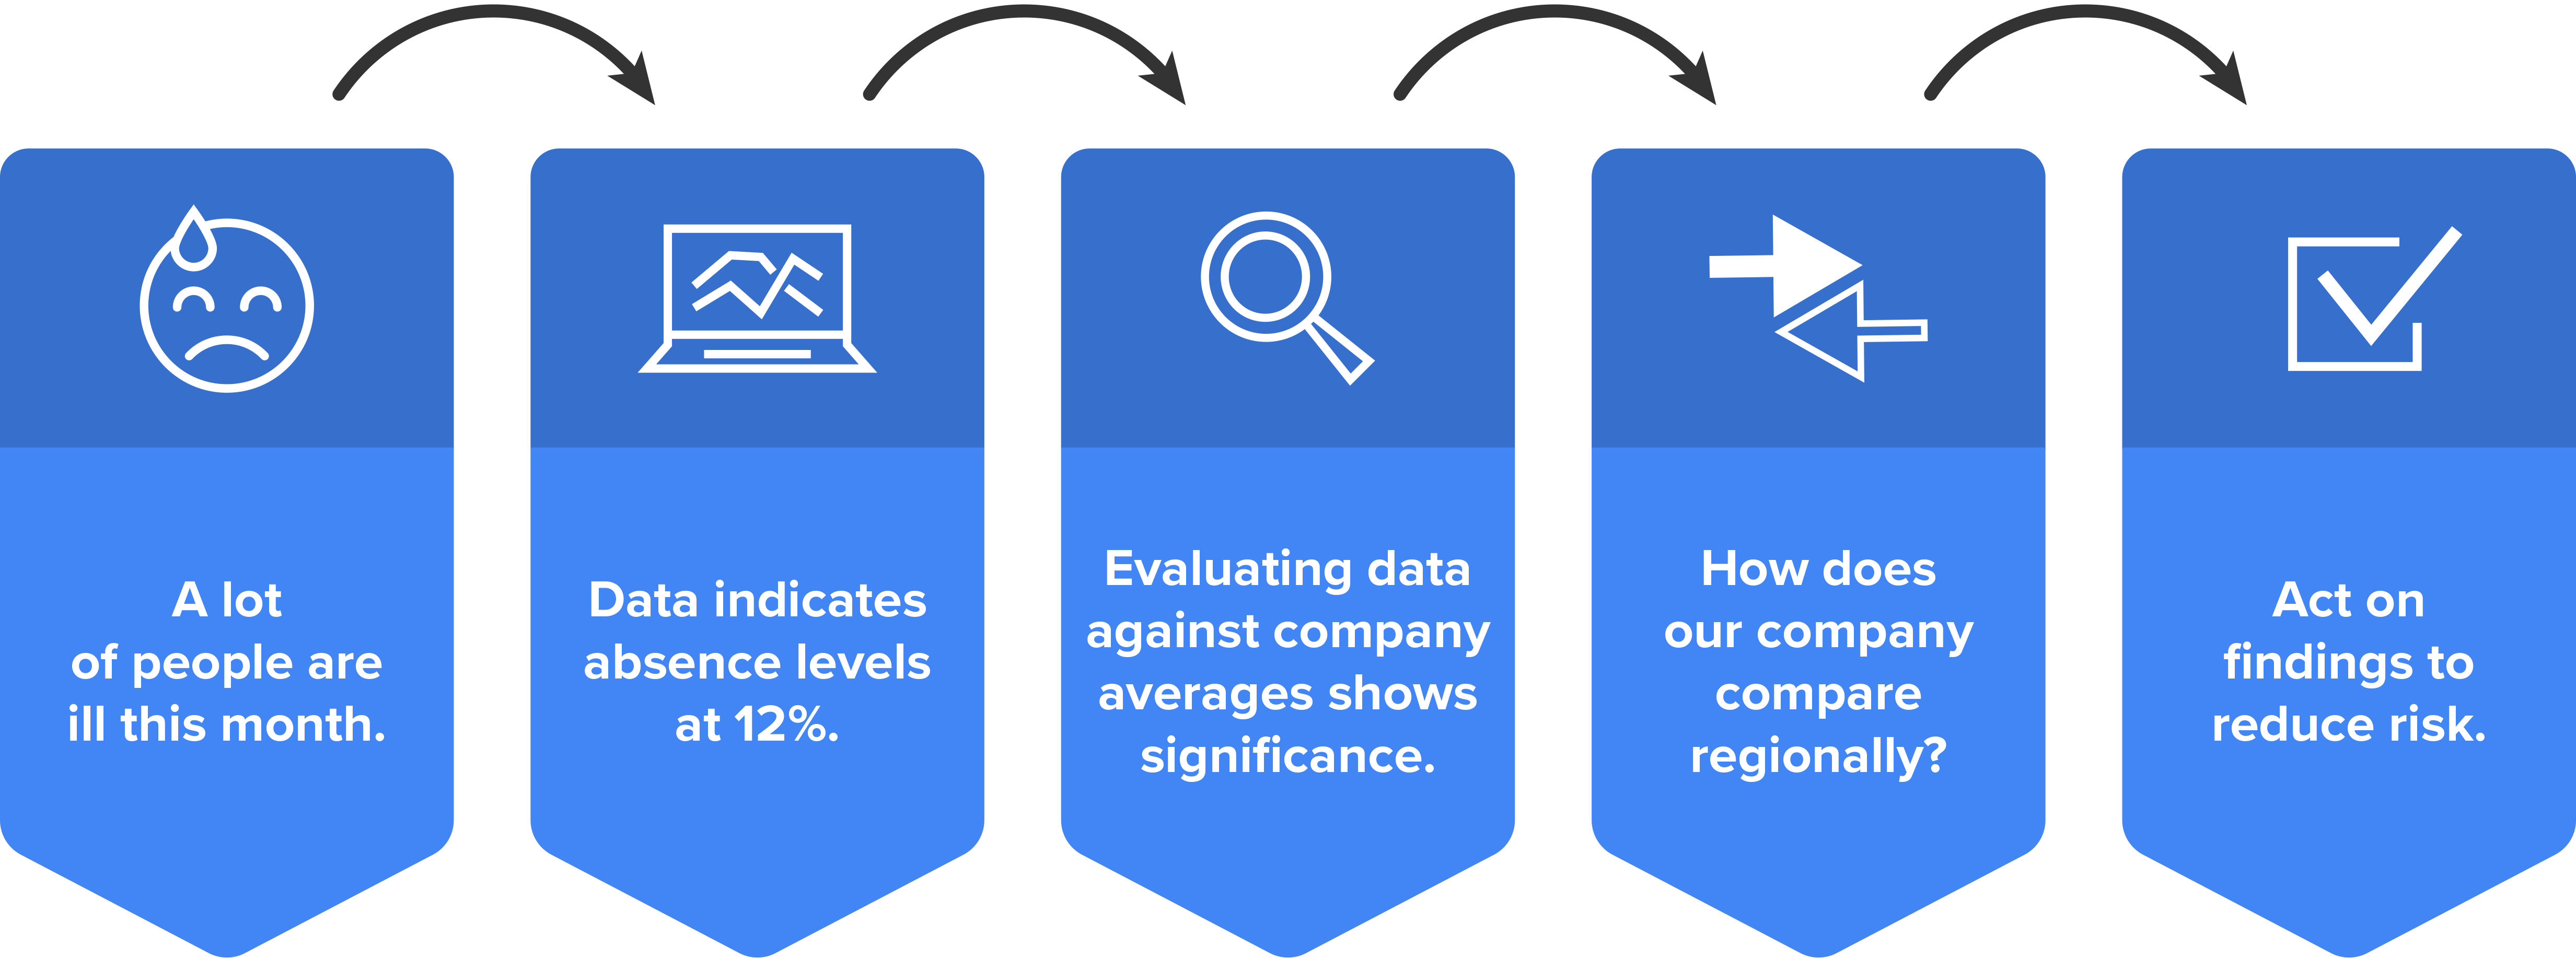
Let’s walk through the scenario:
- In this example, we start with the opinion that “a lot of people are ill this month.” This opinion may or may not be accurate.
- To determine whether this opinion is a fact, we would refer to the data, which indicates that absence levels for the month are 12%. However, one data point doesn’t tell us whether this is a relatively high or low percentage.
- To evaluate the data, we need a point of reference or norm. If the company average is 8.5% and the national average is 4%, we know the data is abnormally high and there’s a potential problem. This is where metrics can add value/perspective. For example, calculating the cost of lost productivity due to absence will quantify the issue. The calculation for cost of lost productivity is absence x number of employees x average labor cost. If the organization has 100,000 employees and an average annual labor cost of $50,000, the cost of absence is .12 x 100,000 x ($50,000/12) = $50,000,000. That’s a startling monthly number and clearly a question/issue worth resolving.
- Applying analytics helps identify causes. Let’s say the number of employees reporting flu-like symptoms has increased significantly. How does that compare with regional or country data?
- The final step is insight or, more specifically, acting on the insight. Given that the cost of flu-related illness poses a significant financial and operational risk, the company should consider ways to reduce that risk. For example, the company might consider sponsoring flu vaccinations or developing a contingency plan that involves tapping former employees or the alternative workforce.
Source: This Tutorial has been adapted from "Human Resources Management" by Lumen Learning. Access for free at https://courses.lumenlearning.com/wm-humanresourcesmgmt/. License: CC BY: Attribution.
REFERENCES
Fica, Tori. (2019, July 29). "Leading HR and Organizational Metrics from SHRM." Metrics 2.0. https://www.bamboohr.com/blog/key-hr-metrics
Steiner, Keenan. (2017, March 9). “People Analytics Isn’t as Hard as You Think—Nielsen Proves Why.” LinkedIn. https://www.linkedin.com/business/talent/blog/talent-engagement
van Vulpen, E. (2018, June 11). HR metrics and Analytics: How both can add value. AIHR. www.aihr.com/blog/hr-metrics-and-analytics-how-both-can-add-value/