Table of Contents |
Lab reports provide a model for research papers, which are the most frequently written documents in scientific fields. Lab report structure varies by field, but the goals of a lab report remain consistent: Identify an area to explore, conduct an experiment, document your findings, and communicate the significance of your results.
A well-written lab report demonstrates the researchers’ understanding of the concepts behind the data collected. Knowing the purpose behind the basic components of a lab report will assist you in organizing your ideas clearly and expressing your thoughts coherently.
The first step of a lab report is to state the hypothesis of the experiment. The hypothesis is a tentative explanation of observations that acts as a guide for gathering and checking information.
In science, we are always working to develop a better understanding of our universe. Science uses models as a tool to improve future understanding based on current understanding. A model is a representation created by the scientist to explain real world phenomena that cannot be directly observed, because the variables are difficult to manipulate. The model can be of a physical item, like a molecular model, or it can be a representation of a concept, like evolution due to natural selection. Scientists develop mathematical models that use data from complex systems to predict change over time, like tectonic movements or global warming. Models also allow us to make predictions about events that have not yet occurred, as with weather forecasting models.
In order to ensure that data are not excluded or misinterpreted from the model, scientists use a process called scientific reasoning to document and evaluate their observations. Scientific reasoning, also known as critical thinking, helps develop better models of understanding, by testing observations against scientifically established models. If the model holds true given the data, the model is supported. If the model does not hold true given the data, the model is rejected. Exciting science happens when an experiment provides data that fail to support a current model, and a new model must be developed!
IN CONTEXT
In Section 1 of your Touchstone Lab Reports, you will be asked to describe the overall simulation objective and your hypothesis. Let’s practice how to use the steps of critical thinking to answer a question about gases.
You’ve probably noticed that when the weather gets cold, the tires on your car appear a little “flatter” than normal, and when you check the tire pressure of the air inside, it is lower than normal. After determining that there is no air leaking out of the tires, you deduce that the change in pressure must be because of the change in temperature.
If we were to make a testable claim in the form of a hypothesis about the decrease in tire pressure, we would make a statement that answers a question, and which makes a testable prediction about the change in pressure. A hypothesis offers an explanation that then predicts an outcome. A good hypothesis might be: “In a closed container, cold air exerts less pressure than warm air. Therefore, I predict that increasing the temperature of the air back to the original temperature should return the tire to the original pressure.”
The second step of a lab report is to provide the reader with any background theory, previous research, or formulas needed to understand your experiment. Ask yourself, what information does the reader need to know to understand the importance of your experiment and data?
In this portion of your lab report, you will also explain in detail the previous models that have been used and tested that support or are related to your hypothesis. These previous models are often referred to as your reasoning or theory.
IN CONTEXT
In Section 2 of your Touchstone Lab Reports, you will be asked to introduce relevant background knowledge on the simulation topic. You will find research and references in the lab manual included with each simulation. Include supporting details from the lab theory to support the answers you list in the lab report.
Sticking with our example hypothesis that predicts gas behavior at different temperatures, we may want to present previous data that has been reported regarding pressure and temperature in gases. Our reasoning or theory may be presented in the following manner:
EXAMPLE
“Prior research by Joseph-Louis Gay-Lussac' in 1809, found that the pressure of a gas varies directly with temperature when mass and volume are kept constant (Gay-Lussac, 1809').”
The third step of your lab report will cover your experiment in detail. You will provide the reader a list of equipment and materials used.
You will then describe the experimental procedure in chronological order. The experimental procedure will state all the steps of the experiment in order, as they actually happened. It is essential for you to record the procedures as they occurred, even if the order was not consistent with the description in a manual, or how you thought it was supposed to happen. This is so that another researcher could replicate your experiment if they are testing for similar outcomes.
EXAMPLE
If you were supposed to expose a chemical to red light for five minutes, and you actually exposed the chemical to red light for seven minutes, you need to document an exposure time of seven minutes.If you deviated from your plan or standard procedure, be sure to document why. Deviations should be limited, and should only occur in situations where scientific discovery is needed.
EXAMPLE
Sticking with our chemical example, perhaps there was no change to the chemical in five minutes of light exposure, so you changed your exposure time to seven minutes. This would be an acceptable deviation.Deviations due to intentional error or carelessness by the researcher are not acceptable deviations.
EXAMPLE
Let's say our researcher intended to expose the chemical to red light for five minutes. However, the researcher stepped away to calibrate an instrument, and instead exposed the chemical to red light for seven minutes. It would not be acceptable to use this data, because the researcher was not present to observe the results after five minutes to justify a deviation from the planned procedure.In addition to the experimental procedure, you should also report your experimental methodology. The experimental methodology provides detail about your sample size, variables, statistical analysis, and methods used to account for error. Choosing the correct experimental methodology for your experiment helps the reader evaluate your experiment for validity and reliability.
Validity and reliability are concepts that readers can use to evaluate how well your experimental methodology and experimental procedure can test your hypothesis.
Validity is the extent to which your experiment results measure what they are supposed to measure. You can check the validity of your experiment by correlating the results with other measures of the same concept or with other established theories.
Reliability is the extent to which the results from your experiment can be repeated by another researcher under the same conditions. Reliability can be checked by comparing the results across time and across different parts of the experiment.
In order to minimize error, and to increase the reliability of data collected during experiments, measurements must be taken multiple times. The more times you collect the measurement, the less likely you will have error. However, replicating measurements takes time and money, and as a result, we typically only repeat measurements two or three times in a lab course setting.
IN CONTEXT
In Section 3 of your Touchstone Lab Reports, you will explain each step you completed in the simulation including the equipment and techniques you used. What was the experimental procedure you followed?
Continuing with our example hypothesis predicting gas behavior at different temperatures, our experimental procedure may be presented in the following manner
EXAMPLE
A sample of air was blown into a fixed-volume 1.0 L sealed cylinder until an internal air pressure of 25.0 psi was reached. This was repeated in two additional cylinders, for a total of three cylinders. All cylinders had pressure and temperature gauges attached. All cylinders were left to acclimate to room temperature for 20 minutes, at which time the temperature and pressure of each cylinder was recorded. Each cylinder was then placed in an ice bath for 15 minutes, and temperature and pressure were recorded every minute. The temperature vs. pressure data was then plotted on a graph to visualize the relationship between the variables.
The fourth step in writing a well constructed lab report is to report your findings. Results and observational data are usually reported in tables, graphs, and visual figures. Graphics should be clear, concise, and well labeled. Evidence is the scientific data that support the claim we have made.
Results should be explained in clear language. You can capture the reader's attention by providing a sentence or two that discusses the calculation, the trends, and any special features.
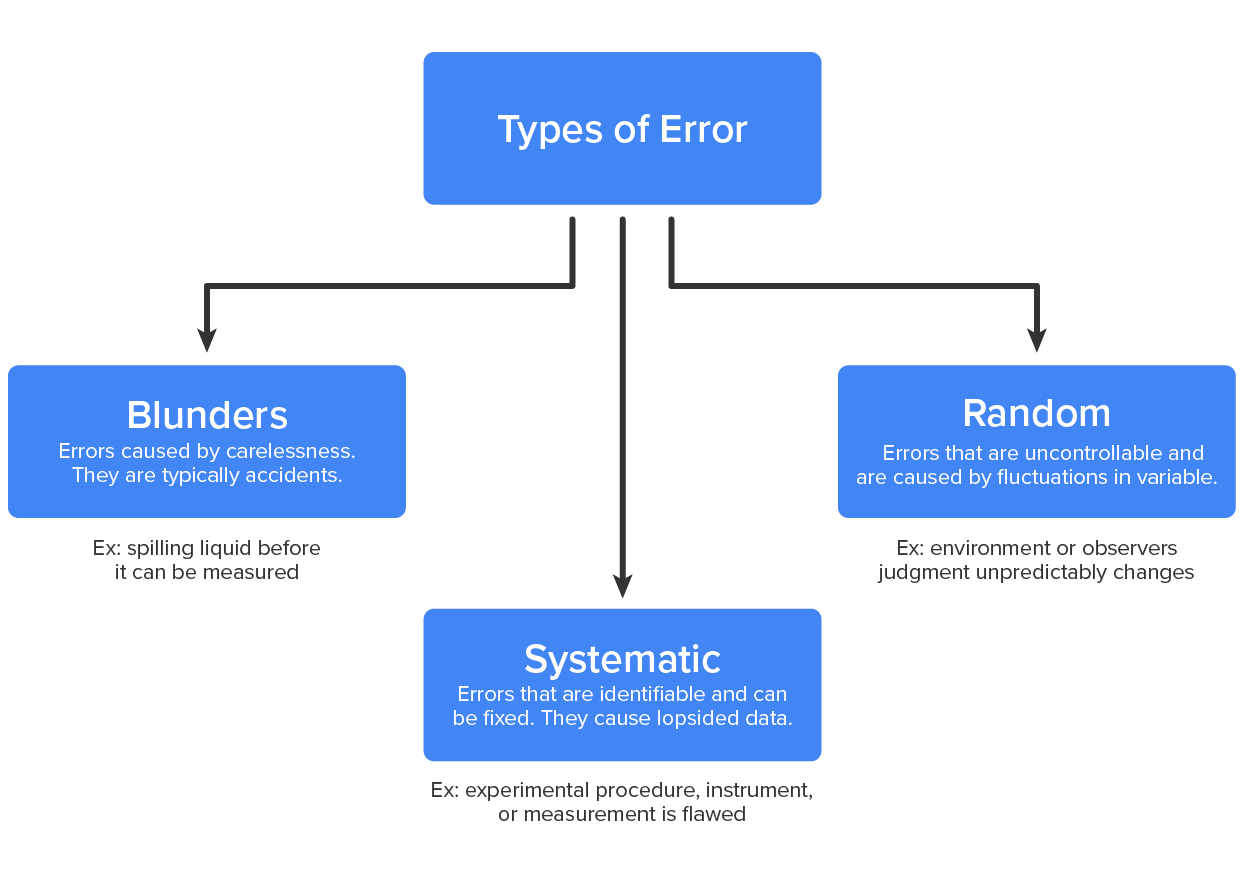
Errors can be random, systematic, or blunder errors. Random errors occur due to chance, and can be the result of slight fluctuations in instrumentation, environments, or measurement technique. Systemic errors result in measurements that are different even when conducted under the same conditions. Systemic errors have a clear cause and can be eliminated. Blunders are errors due to carelessness of the researcher, and they are considered outright mistakes.
IN CONTEXT
In Section 4 of your Touchstone Lab Reports, you will describe any obtained results from the simulation. Were these results expected or unexpected?
If we continue using our example of gas behavior at different temperatures, we may report our findings as follows:
EXAMPLE
Upon visual observation of the cylinder gauges, the pressure readings for each cylinder decreased as the temperature decreased.
The decrease in pressure associated with a decrease in temperature was expected.
In the fifth step of a lab report, you will explain, analyze, and interpret your results. This portion should be written in paragraph format, and it should be a discussion of what is not obviously apparent from your data. Your conclusions should answer the question: “What is the meaning of my experimental results?”
After you clearly explain your conclusions, you will then discuss any new questions that might be raised from the results. You will want to identify any ambiguities in the data, provide logical explanations for problems in the results, and account for any difference in the results from what you might have expected.
This is also where you will discuss any possible errors that could have occurred in human reporting, instrumentation, or in the environment. If you took steps to account for these errors, you will want to explain those steps and the limitations of your abilities to eliminate flaws in the experiment.
IN CONTEXT
In Section 5 of your Touchstone Lab Reports, you will describe the conclusions and implications if the simulation results. For example, how do your results relate back to the original purpose and your hypothesis? Were there any systematic sources of error that could have affected the results? What did you learn? What is the importance of these findings, and how can you apply them to other real world situations?
If we continue using our gas behavior example, a discussion paragraph may look similar to:
EXAMPLE
“The data indicates that pressure will decrease as temperature decreases. This observation has previously been made by Gay-Lussac in 1809. This explains why tire pressure decreases when the outside temperature becomes colder, giving the appearance of the tires going “flatter”. Further research should be conducted on the effects of volume on changing temperature and pressure. In this lab, we had a fixed volume, but what happens when the volume is able to change–will the temperature and pressure still be related?
References will include an itemized list of any resources, readings, or manuals you used to design, justify, or conduct your experiment. These items may include research articles, manuals, websites, videos, or reports. References are often used to justify the development of your hypothesis, the methodology chosen to conduct your experiment, and previous work that assisted in your interpretation of your results. Every field will have a preferred method for documenting references. Make sure you know what citation style is appropriate for your occupation.
Common styles of references are listed in the following table:
| Citation Style Abbreviation | Full Title | Field |
|---|---|---|
| APA | American Psychological Association | Social Sciences |
| MLA | Modern Language Association | Humanities |
| CMS | Chicago Manual of Style | History and Arts |
| APSA | American Political Science Association | Political Science |
| ASA | American Sociological Association | Sociology |
| CSE | Council of Science Editors | Scientific Disciplines |
| Harvard | Harvard Style | Economics |
| ACS | American Chemical Society | Chemistry |
| AMA | American Medical Association | Field of Medicine |
| IEEE | Institute of Electrical and Electronics Engineers | Engineering and IT Disciplines |
| NLM | National Library of Medicine | Field of Medicine |
| Vancouver | Vancouver Style | Medical Disciplines |
| Bluebook | The Bluebook: A Uniform System of Citation | Used in Political and Law Documents |
| OSCOLA | Oxford Standard for the Citation of Legal Authorities | Used in Political and Law Documents in the UK |
Appendices are graphs, pictures, reports, notes and tables that provide all your raw data and calculations. Reports from instruments, calibration information, or bench notes should be provided in the appendices. When referencing these items in other portions of the lab report, you will just make a statement such as: “Reports from scanning microscope are contained in appendix E”, or “Visual observations and images from Maine Coon kitten litter are contained in appendix A.” List appendices in chronological order, as they are referenced in the lab report.