Table of Contents |
Given a function  recall the following:

 , where x is a solution to
EXAMPLE
Consider the function
 This means the domain is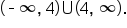
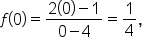 the y-intercept is
 and solve.

|
Set
|
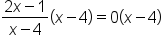
|
Multiply both sides by  since since 
|

|
Simplify. |

|
Solve for x. |
 is in the domain of f, the x-intercept is
 has y-intercept
  and x-intercept
Note that solving requires only that  This is because
  is in reduced form.
 it is only necessary to solve
  Be sure to check that
  This is intuitive since the only way for a fraction to be equal to zero is if its numerator is equal to 0 and its denominator is not equal to 0.
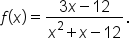 in factored form: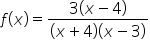


|
Set numerator equal to 0. |

|
Add 12 to both sides. |

|
Divide both sides by 3. |

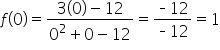

To graph a rational function, there are several characteristics to be considered:
EXAMPLE
Consider the function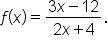
 or
or  is
is 

| Characteristic | Rationale |
|---|---|
|
The equation of the vertical asymptote is
|
Since is in simplest form, any real value of x where the denominator is equal to zero corresponds to a vertical asymptote. Setting we get
|
The equation of the horizontal asymptote is  This also means that as  and and  
|
Since the degrees of the numerator and denominator are equal, has a horizontal asymptote with equation  where b is determined by dividing the leading coefficients. where b is determined by dividing the leading coefficients. This means the equation of the horizontal asymptote is
|
|
The x-intercept is
|
To find the x-intercept, set and solve. This is equivalent to setting the numerator equal to zero. Solving  we get we get Since this value doesn’t also make the denominator equal to 0, the x-intercept is
|
The y-intercept is 
|
Since 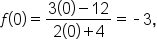 the y-intercept is the y-intercept is
|
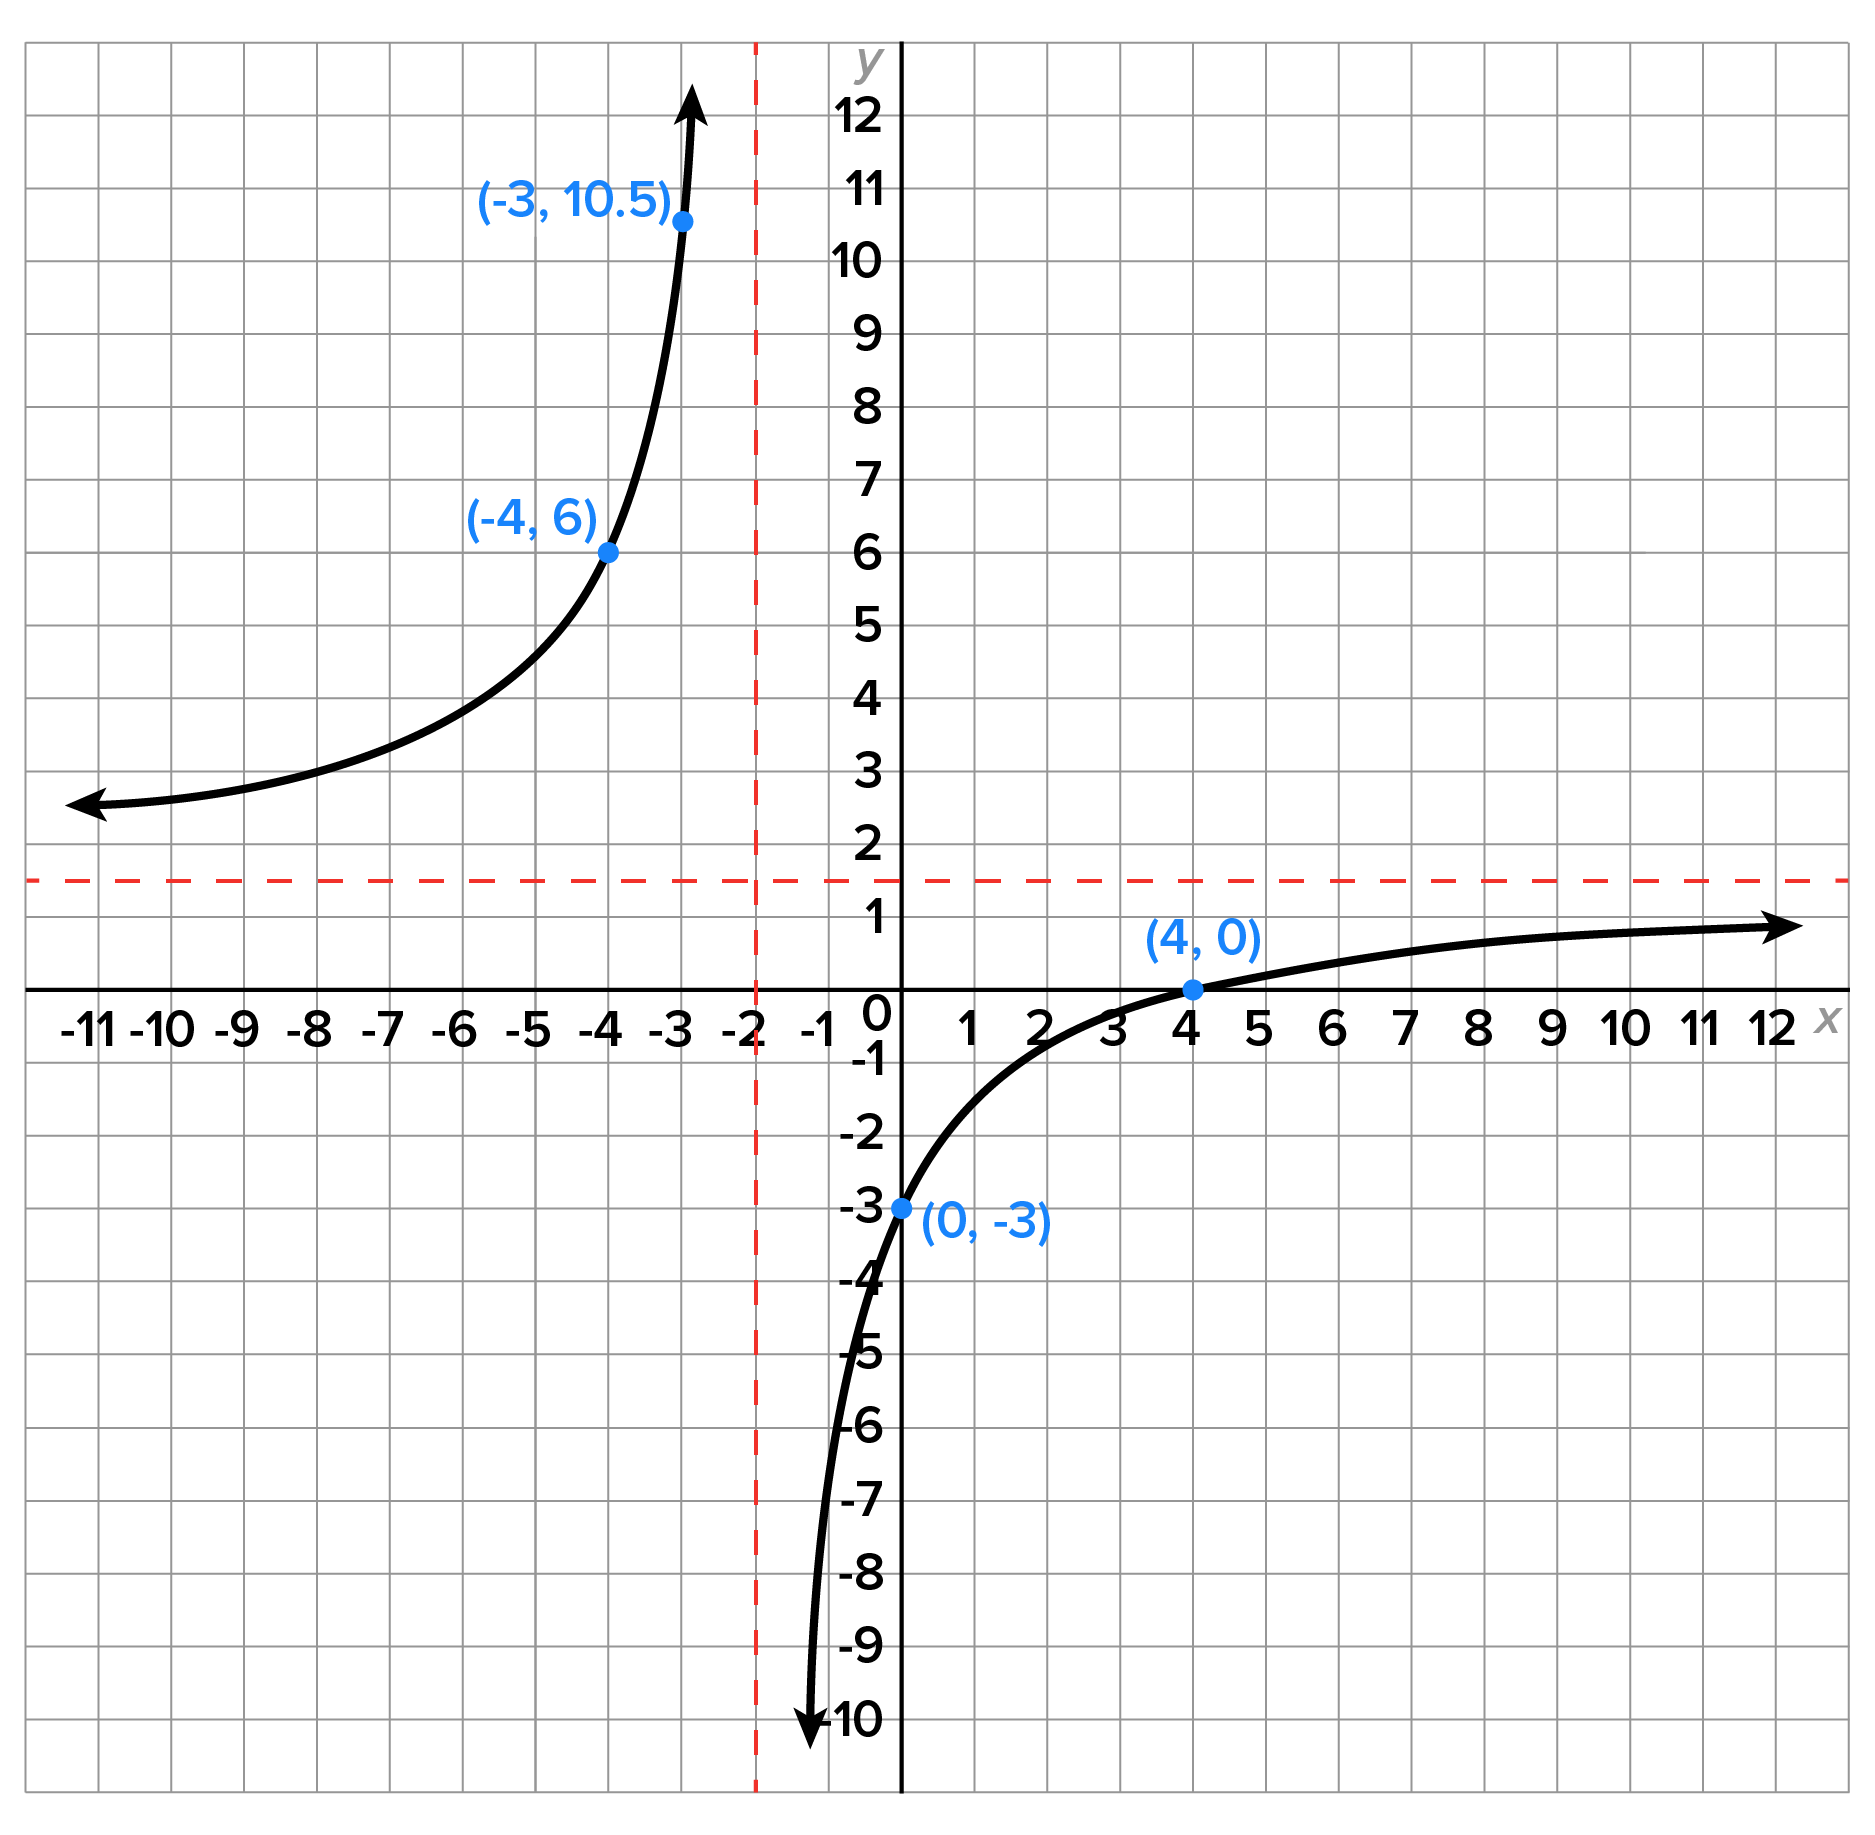 Notice how the horizontal asymptote guides the direction of the graph to the extreme left and right, and the vertical asymptote guides the direction of the graph as x gets closer to -2.
Let’s look at another example, this one with two vertical asymptotes.
EXAMPLE
Consider the function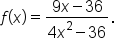
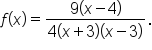 Since the numerator and denominator share no common factors, there are no holes in the graph of
is all real numbers except
Since the numerator and denominator share no common factors, there are no holes in the graph of
is all real numbers except  and
and  or in interval notation,
| Characteristic | Rationale |
|---|---|
The equations of the vertical asymptotes are and 
|
Since is in simplest form, any real value of x where the denominator is equal to zero corresponds to a vertical asymptote.
|
The equation of the horizontal asymptote is  This also means that as and 
|
Since the degree of the numerator is less than the degree of the denominator, has horizontal asymptote
|
|
The x-intercept is
|
To find the x-intercept, set and solve. This is equivalent to setting the numerator equal to zero. Solving  we get we get Since this value doesn’t also make the denominator equal to 0, the x-intercept is
|
|
The y-intercept is
|
Since 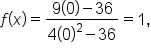 the y-intercept is the y-intercept is
|
Note that some coordinates are rounded to three decimal places.
 between
  and
and  and to the right of
EXAMPLE
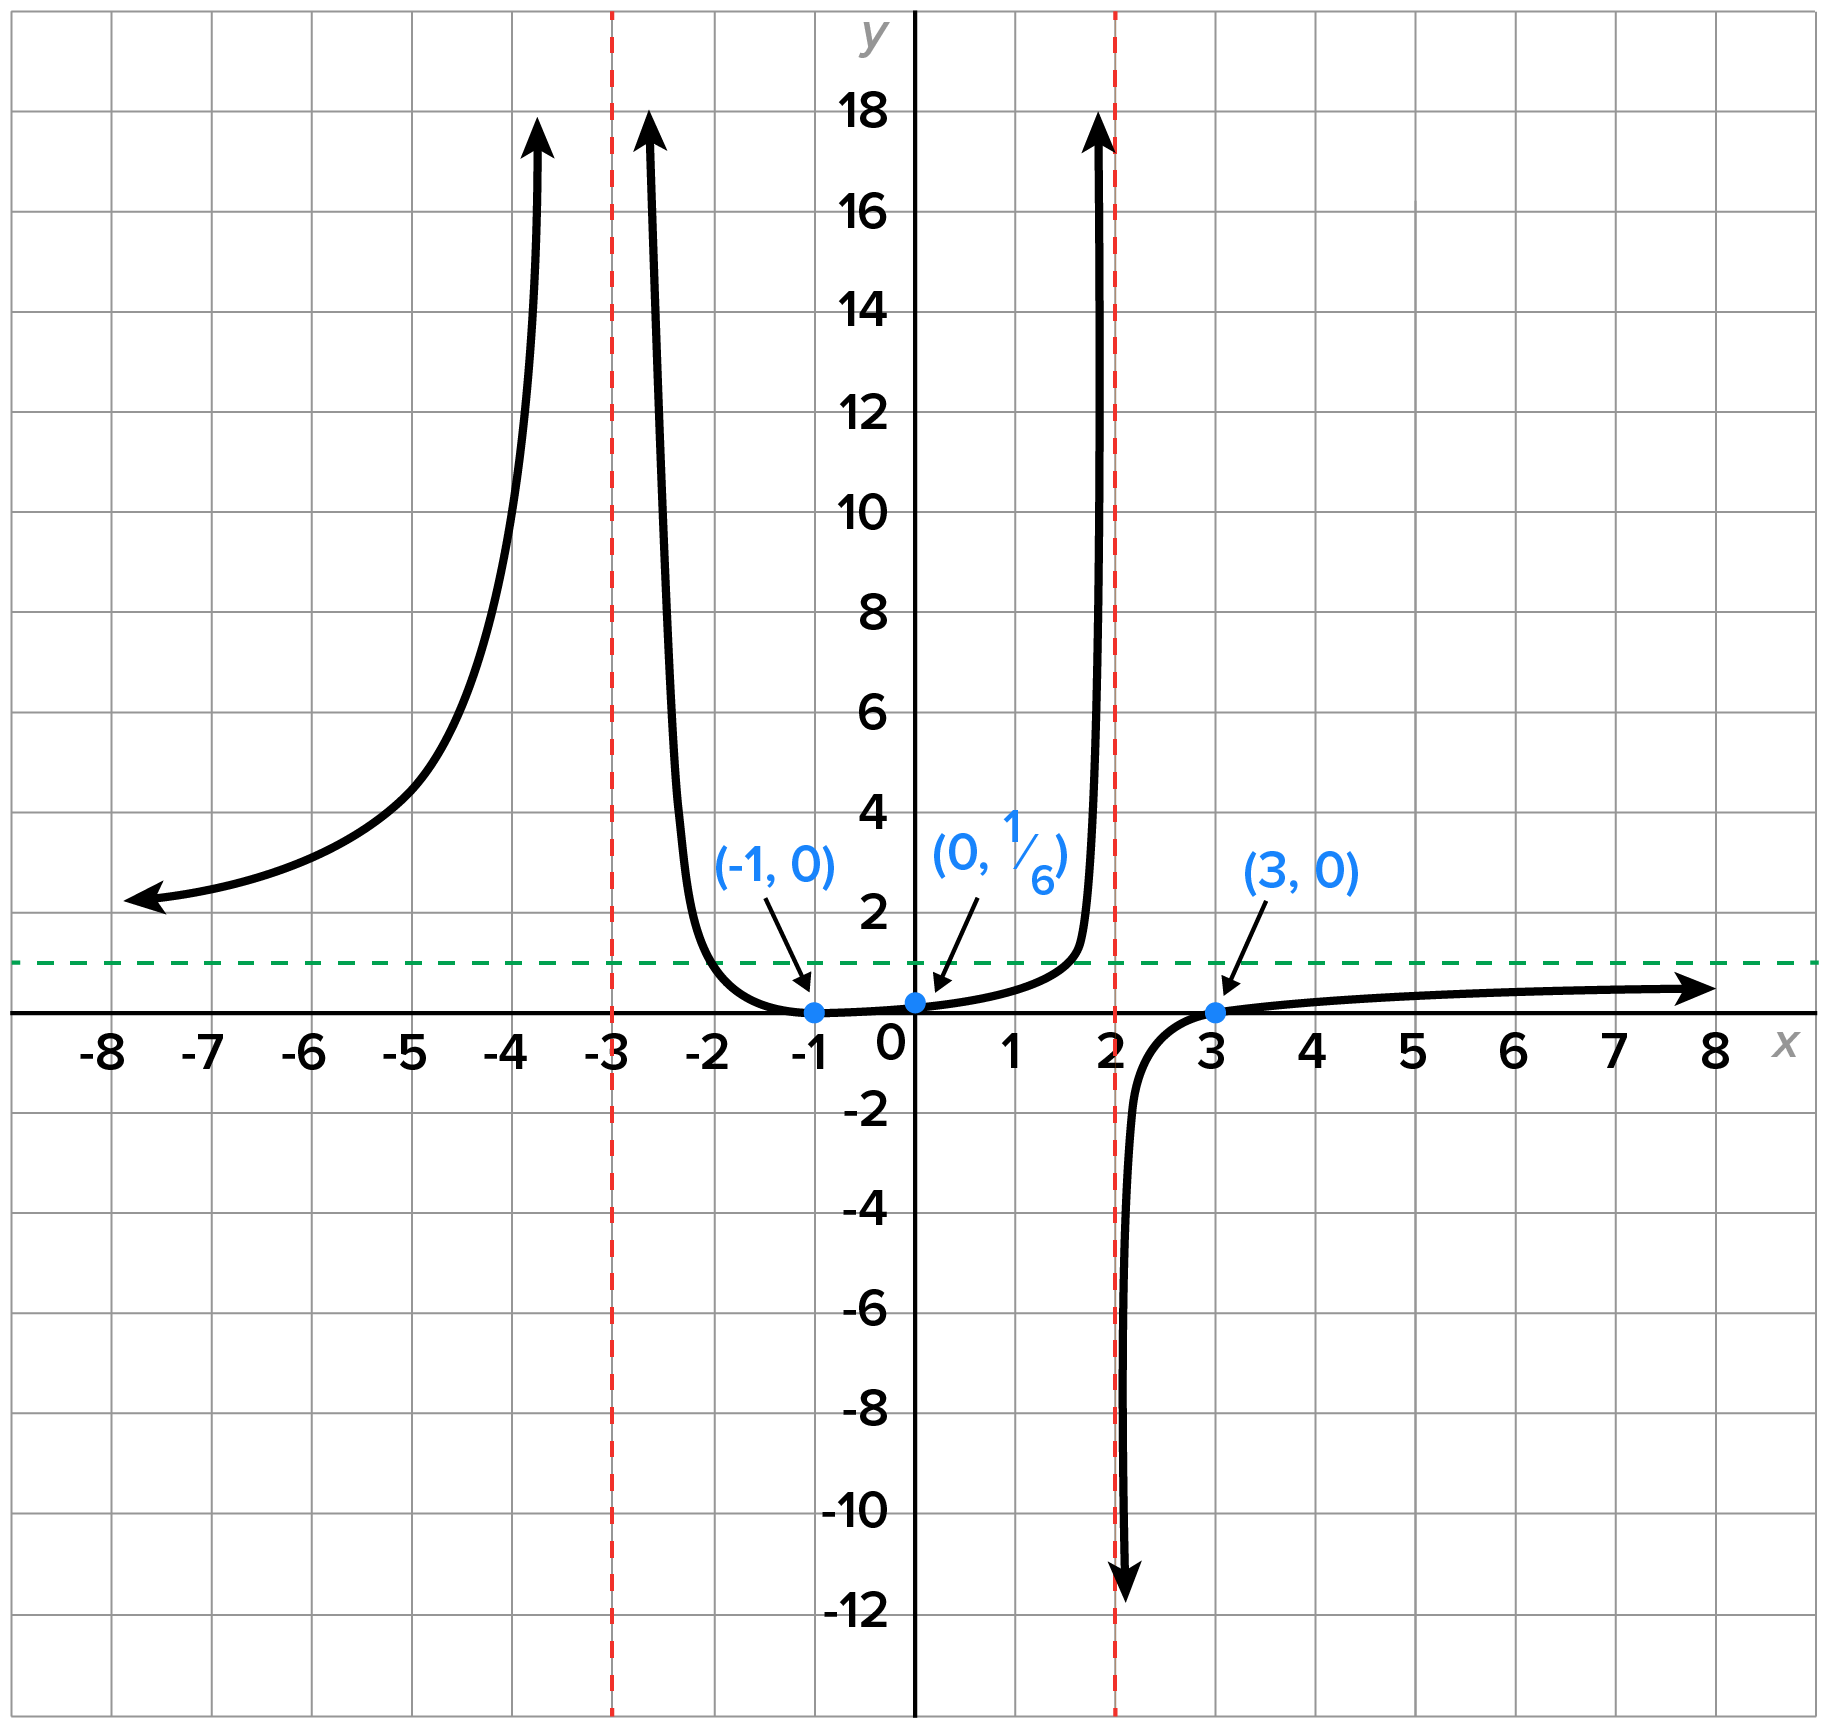
Consider the function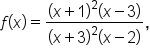 which has no common factor in its numerator and denominator.

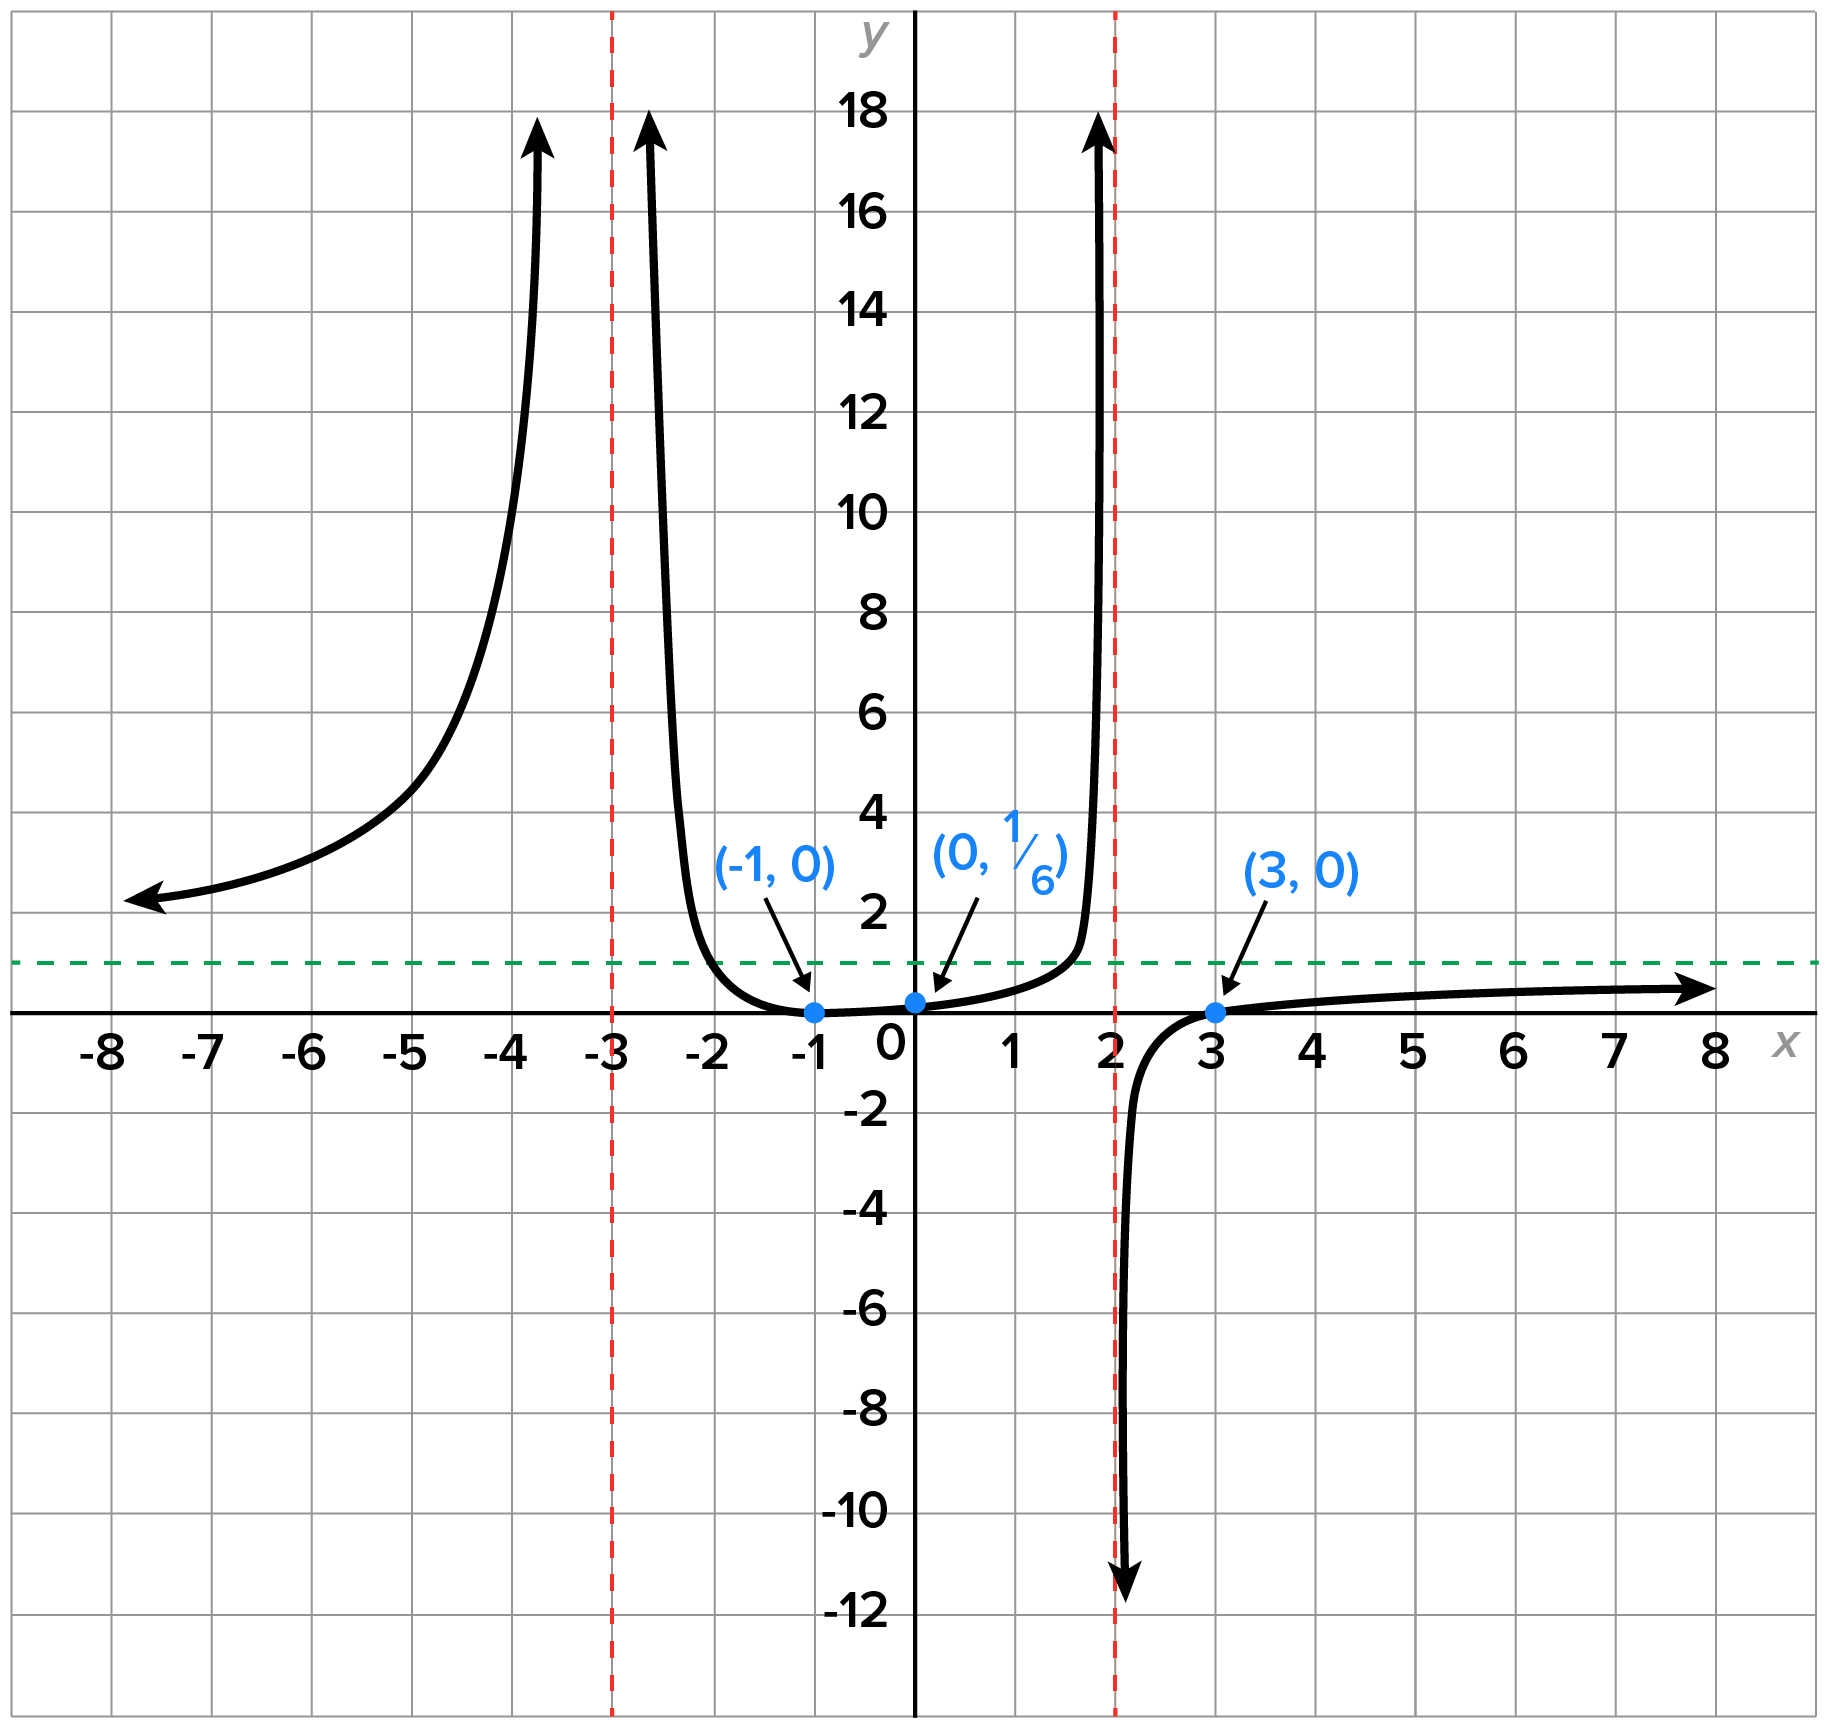 corresponds to the factor
  in the denominator. Notice that the graph rises indefinitely on both sides of the vertical asymptote
 corresponds to the factor
  in the denominator. Notice that the graph rises indefinitely on one side and falls indefinitely on the other side of the vertical asymptote.


 corresponds to the factor
  in the numerator, which suggests that
  has multiplicity 2.
 the y-intercept is
 corresponds to the factor
  in the numerator, which suggests that has multiplicity 1.
crosses its horizontal asymptote twice.
is a rational function in simplest form, then we know the following:
in the numerator, which suggests that has multiplicity 1.
crosses its horizontal asymptote twice.
is a rational function in simplest form, then we know the following:
 is a factor of the numerator and k is even, then the graph touches the x-axis at
  is a factor of the numerator and k is odd, then the graph crosses the x-axis at
 is a factor of the denominator and k is even, then the graph will either increase or decrease indefinitely on both sides of the vertical asymptote
  is a factor of the denominator and k is odd, then the graph will increase indefinitely on one side and decrease indefinitely on the other side of the vertical asymptote
 To find the points where the graph of intersects with its horizontal asymptote, set equal to the value of y in the horizontal asymptote, then solve.
EXAMPLE
Consider the function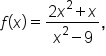 which has horizontal asymptote
  crosses
  set
set  and solve:

|
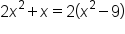
Set 
|
|
Multiply both sides by 
|
|
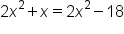
Distribute. |

|
Subtract  from both sides. This is now solved. from both sides. This is now solved.
|
 along with its horizontal asymptote and note the intersection point.
To determine where the graph of a rational function intersects its slant or nonlinear asymptote, let’s first work an example before deciding a general strategy.
EXAMPLE
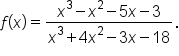
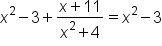
Consider the function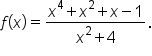 has a nonlinear asymptote.
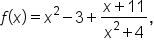 which means that the equation of the nonlinear asymptote is
  intersects with its nonlinear asymptote.
|
Set 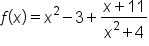 equal to equal to
|

|
Subtract  from both sides and add 3 to both sides. from both sides and add 3 to both sides.
|

|
Since  multiply both sides by multiply both sides by 
|

|
Solve for x. |
is in the domain of the graphs intersect when  The y-coordinate is
  Therefore, the point of intersection is
 is the remainder term of after the long division was performed. In general, the x-coordinate of the point of intersection is found by setting the remainder term equal to 0.
and its slant or nonlinear asymptote intersect…
in quotient-remainder form. at the value of x found in step 2. doesn’t intersect with the asymptote.
is the remainder term of after the long division was performed. In general, the x-coordinate of the point of intersection is found by setting the remainder term equal to 0.
and its slant or nonlinear asymptote intersect…
in quotient-remainder form. at the value of x found in step 2. doesn’t intersect with the asymptote.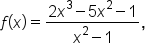 which has quotient-remainder form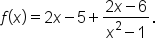
 and its slant asymptote intersect, set them equal to each other.
is any value of x for which the denominator is not equal to 0.
and its slant asymptote intersect, set them equal to each other.
is any value of x for which the denominator is not equal to 0.
 when
when  the domain of is
|
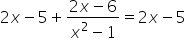
Set the quotient-remainder form of equal to the expression for the slant asymptote.
|

|
Subtract  from both sides and add 5 to both sides. from both sides and add 5 to both sides.
|

|
For the expression to be equal to 0, the numerator must be equal to 0. |

|
Add 6 to both sides. |
|
|
Divide both sides by 2. This is the solution. |
it follows that the graph of and its slant asymptote intersect when
into the equation  since this equation is simpler.
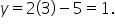 This means that the intersection point is
Here is an example with a hole in the graph.
EXAMPLE
Consider the function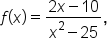 which has factored form
 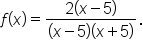 is all real numbers except -5 and 5; or in interval notation,
 between the numerator and denominator. This means that can be written in a simpler form, namely
  where
where 

 is zero when
  which indicates that has vertical asymptote
 therefore, there is a hole in the graph of at
  or
or 
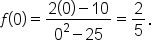 This means that the y-intercept of the graph is
  is a factor of the numerator of which would suggest that
  corresponds to an x-intercept of the graph of However, since is not in the domain of f, there is no x-intercept at
  Since this is the only possibility, there is no x-intercept.
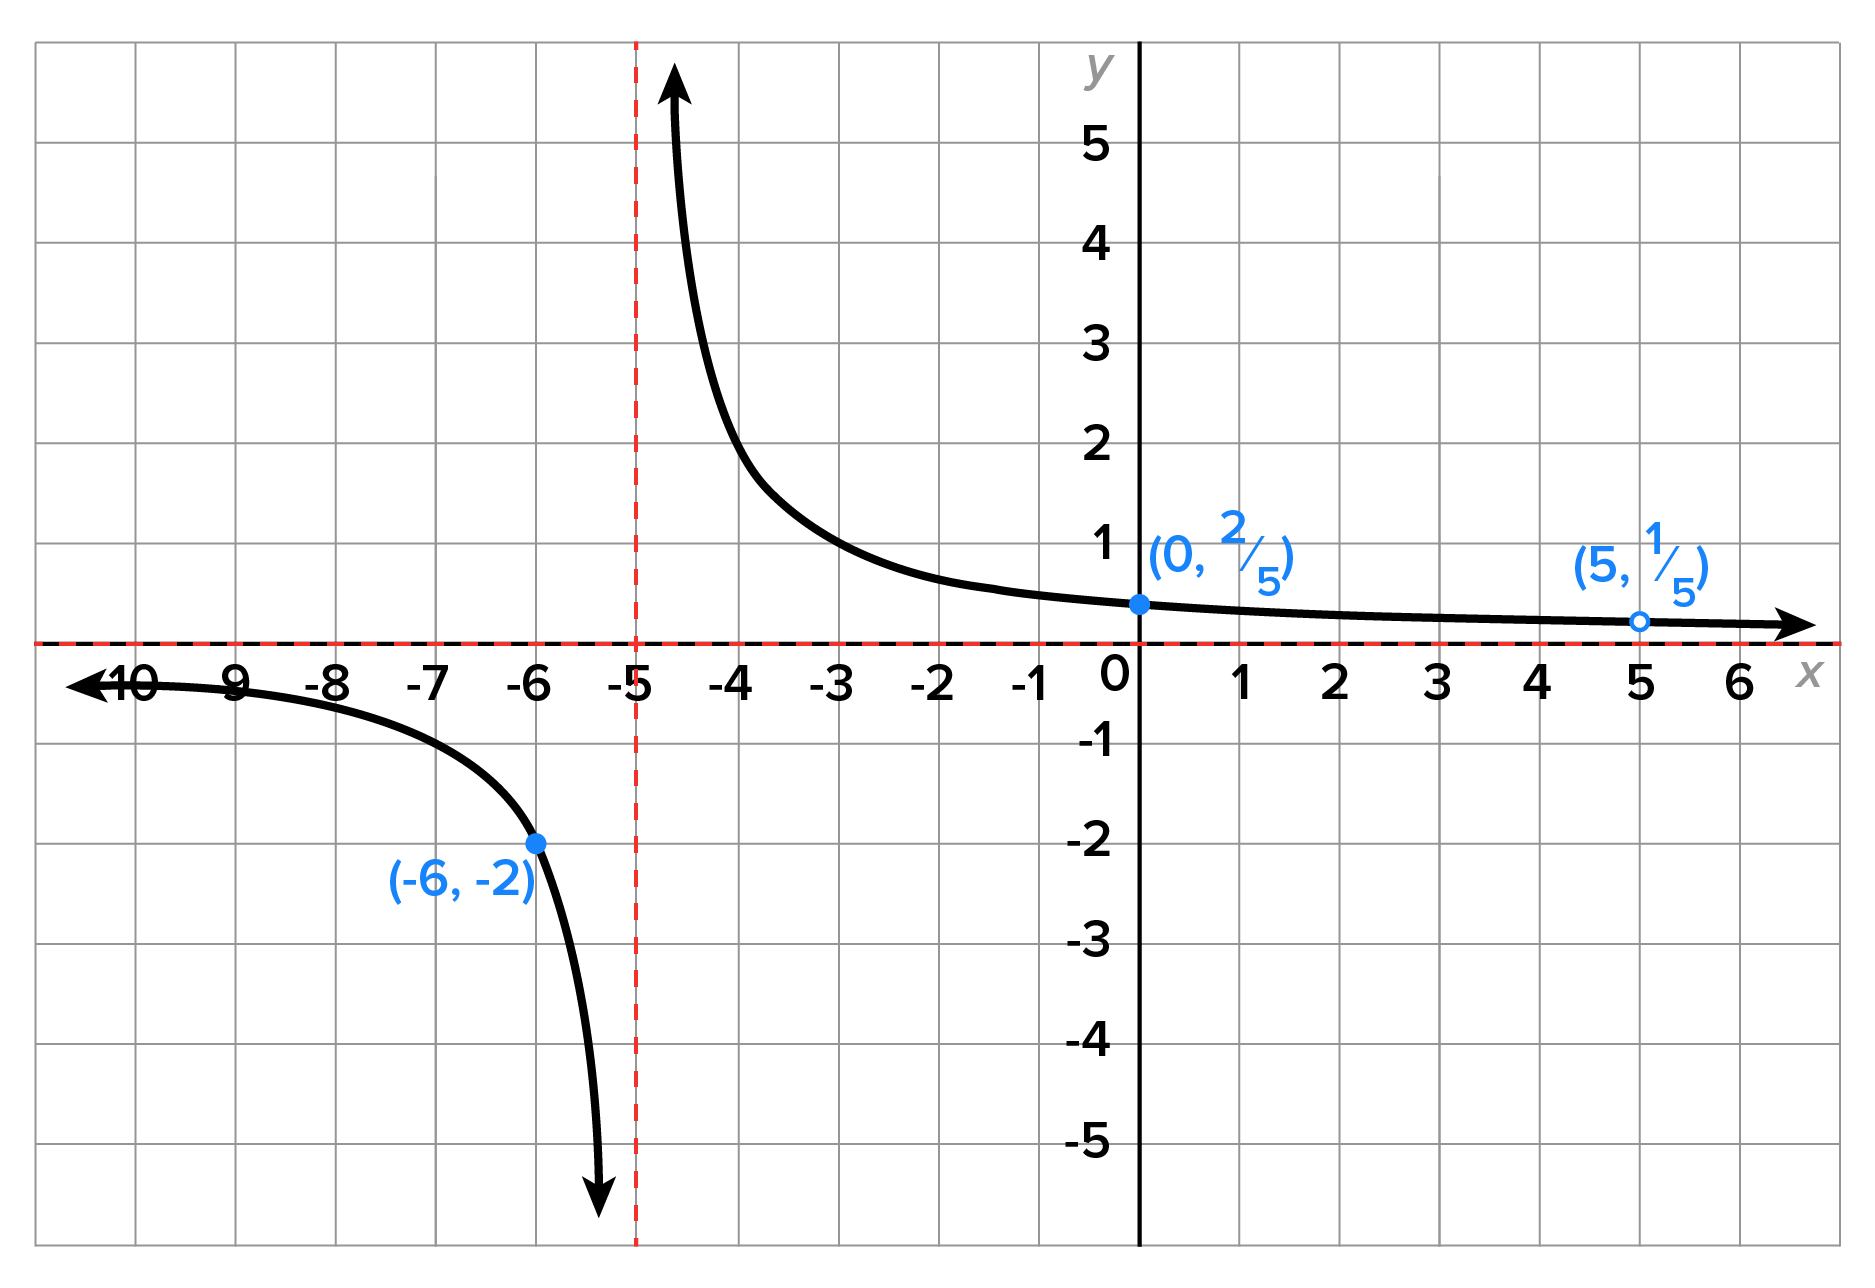
 was added to show a point on the left side of the vertical asymptote.
IN CONTEXT
When using technology to graph a rational function that contains a hole, it is not usually visible on the graph. Most graphing programs actually make it look like the graph passes through the point where the hole is located. This is a shortcoming of the technology. This is why it is important to be able to analyze graphs using algebraic techniques—technology is not always perfect!
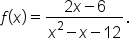 in factored form:
 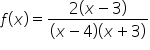 and This means that the domain of is the set of all numbers except 4 and -3, expressed as
  using interval notation.
and
has no common factor between the numerator and denominator, there is no hole in the graph of
is already in simplest form, the x-intercept is found by setting the numerator equal to 0 and solving:
using interval notation.
and
has no common factor between the numerator and denominator, there is no hole in the graph of
is already in simplest form, the x-intercept is found by setting the numerator equal to 0 and solving:
|
|
Setting the numerator equal to 0. |
|
|
Add 6 to both sides. |
|
|
Divide both sides by 2. This is the answer. |

 This is possible since 0 is in the domain of
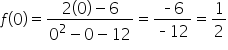
 does intersect its horizontal asymptote, which has the equation
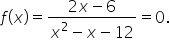 We actually already found the solutions when finding the x-intercepts, which was the point
intersects its horizontal asymptote at its x-intercept,
would confirm all these results.
We actually already found the solutions when finding the x-intercepts, which was the point
intersects its horizontal asymptote at its x-intercept,
would confirm all these results. Now that we are familiar with the graph of a rational function, we can examine the range of a rational function.
Recall that the range of a function is the set of all values that can be output values from a function.
EXAMPLE
Consider the function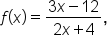 as shown in the graph.
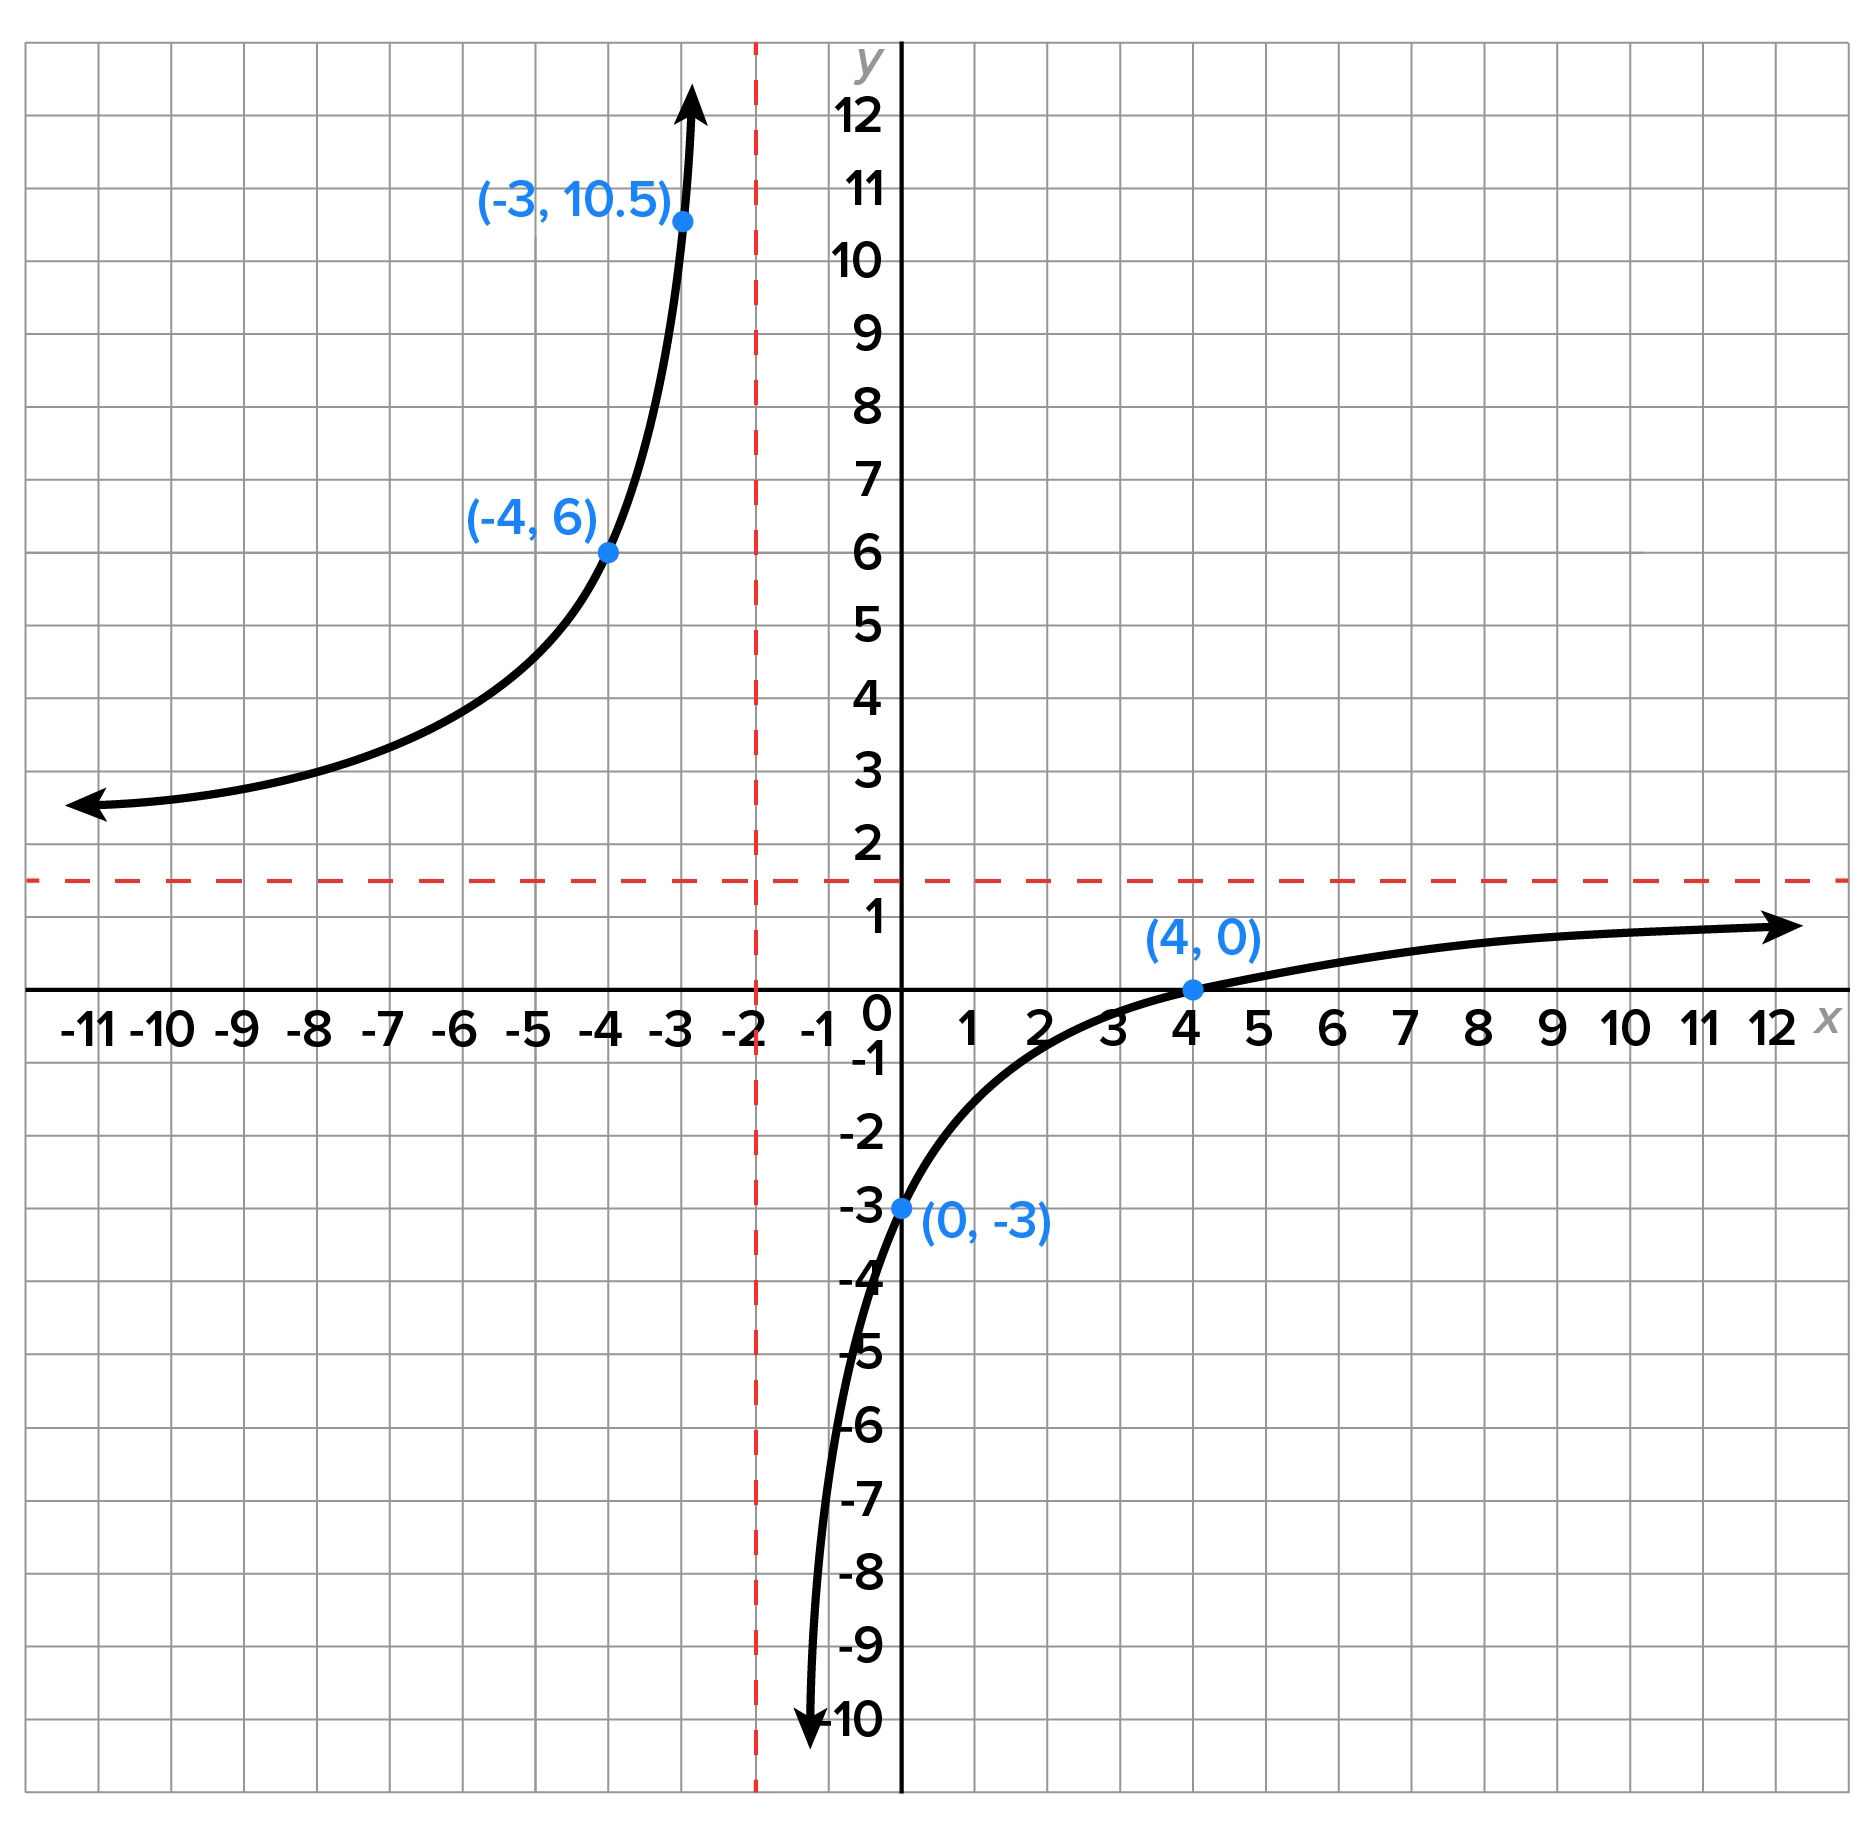
 which is also the horizontal asymptote.

|
Set 
|

|
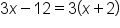
Write denominator in factored form. |
|
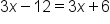
Multiply both sides by 
|
|
Distribute. |

|
Subtract  from both sides. from both sides.
|
 is not in the range of The range of is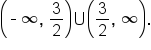
EXAMPLE
Consider the function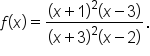
 is
is
 twice.
is all real numbers. In interval notation, this is written
twice.
is all real numbers. In interval notation, this is written 
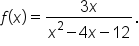 in factored form: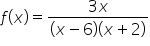
 and This means the domain is all real numbers except and
  or expressed using interval notation,
  which is shown below.
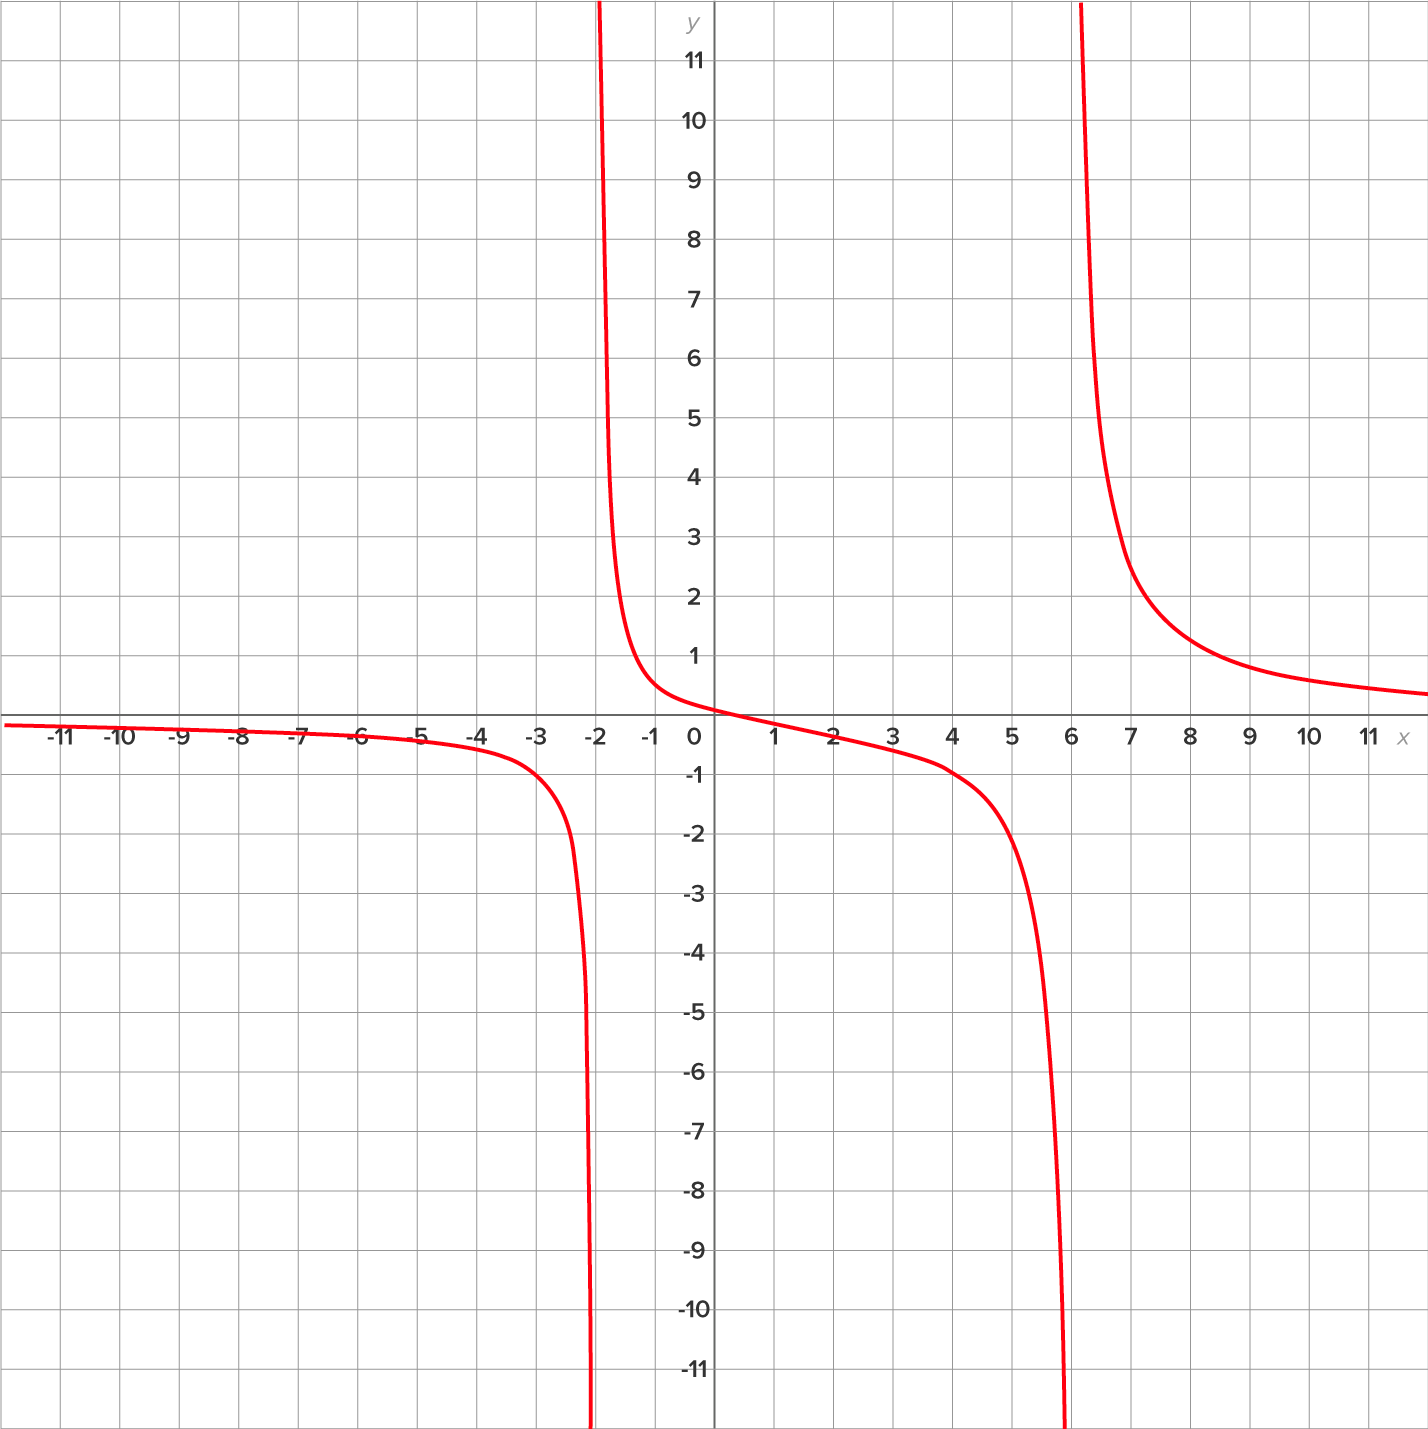 The graph of crosses this at
  All other y-values are in the range of which means the range is the set of all real numbers. Using interval notation, this is written
Sometimes technology is very helpful in determining the range of a function.
EXAMPLE
Consider the function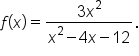 Its graph is shown below.
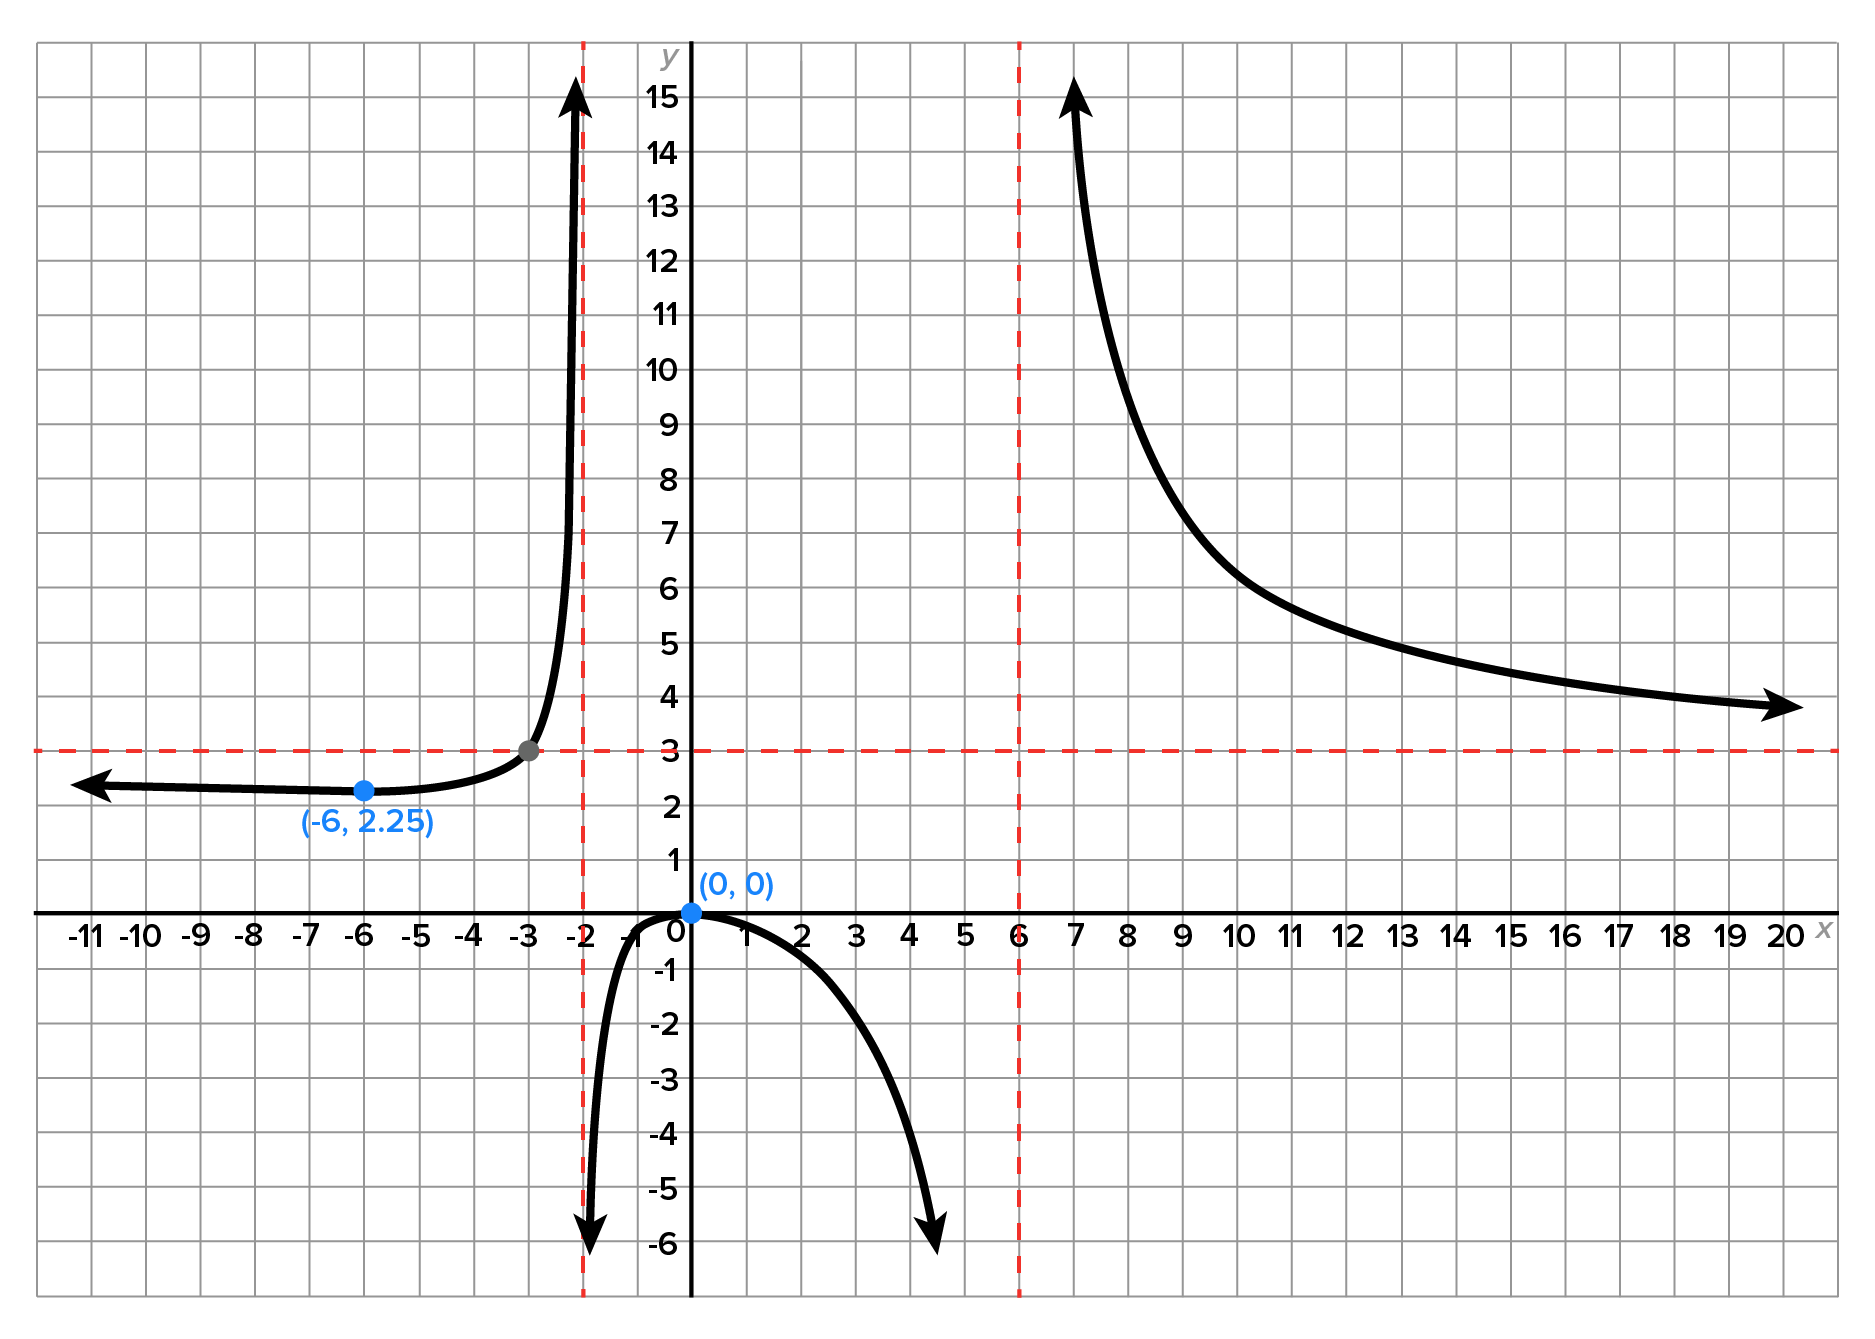
 Note also the local minimum at
  and the local maximum at
 calculus methods are required to locate the local minimum and maximum points.
follows a similar procedure to finding intercepts of other functions, but more care needs to be taken so as not to violate the domain restrictions of Graphing rational functions requires knowledge of asymptotes, holes, and intercepts. Sometimes, however, more points are needed to understand the behavior of the function. Graphs can be used to find the range of a rational function. Graphing with technology can be very helpful when determining characteristics of a rational function but be aware of the shortcomings of technology (e.g., when using technology to graph a rational function that contains a hole, it is not usually visible on the graph). Therefore, it is important to be able to analyze graphs using algebraic techniques.
calculus methods are required to locate the local minimum and maximum points.
follows a similar procedure to finding intercepts of other functions, but more care needs to be taken so as not to violate the domain restrictions of Graphing rational functions requires knowledge of asymptotes, holes, and intercepts. Sometimes, however, more points are needed to understand the behavior of the function. Graphs can be used to find the range of a rational function. Graphing with technology can be very helpful when determining characteristics of a rational function but be aware of the shortcomings of technology (e.g., when using technology to graph a rational function that contains a hole, it is not usually visible on the graph). Therefore, it is important to be able to analyze graphs using algebraic techniques.
Source: THIS TUTORIAL HAS BEEN ADAPTED FROM OPENSTAX "PRECALCULUS". ACCESS FOR FREE AT OPENSTAX.ORG/DETAILS/BOOKS/PRECALCULUS-2E. LICENSE: CREATIVE COMMONS ATTRIBUTION 4.0 INTERNATIONAL. Accessed by June 2022.