
Table of Contents |
Given  let’s look at

|
Original expression |

|
Replace x with 0. |

|
Any nonzero number raised to the 0 power is 1. |

|
Simplify. |
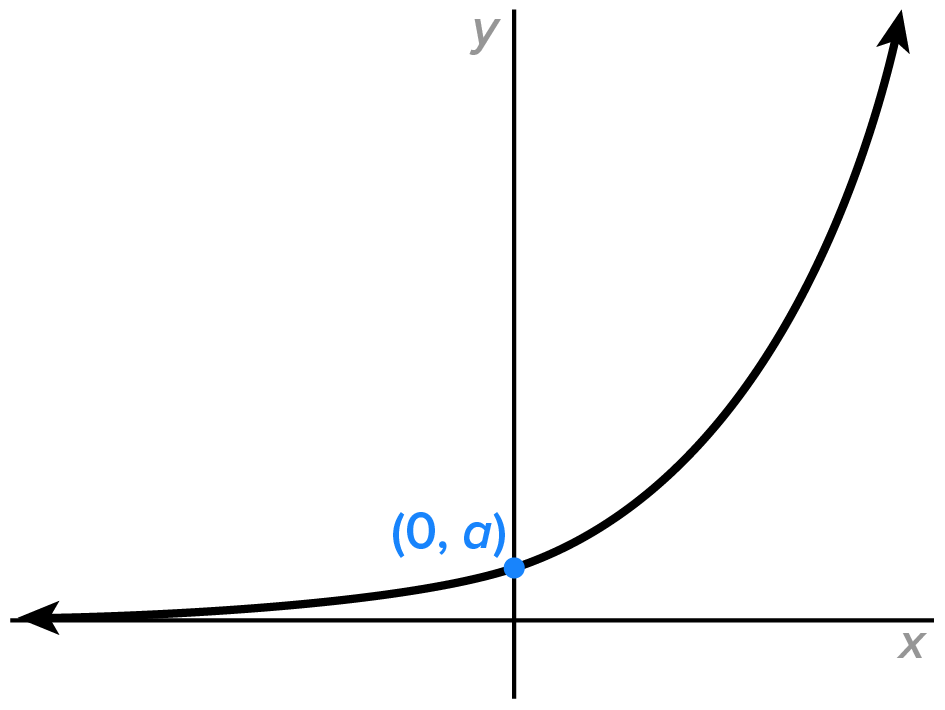
Since  this means that the y-intercept of an exponential function is
  Thus, by looking at the equation, the coefficient of the power term is the y-intercept, or “starting value”.
Consider three exponential functions: 
 and
and 
The tables of values for each function are shown here:

|

|

|

|
|---|---|---|---|
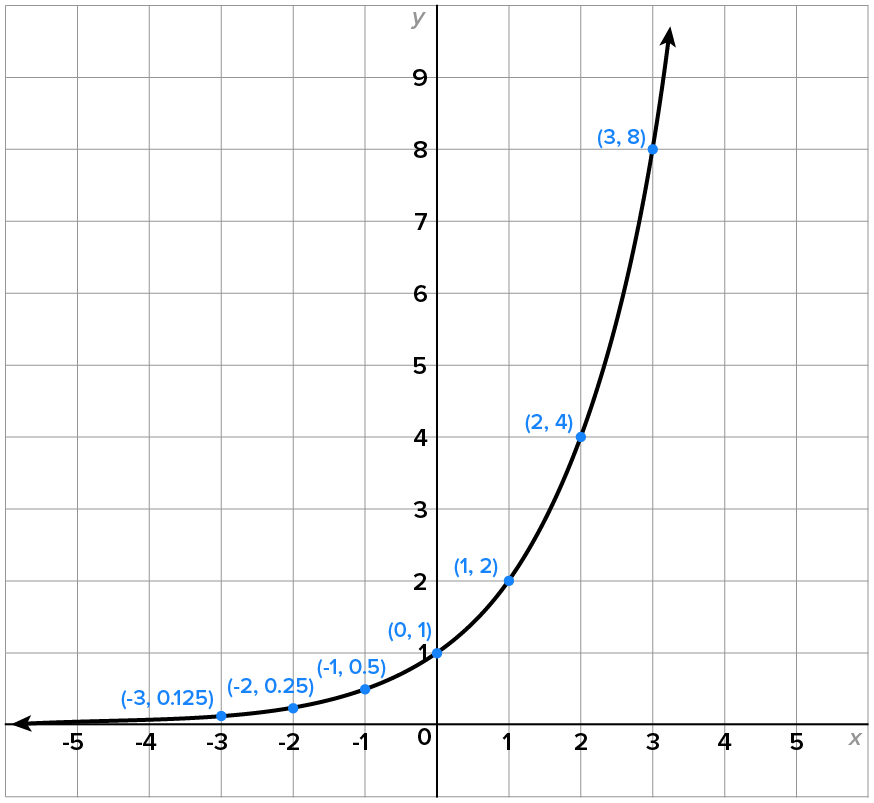
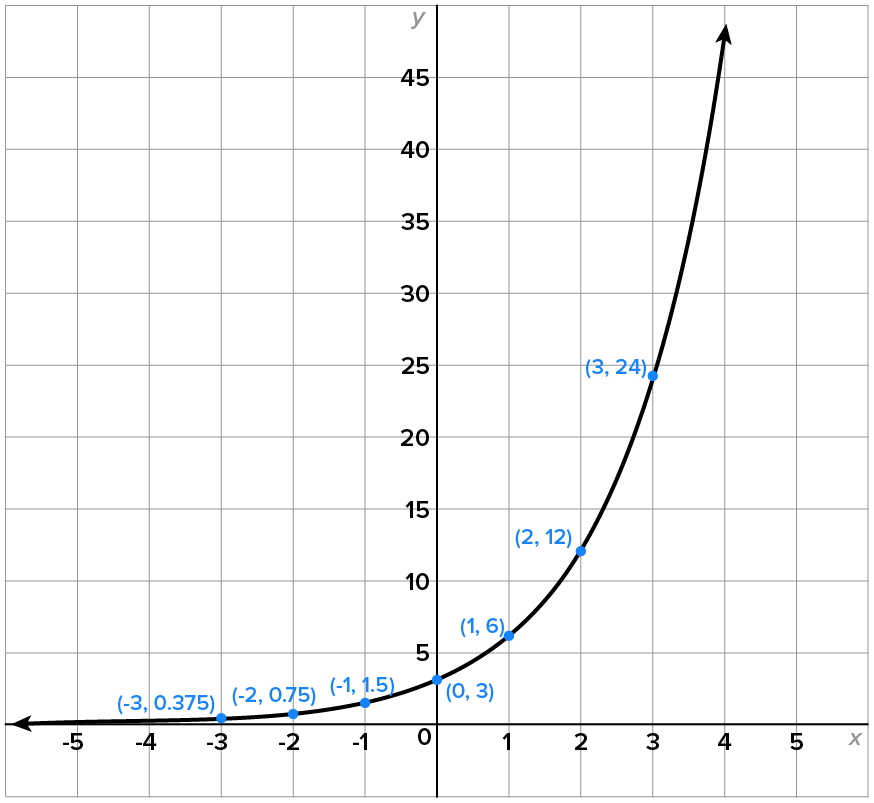
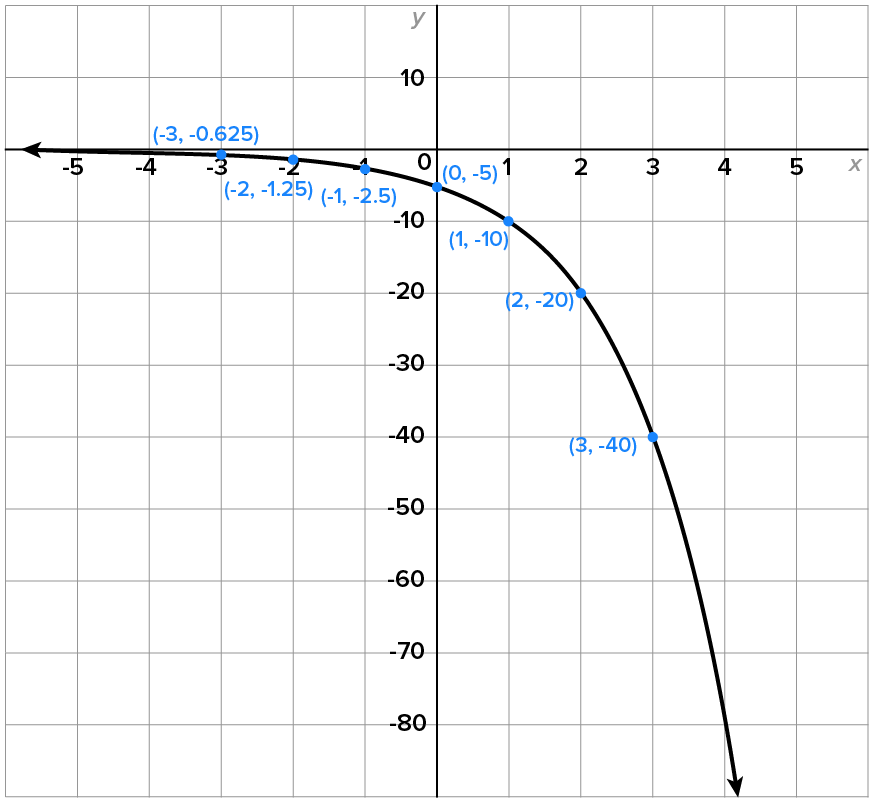
| -3 | 0.125 | 0.375 | -0.625 |
| -2 | 0.25 | 0.75 | -1.25 |
| -1 | 0.5 | 1.5 | -2.5 |
| 0 | 1 | 3 | -5 |
| 1 | 2 | 6 | -10 |
| 2 | 4 | 12 | -20 |
| 3 | 8 | 24 | -40 |
The graphs and descriptions of each function are shown below. Note the vertical scales in each.
|
| |
|---|---|
|
As x decreases indefinitely,  approaches 0 from above and as x increases indefinitely, also increases indefinitely. approaches 0 from above and as x increases indefinitely, also increases indefinitely.
Since   and the y-intercept is and the y-intercept is 
The graph has horizontal asymptote 
The domain of is the set of all real numbers, or using interval notation, 
The range of is the set of all positive numbers, or using interval notation, 
|
|
| |
|
As x decreases indefinitely,  approaches 0 from above and as x increases indefinitely, also increases indefinitely. approaches 0 from above and as x increases indefinitely, also increases indefinitely.
Since   and the y-intercept is and the y-intercept is 
The graph has horizontal asymptote
The domain of is the set of all real numbers, or using interval notation,
The range of is the set of all positive numbers, or using interval notation,
|
|
| |
|
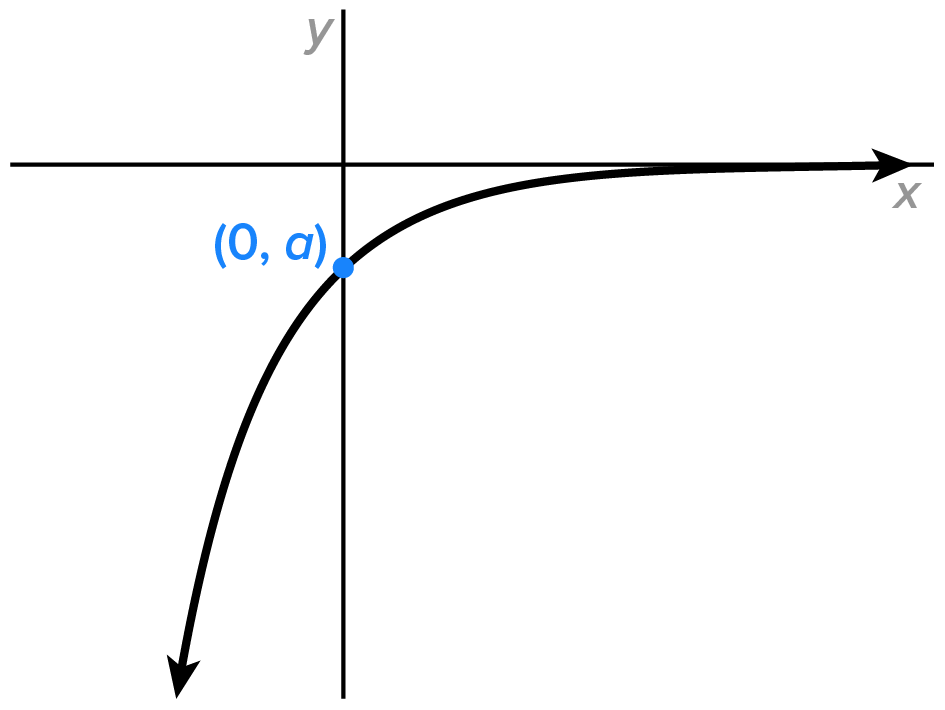
As x decreases indefinitely,  approaches 0 from below and as x increases indefinitely, also decreases indefinitely. approaches 0 from below and as x increases indefinitely, also decreases indefinitely.
Since   and the y-intercept is and the y-intercept is 
The graph has horizontal asymptote
The domain of is the set of all real numbers, or using interval notation,
The range of is the set of all negative numbers, or using interval notation, 
|
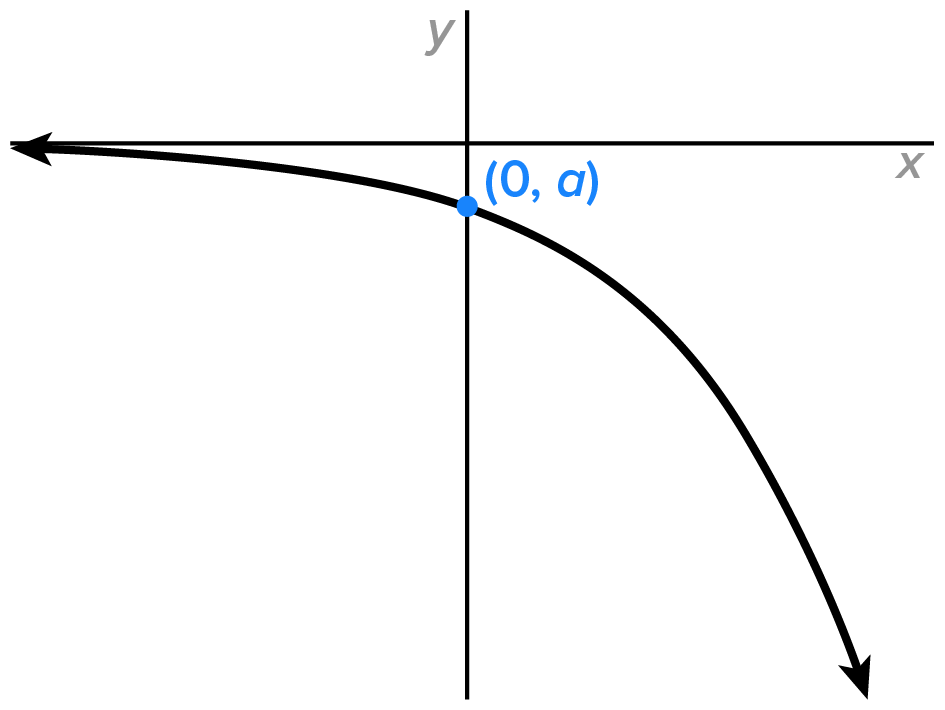
In summary, the graph of can be generalized into two shapes: one where  and one where
General Shape and Behavior When 
|
General Shape and Behavior When 
|
|---|---|
|
|
|
The graph decreases over its entire domain. Domain:  Range:  Horizontal asymptote: 
|
The graph increases over its entire domain. Domain: Range:  Horizontal asymptote:
|
Here is one for you to try:
 and
and  and the range is
Let’s do a similar exploration, but this time when 
Consider three exponential functions: 
 and
and 
The tables of values for each function are shown here:
|
|

|

|
|
|---|---|---|---|
| -3 | 8 | 32 | -24 |
| -2 | 4 | 16 | -12 |
| -1 | 2 | 8 | -6 |
| 0 | 1 | 4 | -3 |
| 1 | 0.5 | 2 | -1.5 |
| 2 | 0.25 | 1 | -0.75 |
| 3 | 0.125 | 0.5 | -0.375 |
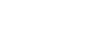
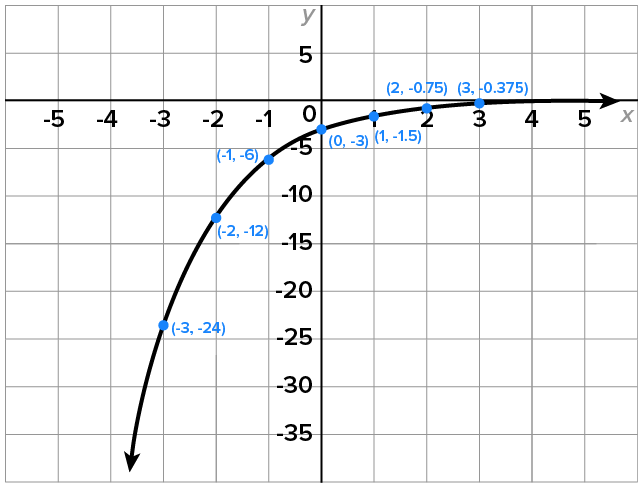
The graphs and descriptions of each function are shown below. Note the vertical scales in each.
|
| |
|---|---|
|
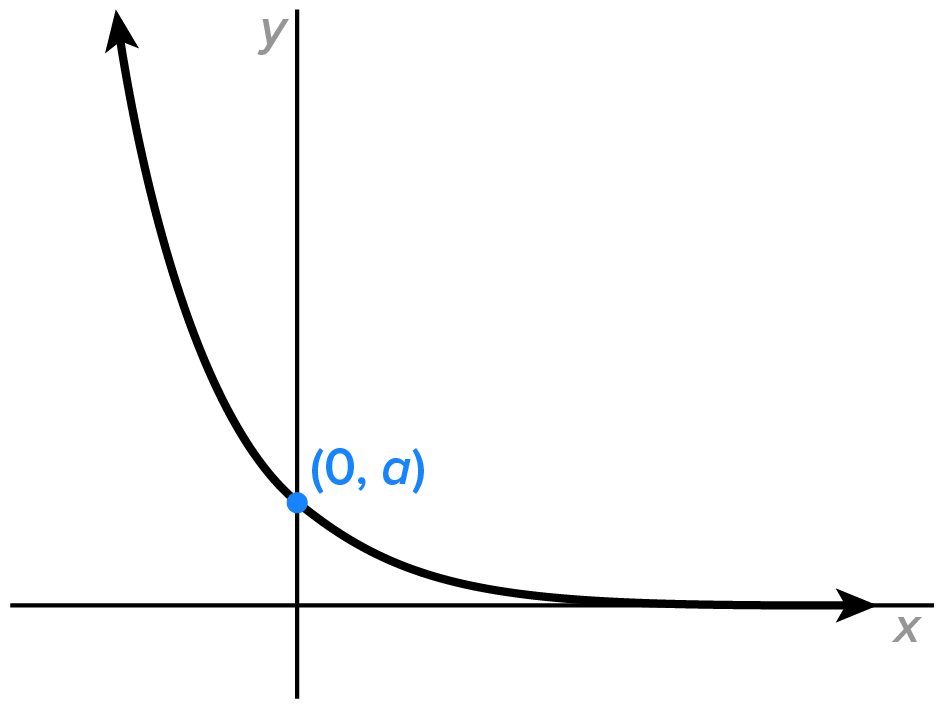
As x decreases indefinitely, increases indefinitely; and x increases indefinitely, approaches 0 from above.
Since  and the y-intercept is and the y-intercept is
The graph has horizontal asymptote
The domain of is the set of all real numbers, or using interval notation,
The range of is the set of all positive numbers, or using interval notation,
|
|
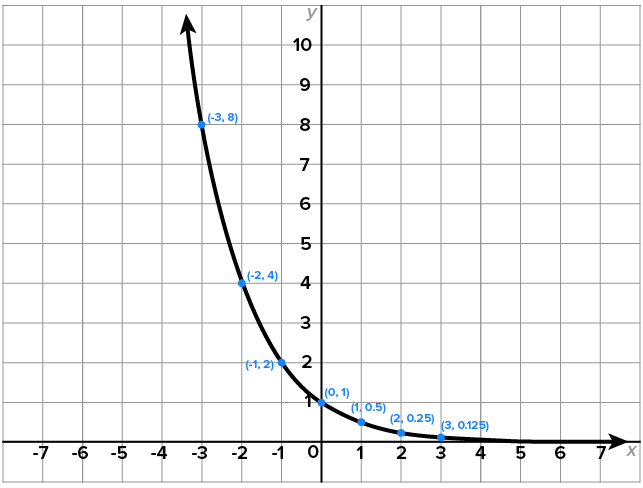
| |
|
As x decreases indefinitely, increases indefinitely; and x increases indefinitely, approaches 0 from above.
Since   and the y-intercept is and the y-intercept is 
The graph has horizontal asymptote
The domain of is the set of all real numbers, or using interval notation,
The range of is the set of all positive numbers, or using interval notation,
|
|
| |
|
As x decreases indefinitely, decreases indefinitely; and x increases indefinitely, approaches 0 from below.
Since   and the y-intercept is and the y-intercept is 
The graph has horizontal asymptote
The domain of is the set of all real numbers, or using interval notation,
The range of is the set of all negative numbers, or using interval notation,
|
In summary, the graph of when  can be generalized into two shapes: one where and one where
|
General Shape and Behavior When
|
General Shape and Behavior When
|
|---|---|
|
|
|
The graph increases over its entire domain. Domain: Range: Horizontal asymptote:
|
The graph decreases over its entire domain. Domain: Range: Horizontal asymptote:
|
 and describing the graph’s characteristics.
Here is one for you to try:

 which is negative, and
  and the range is
The shape of the graph of an exponential function is affected by the sign of  and the value of b. There are four possible general shapes of the graph of an exponential function.
is affected by the sign of and the value of b. The graph of an exponential function when b > 1 and the graph of an exponential function when 0 < b < 1 can each be generalized into two shapes: one where and one where  (a total of four possible general shapes).
Source: THIS TUTORIAL HAS BEEN ADAPTED FROM "BEGINNING AND INTERMEDIATE ALGEBRA" BY TYLER WALLACE. ACCESS FOR FREE AT www.wallace.ccfaculty.org/book/book.html. License: Creative Commons Attribution 3.0 Unported License