Table of Contents |
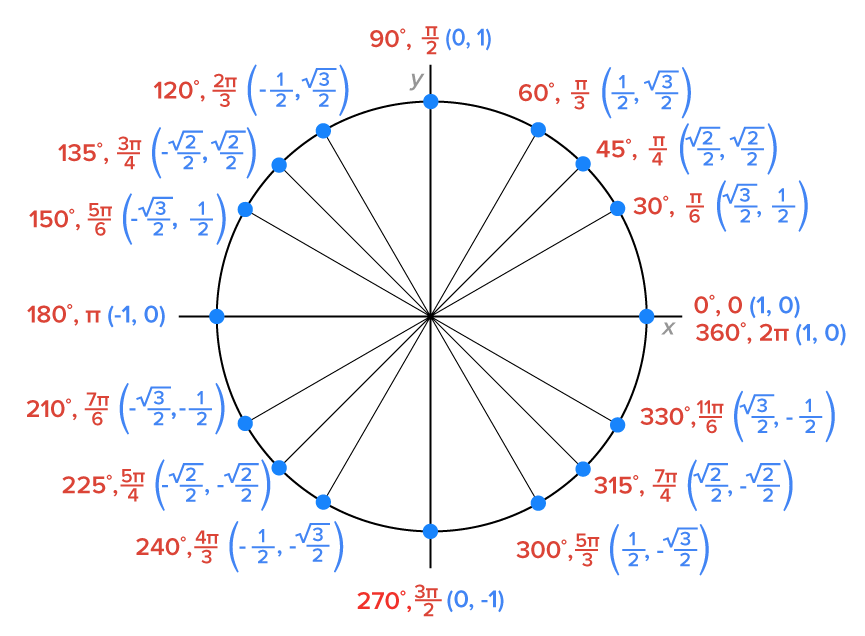
Consider the unit circle shown below, with all points corresponding to special angles and multiples of special angles labeled.
As  increases from one quadrantal angle to the next, the behavior of
  is shown in the table.
As  Increases From: Increases From:
|
 (y-coordinate): (y-coordinate):
|
|---|---|
0 to 
|
increases from 0 to 1 |
to 
|
decreases from 1 to 0 |
to 
|
decreases from 0 to -1 |
to 
|
increases from -1 to 0 |
We’re going to use this information to sketch the graph of the sine function in the xy-coordinate system.
Let  The table above means that the graph of
  has the following key points:


|
0 |

|

|

|
|
|
|
|
|---|---|---|---|---|---|---|---|---|

|
0 |

|

|

|
1 | 0 | -1 | 0 |
Using these points, the graph of on the interval  is shown below.
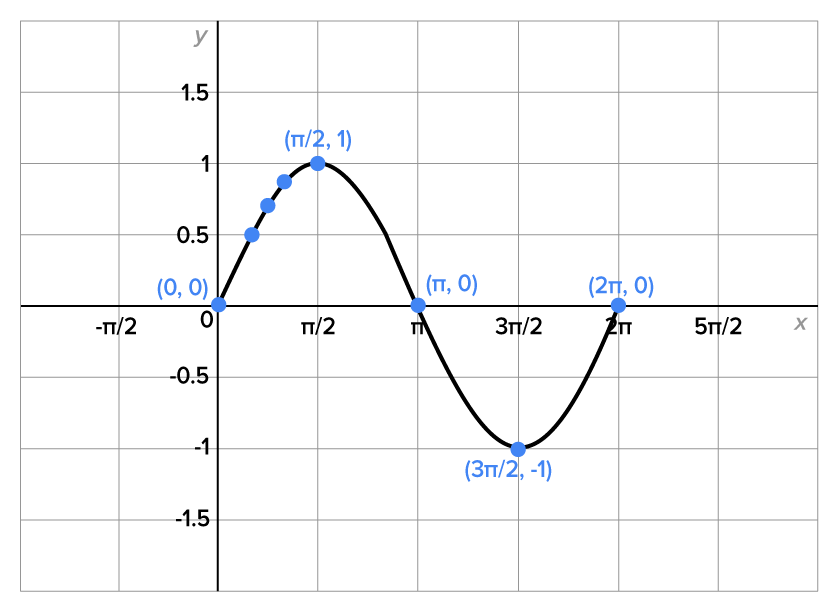
This is the most important period of the sine graph, since all other periods repeat this one. Note again the key points on the graph:
| Key Point |
|
|
|
|
|
|---|---|---|---|---|---|
| Description | Starting point, x-intercept | Maximum | x-intercept | Minimum point | x-intercept |
The following are properties of one period of the basic sine graph:
 Because of this relationship, we say that the sine function has a period of
  meaning that the values of
  are equal when x is increased or decreased by a multiple of
  As a result, the complete graph of
  is shown below.
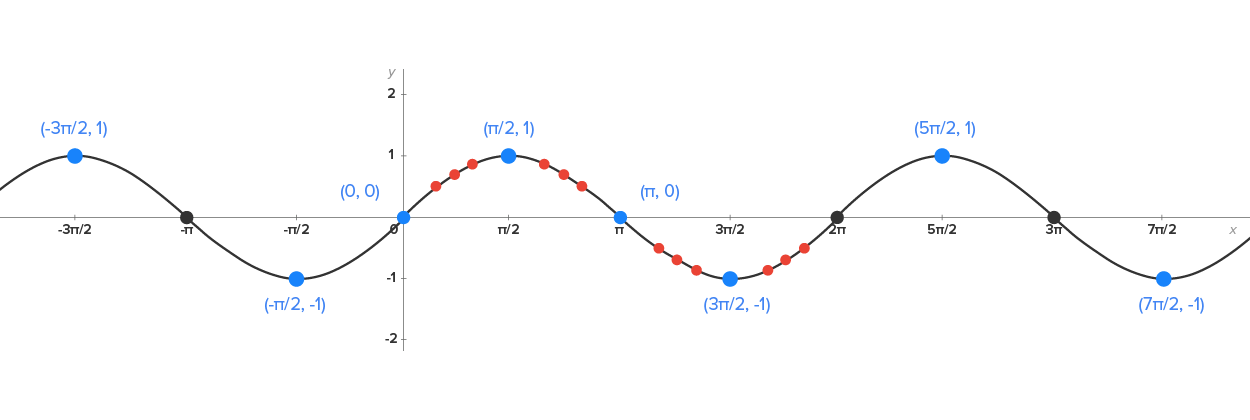
The graph continues in this pattern indefinitely. Since there are no breaks or holes in the graph, the domain of is the set of all real numbers, also written in interval notation as  The range of this function is
  since the smallest output value is -1 and the largest output value is 1.
Recall from an earlier lesson that the sine function is odd, meaning that  In the xy-coordinate system, this means that the graph is symmetric with respect to the origin.
Since  is the “middle value,” we call the line the horizontal midline, which is the line that represents the average of the maximum and minimum values of the function.
Now, let’s examine the cosine function.
As increases from one quadrantal angle to the next, the behavior of  is shown in the table.
|
As Increases From:
|
 (x-coordinate): (x-coordinate):
|
|---|---|
|
0 to
|
decreases from 1 to 0 |
|
to
|
decreases from 0 to -1 |
|
to
|
increases from -1 to 0 |
|
to
|
increases from 0 to 1 |
We’re going to use this information to sketch the graph of the cosine function in the xy-coordinate system.
Let  The table above means that the graph of
  has the following key points:


|
|
0 |
|
|
|
|
|
|
|
|---|---|---|---|---|---|---|---|---|

|
1 |
|
|
|
0 | -1 | 0 | 1 |
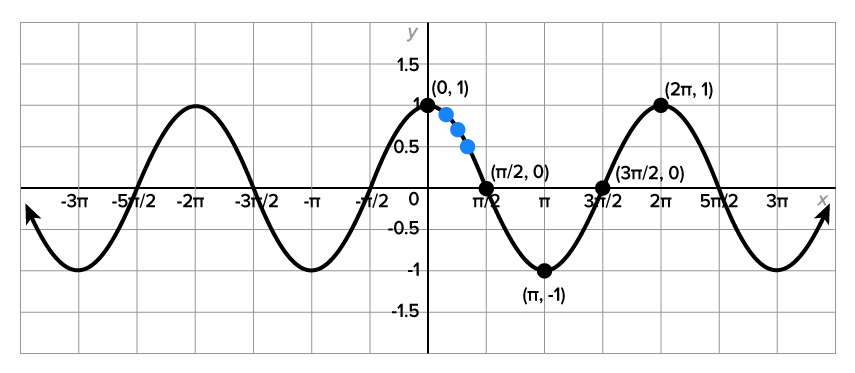
Recall that  Because of this relationship, we say that the cosine function has a period of meaning that the values of
  are equal when x is increased or decreased by a multiple of As a result, the complete graph of is shown below.
Recall from an earlier lesson that the cosine function is even, meaning that  In the xy-coordinate system, this means that the graph is symmetric with respect to the y-axis.
The most important period of the cosine graph is the one that starts at  and ends at
  since all other periods repeat this one. Note again the key points on the graph:
| Key Point |
|
|
|
|
|
|---|---|---|---|---|---|
| Description | Starting point, maximum value | x-intercept | Minimum point | Ending point, x-intercept | Maximum value |
The following are properties of one period of the basic cosine graph:
is the set of all real numbers, also written in interval notation as The range of this function is since the smallest output value is -1 and the largest output value is 1.
The graphs of sine and cosine functions are used to model several real-life situations, such as heights of ocean waves and seasonal temperatures. Graphs that resemble sine and cosine graphs are called sinusoidal graphs, or sinusoids.
 and range
  Both functions have a period equal to The horizontal midline of each graph is
 In other words, if the graph of
  is shifted horizontally by p units to the left or to the right, the result is the original graph.
 A sinusoidal function has equation  or
or  where
where  b, c, and d are real numbers with
  and
and 
In the next two parts, we’ll see what the roles of b, c, and d have in shaping the graphs of or as compared to and , respectively.
Recall that for some nonzero constant the graph of  is a vertical stretch of the graph of
  if
if  and a vertical compression if
  If
If  then the graph is also reflected over the x-axis.
Consider the graph of  Its graph, along with the graph of
  is shown below.
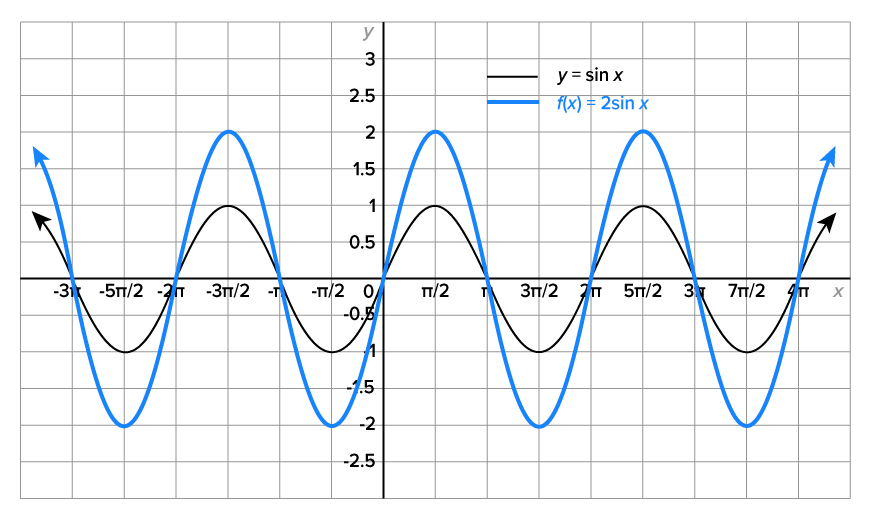
The graph of  is a vertical stretch of the graph of by a factor of 2. Note that the domain is
  the range is
  and the period is
Now consider the graph of  Its graph, along with the graph of is shown below.
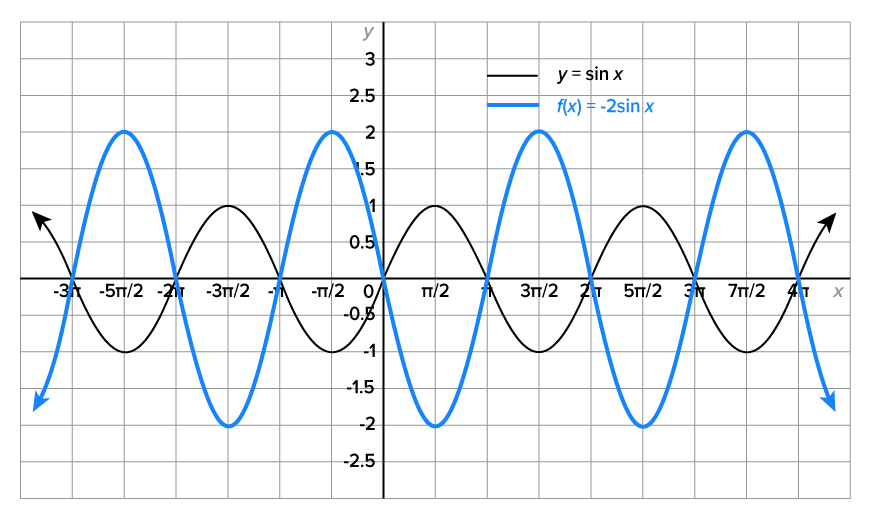
The graph of  is a vertical stretch of the graph of by a factor of 2 and is also reflected over the x-axis. Note that the domain is the range is and the period is
Lastly, consider the graph of  Its graph, along with the graph of
  is shown below.
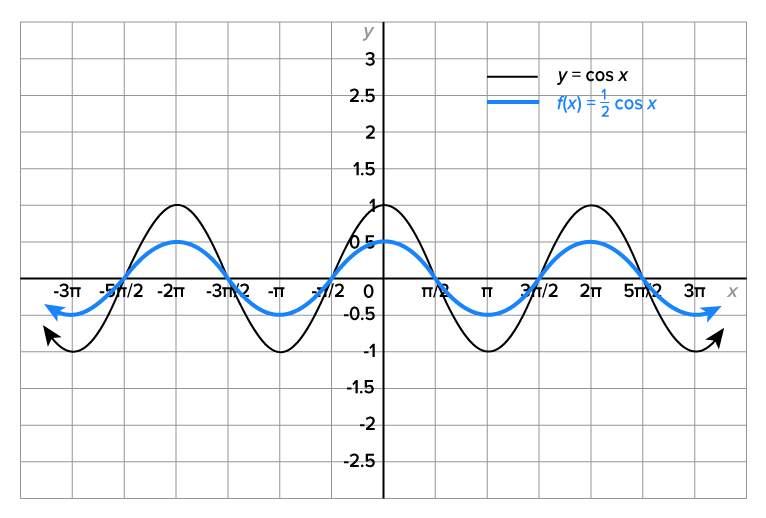
The graph of  is a vertical compression of the graph of by a factor of
  Note that the domain is the range is
  and the period is
To better describe the vertical stretch factor, we define the amplitude of a sinusoidal graph.
Then, the graphs of and have amplitude 1.
Now consider the graphs of  and
and  From the examples above, when
  or
or  the amplitude is 2. When
  the amplitude is
and  have amplitude
We’ll now investigate sinusoidal graphs in the form  and
and  where
where 
Consider the function 
The graphs of and  on the interval are shown below.
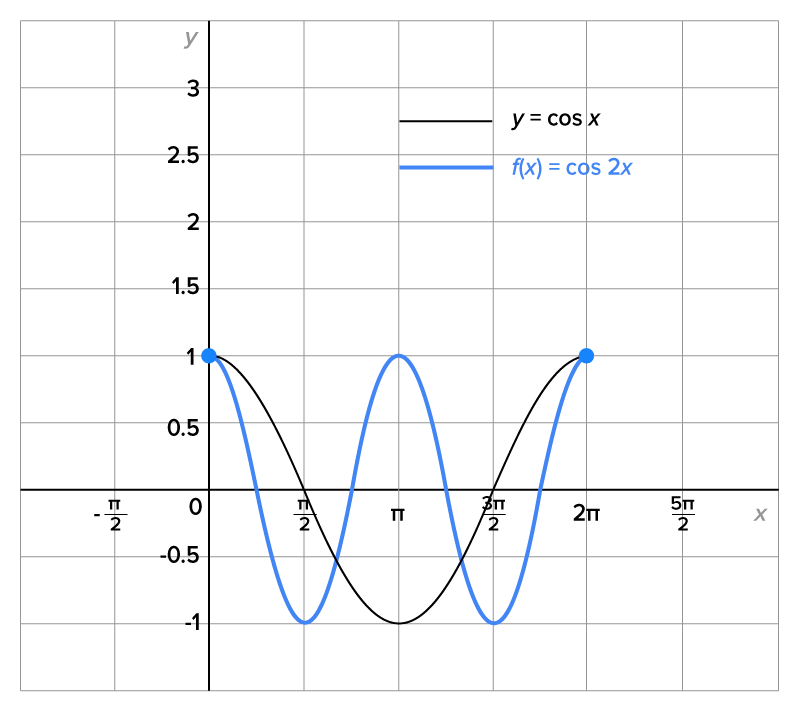
The graph of undergoes two complete cycles between and  and its first complete cycle between and
This means that the period of is 
In general, suppose 

 divide all three parts by b, which gives
  the graph of either
  or
or  has period
 then the even/odd identities can be used to rewrite the trigonometric function so that the angle contains a positive coefficient of the variable.
EXAMPLE
Consider the equation
 the period of the function is
 to
to 
 and
and  and
and  which is at
  and
and 

 which is positive. This means the amplitude is also
 where b is the coefficient of x. Thus, the period of this function is
 we know that the end of its period is at the point
  We also know that there is another x-intercept halfway between the endpoints, which is located at
 and
and or at
and
and or at  This results in a value of
  The maximum will occur at
 and
and  or at
or at  This results in a value of
  The minimum will occur at
Recall that the graph of  is a vertical shift of d units above the graph of if
  and d units below the graph of if
 relates to the graph of
and
relates to the graph of
and  have midline When the graph shifts vertically by d units, the midline shifts along with it, and becomes
 where b is the coefficient of x. With
  the period is
 the graph has its y-intercept at
  With a period of 6, another point on the midline is
  Then, the point halfway between the endpoints is

 and
and
 which is the position of the midline minus the amplitude.
 which is the position of the midline added to the amplitude.
Given the graph of and a positive constant k:
 shifts the graph to the left k units.
  shifts the graph to the right k units.
For example, consider the equations  and
and 
The graph of  is a horizontal translation to the right units from the graph of
Note: the function could also be written  When there is a coefficient of x in the expression for the angle, it may need to be factored out in order to find the phase shift.
EXAMPLE
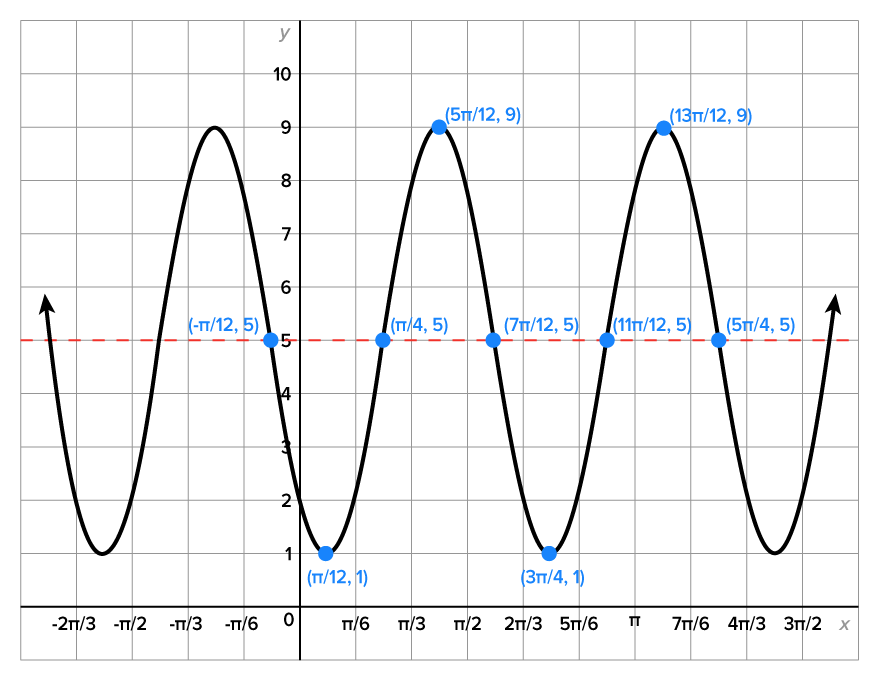
Consider the equation
 This also means that the minimum and maximum values shift upward 5 units to 1 and 9, respectively.


 units to the right.
  , along with the midline,
  are shown below.
 which gives
  This result tells you that the point with x-coordinate
  is the new “start” of the curve, which indicates a phase shift of units to the right since the original starting place was
In general, given the graph of or consider the angle  Factoring out b, we obtain
  which indicates a phase shift of
  units.
or the phase shift is units. A negative value indicates a shift to the left, while a positive value indicates a shift to the right.

 which means the period is
 Solving for x gives
  which means the graph is shifted
  units to the right of the basic cosine graph.

 and the amplitude is 1. This means that the minimum value is
  and the maximum value is
Using the aspects of a sinusoidal graph that we discussed earlier, we can write the equation of a sinusoidal function given its graph.
The goal is to write a function in the form or  The goal is to use the most convenient curve, which means avoiding a phase shift, if possible.
 then use a cosine function. then use a sine function.
 EXAMPLE
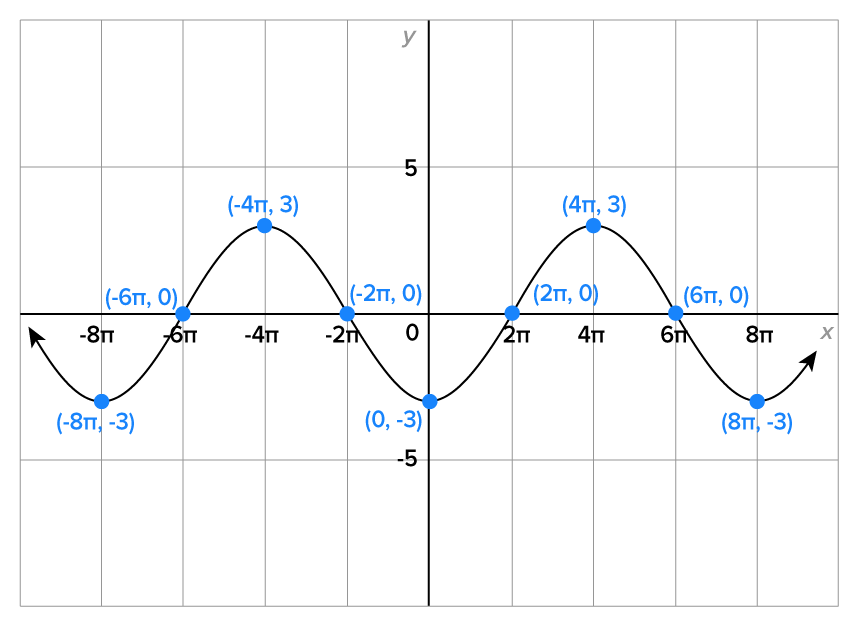
Write the equation of the function whose graph is shown in the figure below.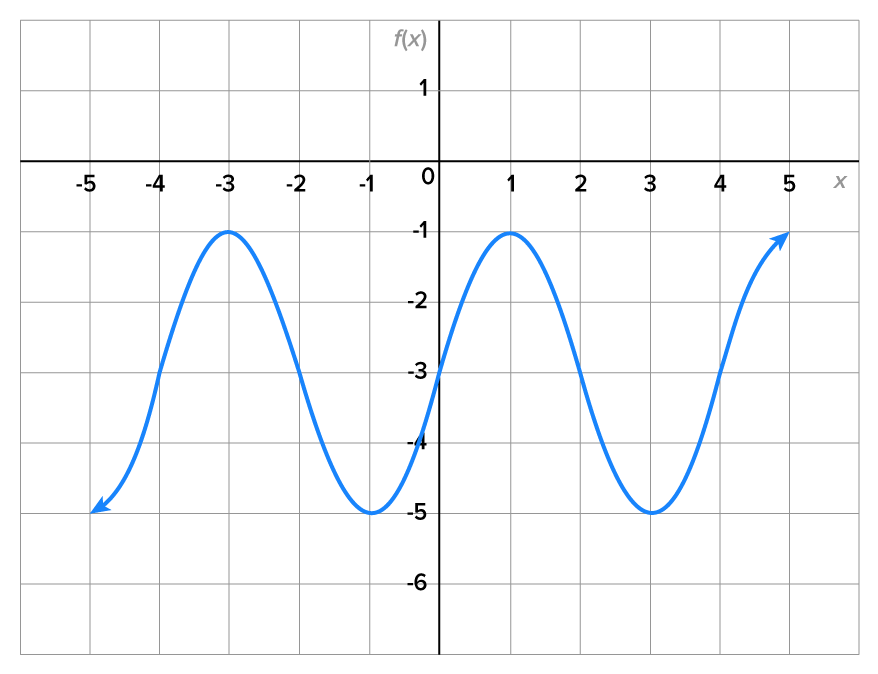
| Property of Graph | Information About Function |
|---|---|
The midline of this graph is 
|

|
The graph passes through the midline at 
|
The model has the form  Since the graph passes through its midline at Since the graph passes through its midline at 
|
| The function has a maximum value of -1 and a minimum value of -5. |
Since the points where the maximum and minimum values occur are two units above and below the midline, the amplitude is 2. Since the graph resembles a non-reflected sine curve, 
|
| The period of this function is 4. |
 which means which means 
|
b, c, and d, the equation for the graph is 
EXAMPLE
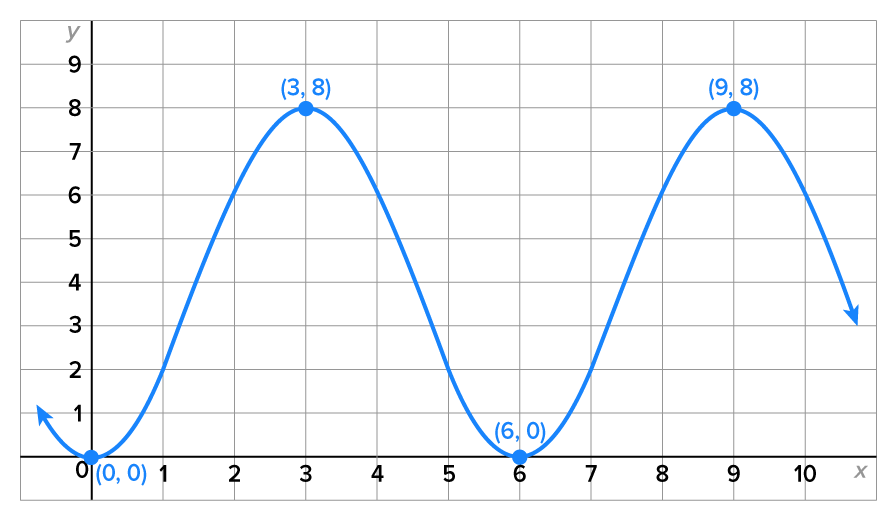
Write the equation of the function whose graph is shown in the figure below.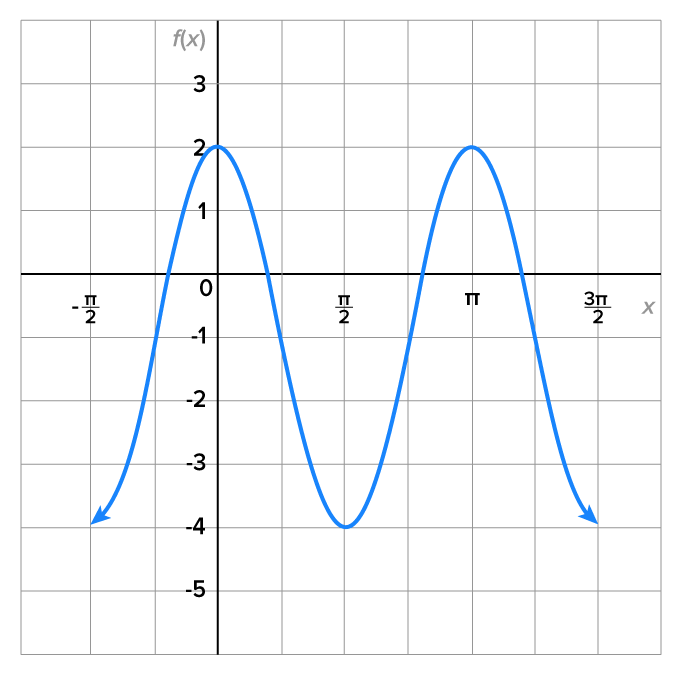
| Property of Graph | Information About Function |
|---|---|
The midline of this graph is 
|

|
|
The graph attains its maximum value when
|
This is a non-reflected cosine graph with no phase shift; therefore,  and and The model has the form
|
| The function has a maximum value of 2 and a minimum value of -4. |
Since these are three units from the midline, the amplitude is 3. Since the graph resembles a non-reflected cosine curve, 
|
|
The period of this function is
|
 which means which means 
|
b, c, and d, the equation for the graph is 
 b, c, and d that are used in the equation.
| Property of Graph | Information About Function |
|---|---|
The midline of this graph is 
|

|
|
The graph attains its minimum value when
|
This is a reflected cosine graph with no phase shift, which means  and and  We seek an equation of the form
|
| The function has a minimum value of 0 and a maximum value of 8. |
Each of these values is 4 units from the midline, which means the amplitude is 4. Since we already concluded that  is negative, is negative, 
|
| The period of this function is 6 units. |
The period is To find b, set  Solving, Solving, 
|


 and into the equation the equation of the given graph is
SOURCE: THIS TUTORIAL HAS BEEN ADAPTED FROM OPENSTAX "PRECALCULUS” BY JAY ABRAMSON. ACCESS FOR FREE AT OPENSTAX.ORG/DETAILS/BOOKS/PRECALCULUS-2E. LICENSE: CREATIVE COMMONS ATTRIBUTION 4.0 INTERNATIONAL.
The maximum vertical distance that the graph is away from its horizontal midline.
A horizontal line that represents the value that is the average between the maximum value and the minimum value.
The smallest value of p for which  In other words, if the graph of
  is shifted horizontally by p units to the left or to the right, the result is the original graph.
The horizontal shift with respect to a sinusoid whose y-intercept is the minimum value, midline value, or maximum value.
Any graph that resembles the graph of a sine or cosine function.
Assuming  the graphs of either
  or
or  has period
Given  or
or  the phase shift is
  units. A negative value indicates a shift to the left, while a positive value indicates a shift to the right.
