Table of Contents |
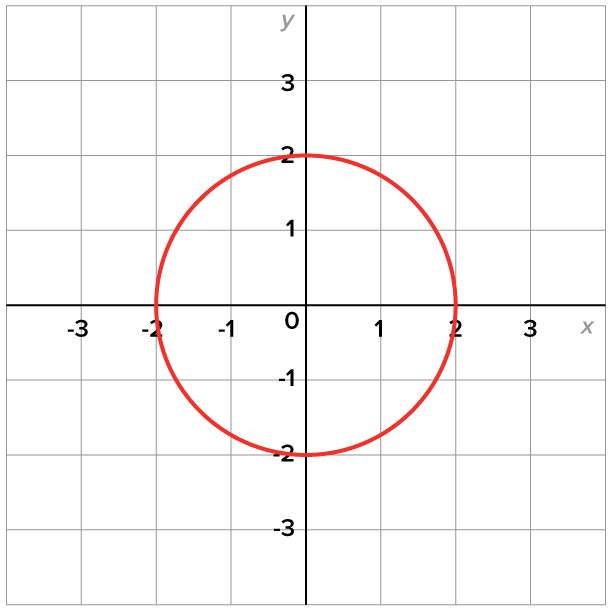
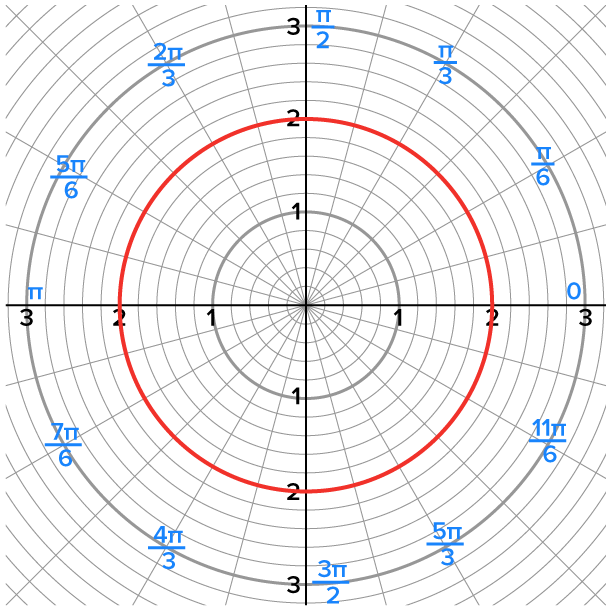
Consider the graphs of  in rectangular coordinates and
  in polar coordinates.
Their graphs on their respective coordinate systems are shown below.

|

|
|---|---|
|
|
The graphs are identical; they are just plotted in two different coordinate systems.
One way to graph polar equations is to transform the polar equation into a rectangular equation, then graph the rectangular equation. This is useful since we are more familiar with rectangular equations and their graphs.
EXAMPLE
Consider the polar equation

|
This is the original equation. |

|
Multiply both sides of the equation by r. |

|
Replace  with with  and and  with x. with x.
|

|
Subtract  from both sides and place it after the from both sides and place it after the  term. term.
|


|
The original equation. |

|
Multiply both sides by the denominator. |

|
Distribute r. |

|
Replace with x and  with y. This equation is now written in rectangular form. with y. This equation is now written in rectangular form.
|
 and y-intercept
It is not always convenient to find the corresponding rectangular equation given a polar equation; therefore, other properties of graphs are needed. One of them is symmetry. If a graph has a specific type of symmetry, then we are able to obtain the entire graph by sketching half of it.
Consider the following figure, which shows four key points on a circle that is centered at the origin, the polar axis, and the line 
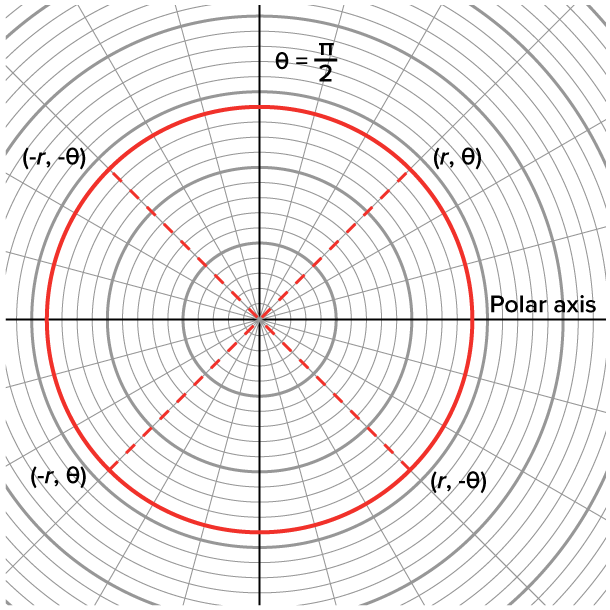
This graph exhibits three types of symmetry:
| Type of Symmetry | Condition for Symmetry |
|---|---|
| Symmetry about the polar axis (the x-axis) |
Given  is a point on the curve, then is a point on the curve, then  is also a point on the curve. is also a point on the curve.
|
Symmetry about the line  (the y-axis) (the y-axis)
|
Given is a point on the curve, then  is also a point on the curve. is also a point on the curve.
|
| Symmetry about the pole (origin) |
Given is a point on the curve, then  is also a point on the curve. is also a point on the curve.
|
The most efficient way to test for symmetry is to replace with for polar axis symmetry, for symmetry about the line  and for symmetry about the pole.
Note that these tests guarantee symmetry. If a symmetry test fails, then the corresponding graph could still have that type of symmetry. This happens because there are several ways to express the same point using polar coordinates, and checking all possible substitutions would be time consuming. Some types of symmetry can still be identified by plotting points that reflect around the axes or the pole, as we will see later.
EXAMPLE
Test the equation for symmetry.

|
Replace  with with  and keep r the same. and keep r the same.
|
|
|
Use an even/odd identity. |
has symmetry about the polar axis.


|
Replace r with -r and with 
|

|
Use an even/odd identity on the right side. |

|
Solve the equation for r. |
fails the test for symmetry about the line
|
|
Replace r with -r and keep the same.
|
fails the test for symmetry about the pole.
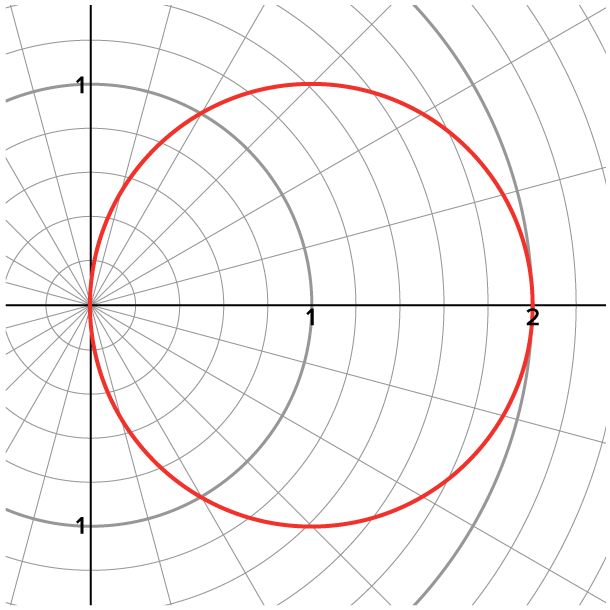
is  which is a circle with center
  and radius 1. The graph of the polar equation is shown below, which confirms symmetry about the polar axis and shows that it does not have the other types of symmetry.
 In this exercise, you will will test the equation for symmetry about the polar axis, the line and the pole.
 which is an even/odd identity.
with
which is an even/odd identity.
with  then determine if the equation is equivalent.
 This equation is not identical, so the test fails for polar axis symmetry.
replace with
This equation is not identical, so the test fails for polar axis symmetry.
replace with  then determine if the equation is equivalent.
 with
with  then determine if the equation is equivalent.

 is guaranteed.
Recall that  represents a single point, the pole (origin).
Given a polar equation  the solutions of the equation
  represent points on the graph that pass through the origin.
EXAMPLE
Consider the equation Find all zeros on the interval

|
This is the original equation. |

|
The zeros occur when 
|

|
Isolate  on one side. on one side.
|

|
Find all values of on the interval  such that the y-coordinate of the point is such that the y-coordinate of the point is 
|

 and solve:

|
Replace r with 0. |

|
Subtract 2 from both sides. |

|
Divide both sides by 2. |

|
According to the unit circle, the only solution is 
|
is the only zero on the interval
Recall that sine and cosine functions have minimum and maximum values. Therefore, the points where the largest and smallest values of  occur can be found by analyzing the expression.
EXAMPLE
Consider the equation Find all points where the maximum value of occurs.
 has a maximum value of 2, which means
  has a maximum value of 4. Thus, the maximum value of is 4.
 which is
|
|
This is the original equation. |

|
Replace r by its maximum value. |

|
Isolate to one side.
|
|
|
Solve for 
|
 is the location of the point with the maximum value of r.

 has maximum value 3, which means that
  has maximum value
 and solve.

|
Set 
|

|
Subtract 5 from both sides. |

|
Divide both sides by -3. |
|
|
From the unit circle,
|
is 
Taking the information we found so far, and adding some other solution points to a polar curve, we can graph the polar curve.
EXAMPLE
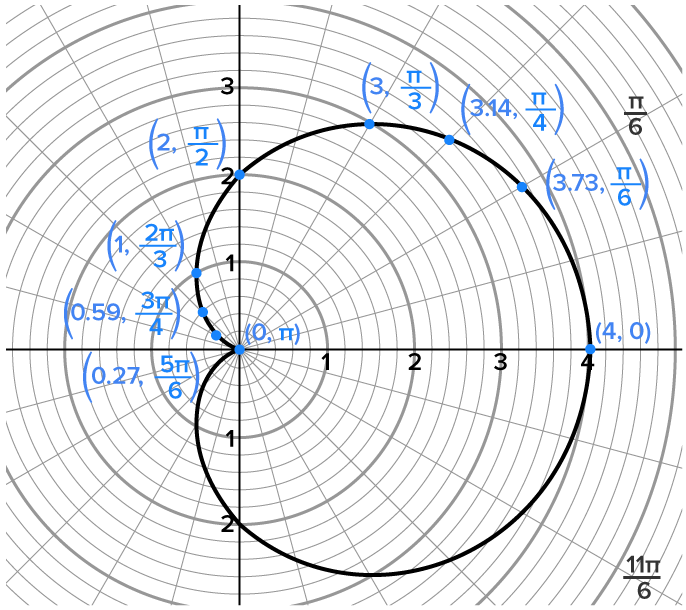
Sketch the graph of
 and the maximum value of is attained at the point
 and
and Note that non-exact values are rounded to two decimal places.
and
and Note that non-exact values are rounded to two decimal places.

|
0 |

|

|

|

|

|

|

|

|
|---|---|---|---|---|---|---|---|---|---|

|
4 | 3.73 | 3.14 | 3 | 2 | 1 | 0.59 | 0.27 | 0 |
EXAMPLE
Consider the equation
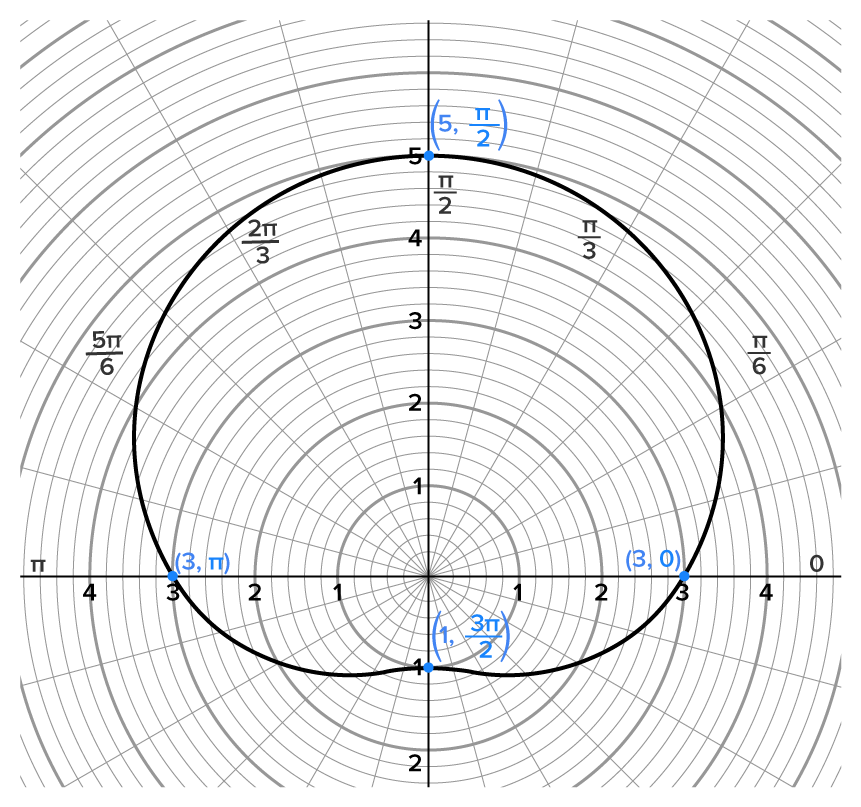 , this graph is symmetric about the line
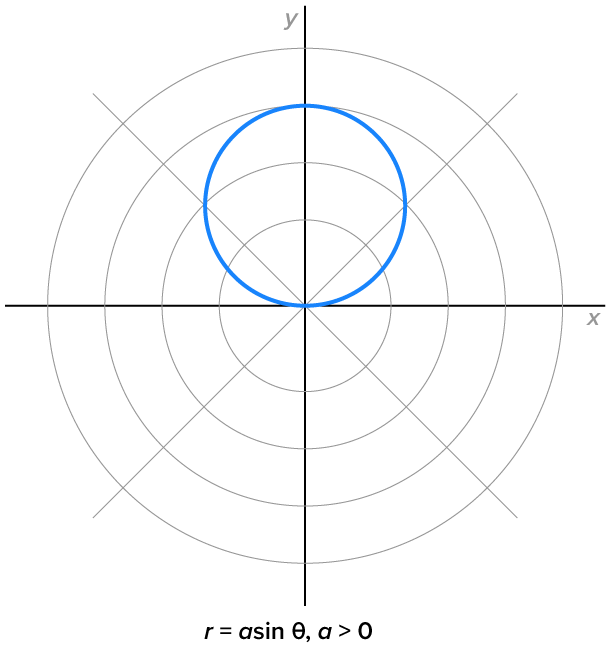
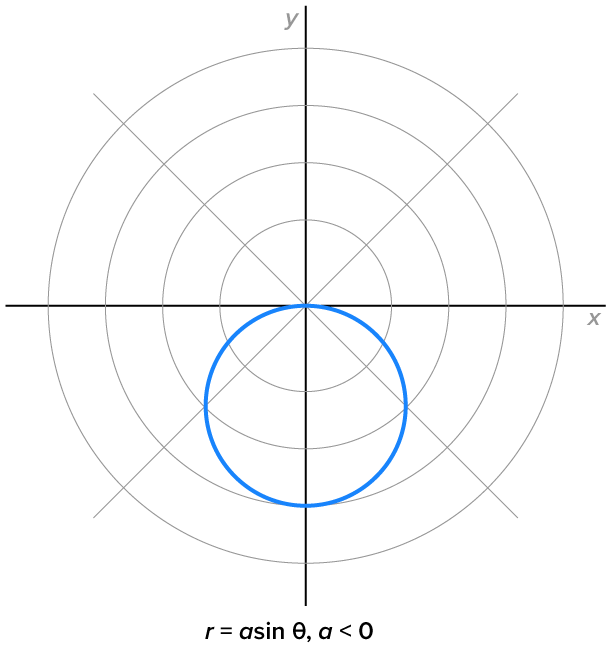
By applying the techniques we have learned so far, we could graph many different types of polar equations. The graphs shown below represent the equations that are easier to graph using polar coordinates than their rectangular counterparts.
Even though these could be transformed to rectangular coordinates quite easily, the polar equations of circles centered on an axis are more convenient.
Their graphs are shown below.
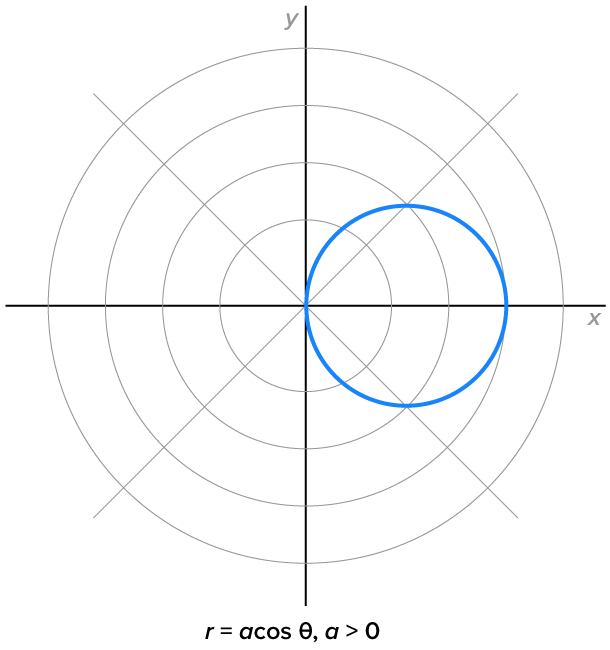
|
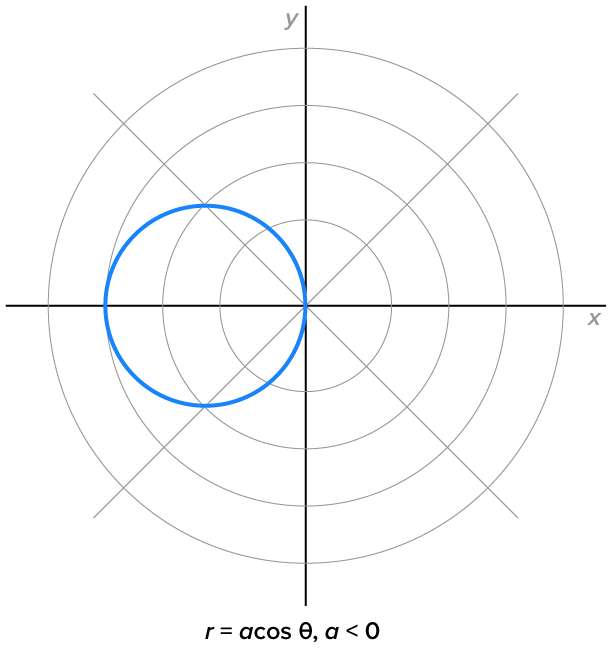
|
|
|
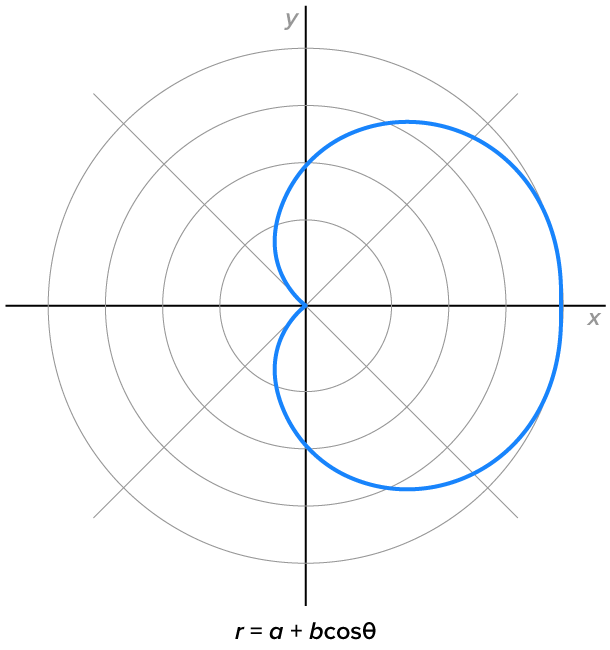
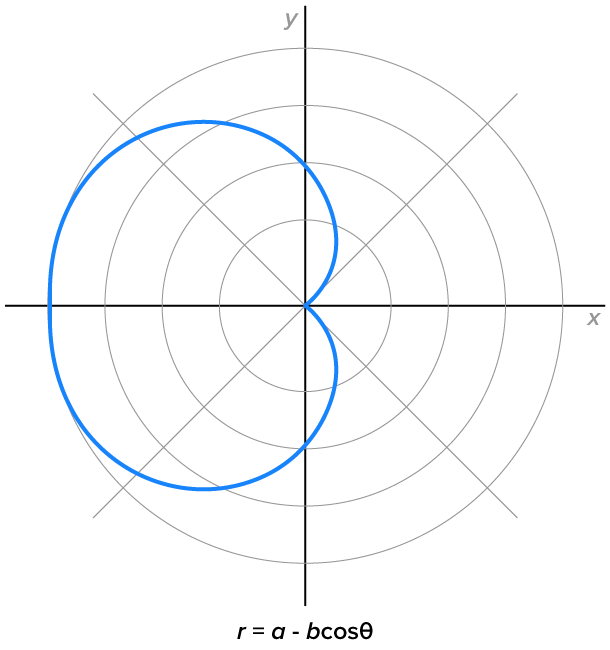
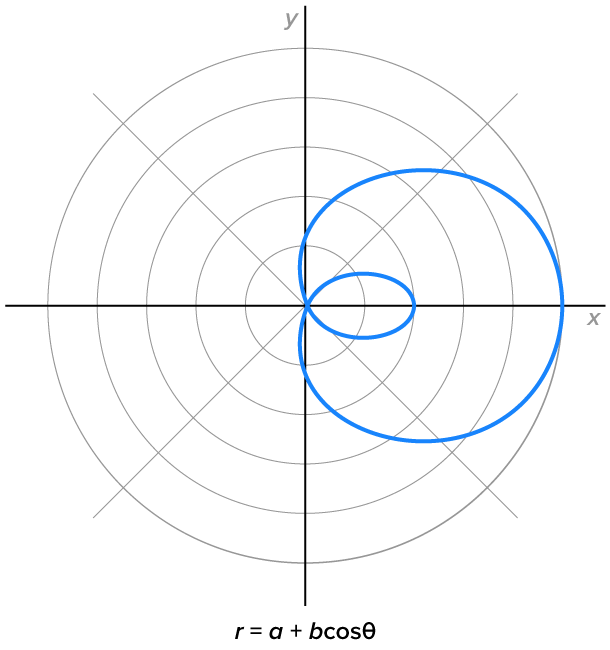
Next, let’s look at polar equations of the form  and
and  where
where  and
and 
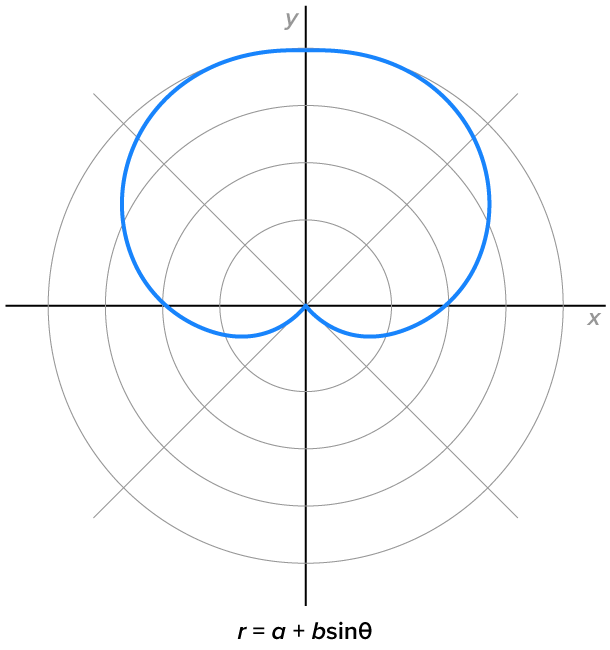
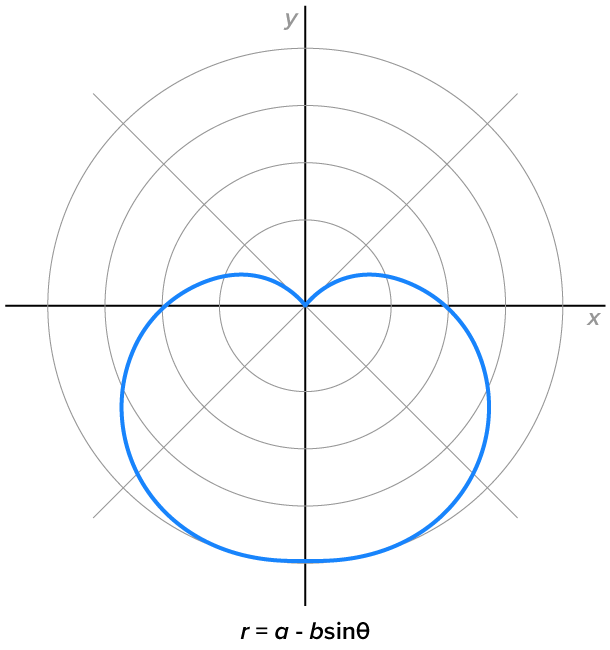
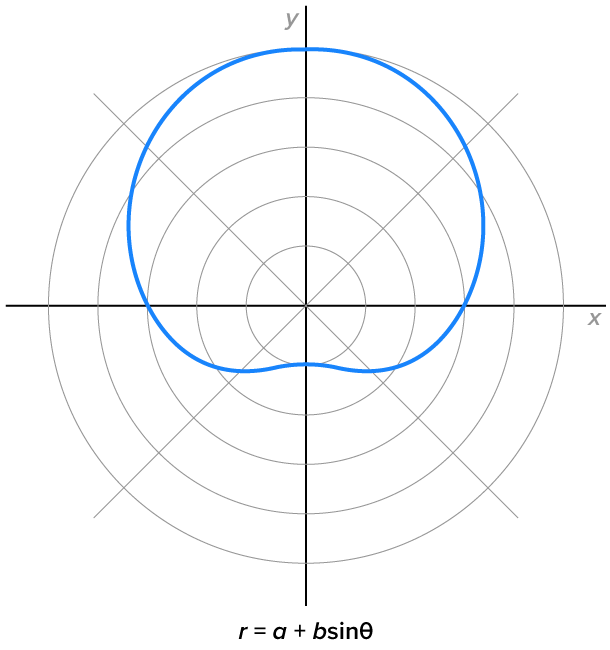
Cardioids, where 
|
|
|
|
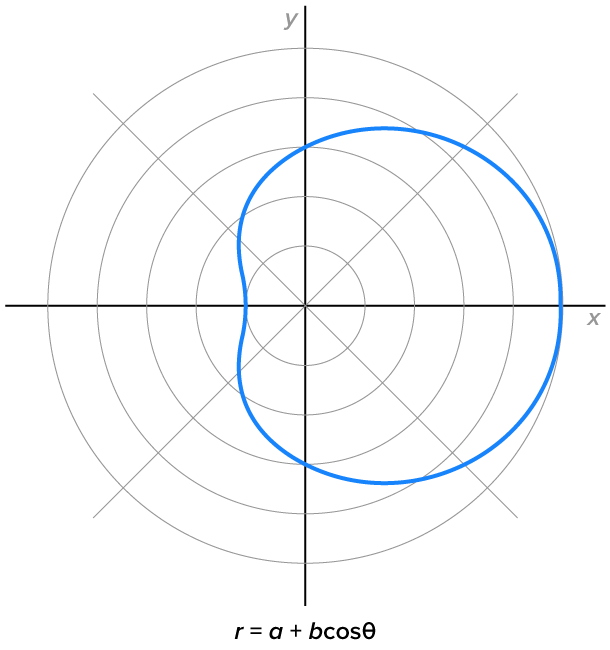
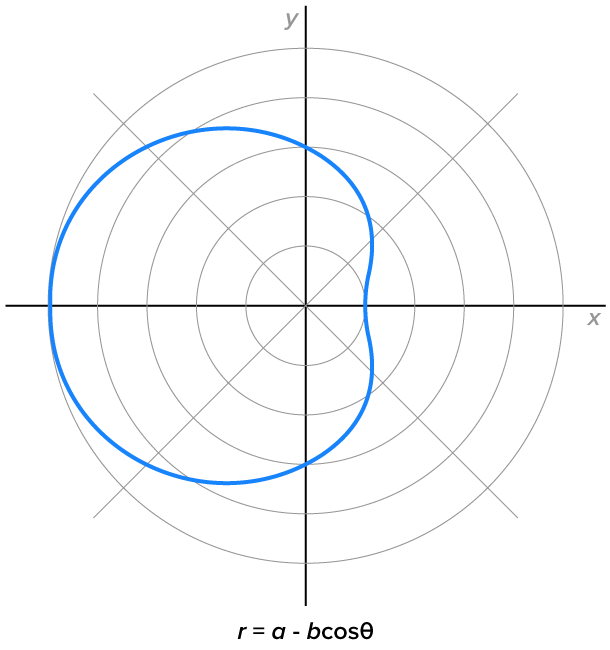
Limacons with dimples, where 
|
|
|

|
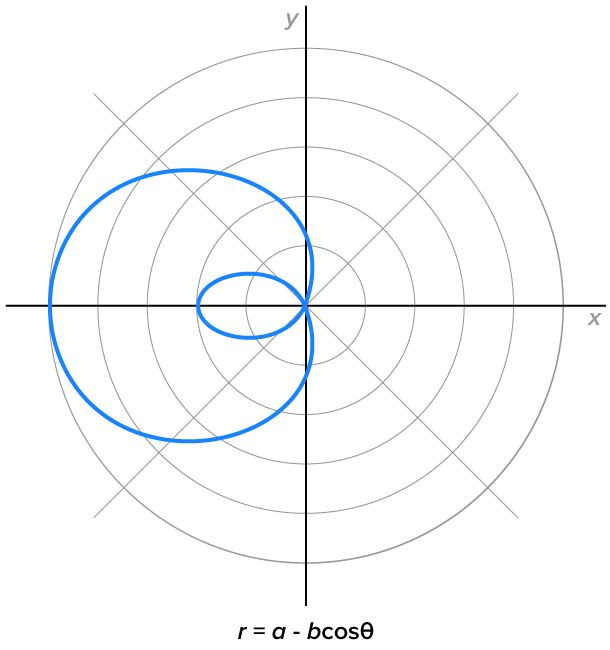
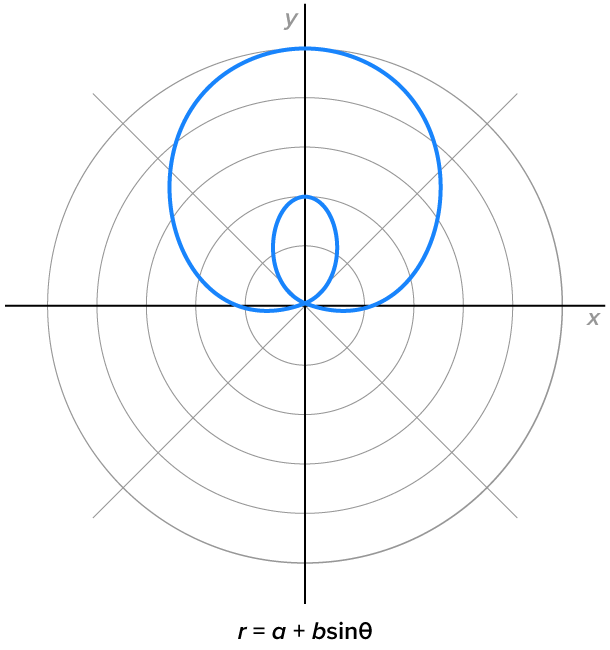
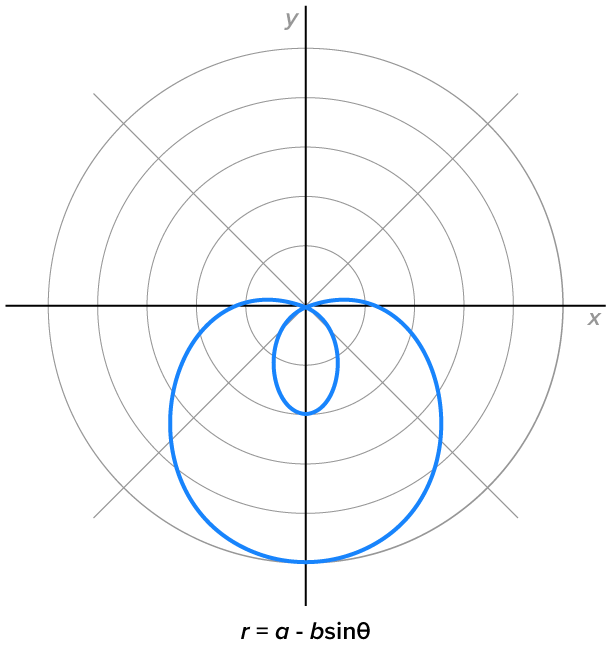
Limacons with inner loops, where 
|
|
|
|
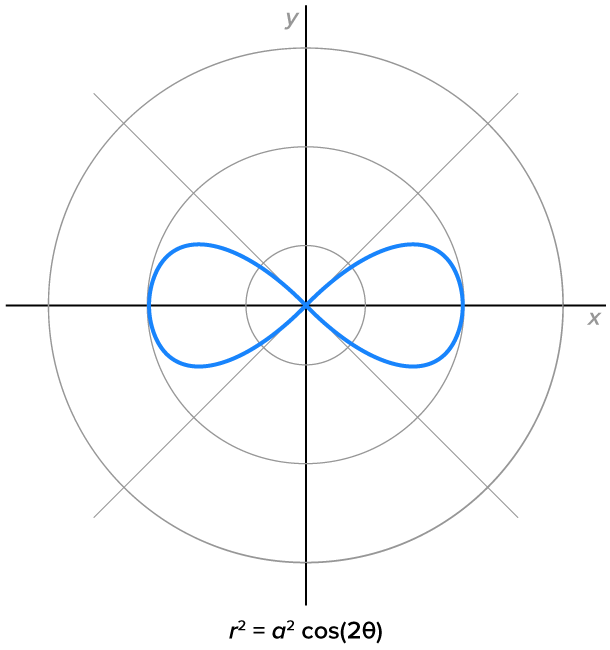
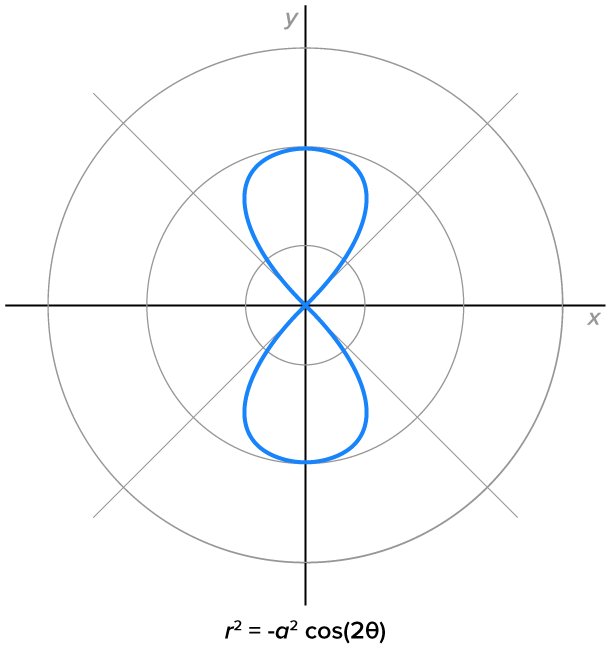
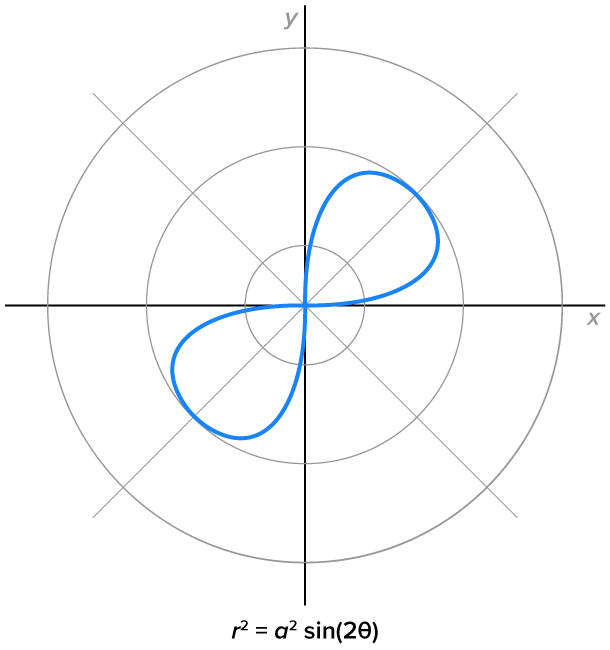
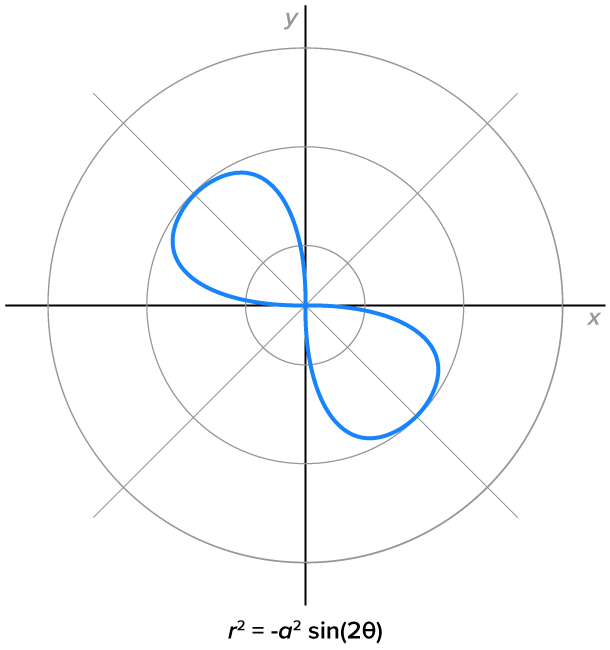
Another type of polar graph looks like the “infinity” symbol. These are called lemniscates, whose equations are  and
and  where
where 
|
|
|
|
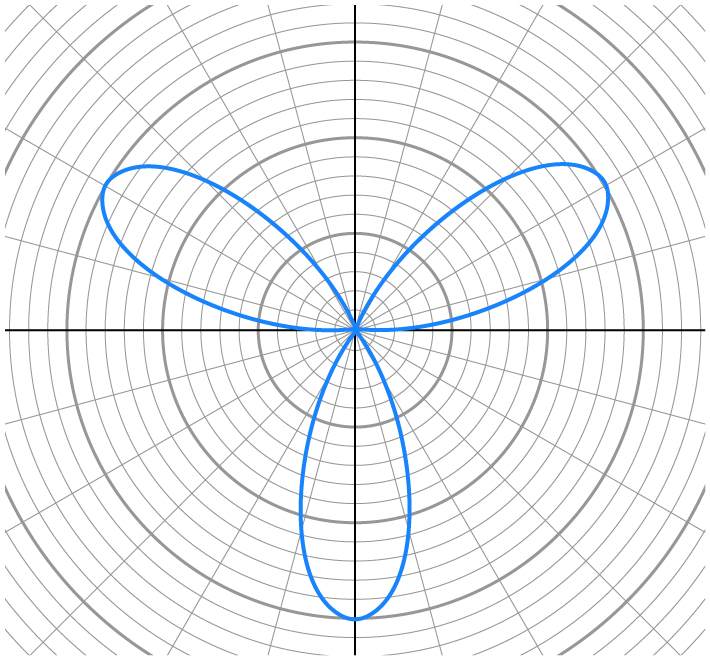
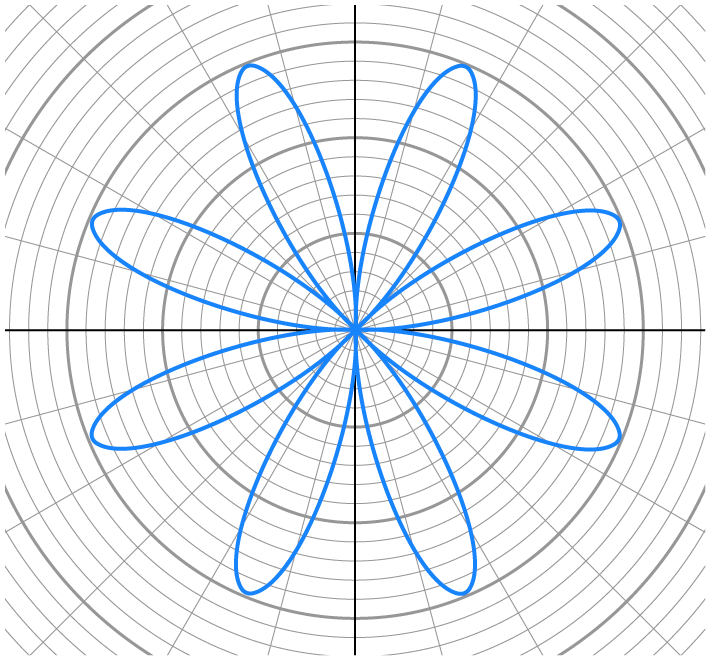
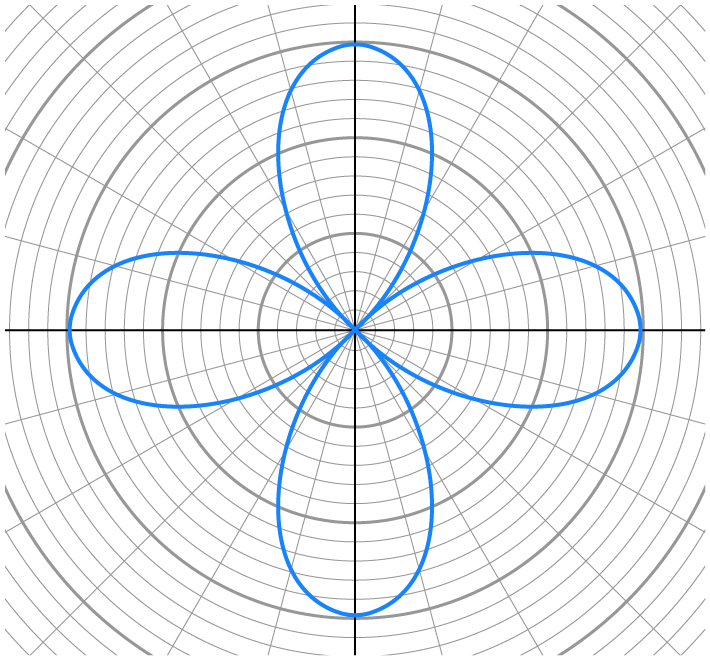
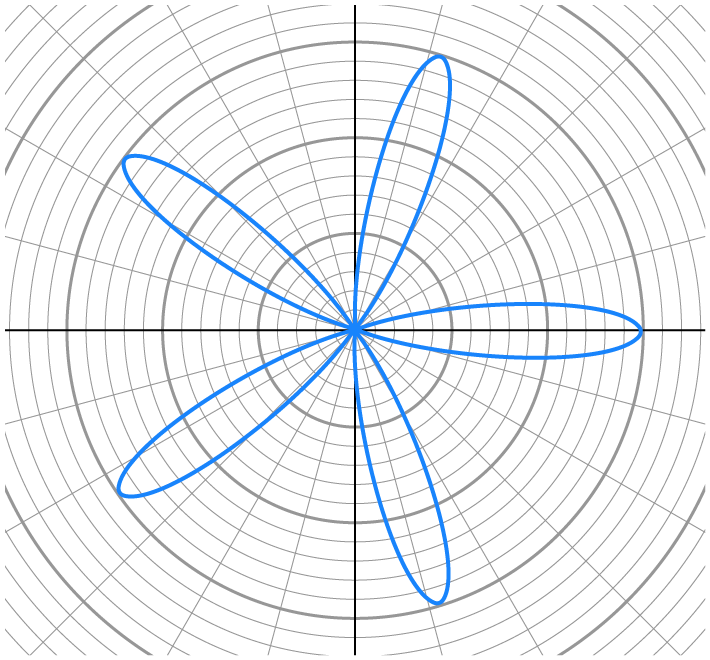
A rose curve (or petal curve) is formed by the equations  and
and  where n is a natural number.
 petals.
  is used in all graphs.

|

|
|---|---|
|
|

|

|
|
|
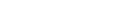
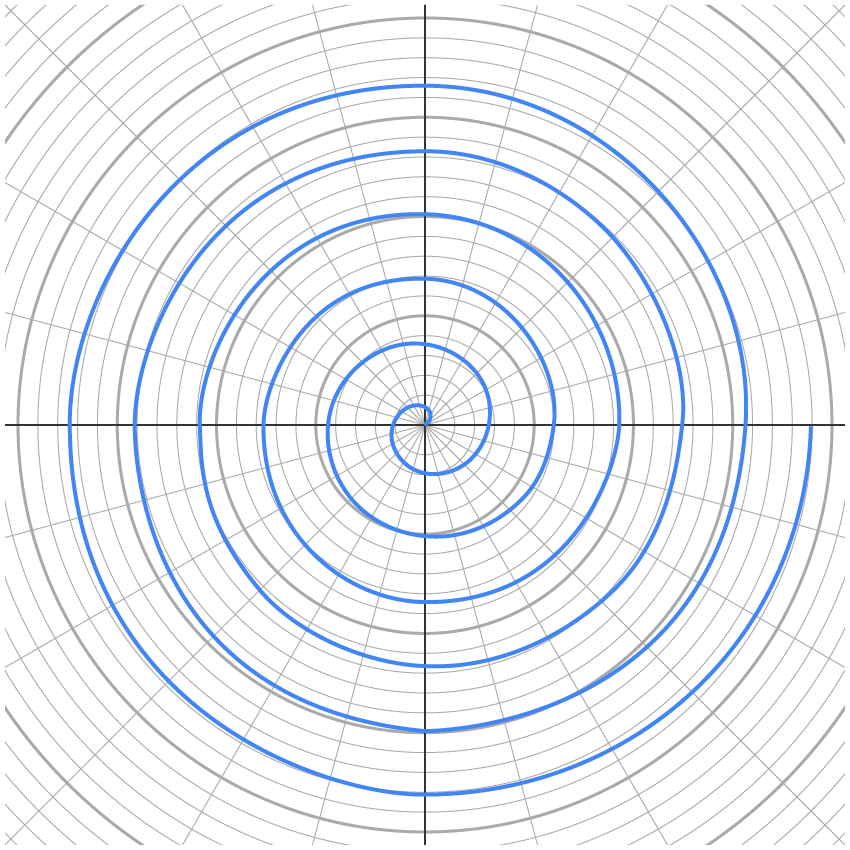
The last curve we will discuss is the spiral of Archimedes, which has the equation  where k is a positive real number.
The graphs on two different intervals are shown below.
|
|
|---|---|
|
|
Notice that as increases, r increases, meaning that the curve steadily gets further away from the origin.
 , then graph polar equations by plotting points to form the curve. There are also several forms of polar equations that are much easier to graph by referencing the graphs of classic polar equations.
SOURCE: THIS TUTORIAL HAS BEEN ADAPTED FROM OPENSTAX "PRECALCULUS” BY JAY ABRAMSON. ACCESS FOR FREE AT OPENSTAX.ORG/DETAILS/BOOKS/PRECALCULUS-2E. LICENSE: CREATIVE COMMONS ATTRIBUTION 4.0 INTERNATIONAL.
