Table of Contents |
When graphing a linear inequality, we generally follow these steps:
| Endpoint IS included in interval | Endpoint IS NOT included in interval |
|---|---|
 or or 
|
< or > |
|
|
 using either a solid or dashed line.
rather than with an inequality symbol. Just remember to use the appropriate line.
(with the variable y isolated on one side), it is simple enough to once again examine the inequality symbol to see which portion of the coordinate plane to shade.
using either a solid or dashed line.
rather than with an inequality symbol. Just remember to use the appropriate line.
(with the variable y isolated on one side), it is simple enough to once again examine the inequality symbol to see which portion of the coordinate plane to shade.
EXAMPLE
Graph the linear inequality .
.
| Step | Explanation | Graph |
|---|---|---|
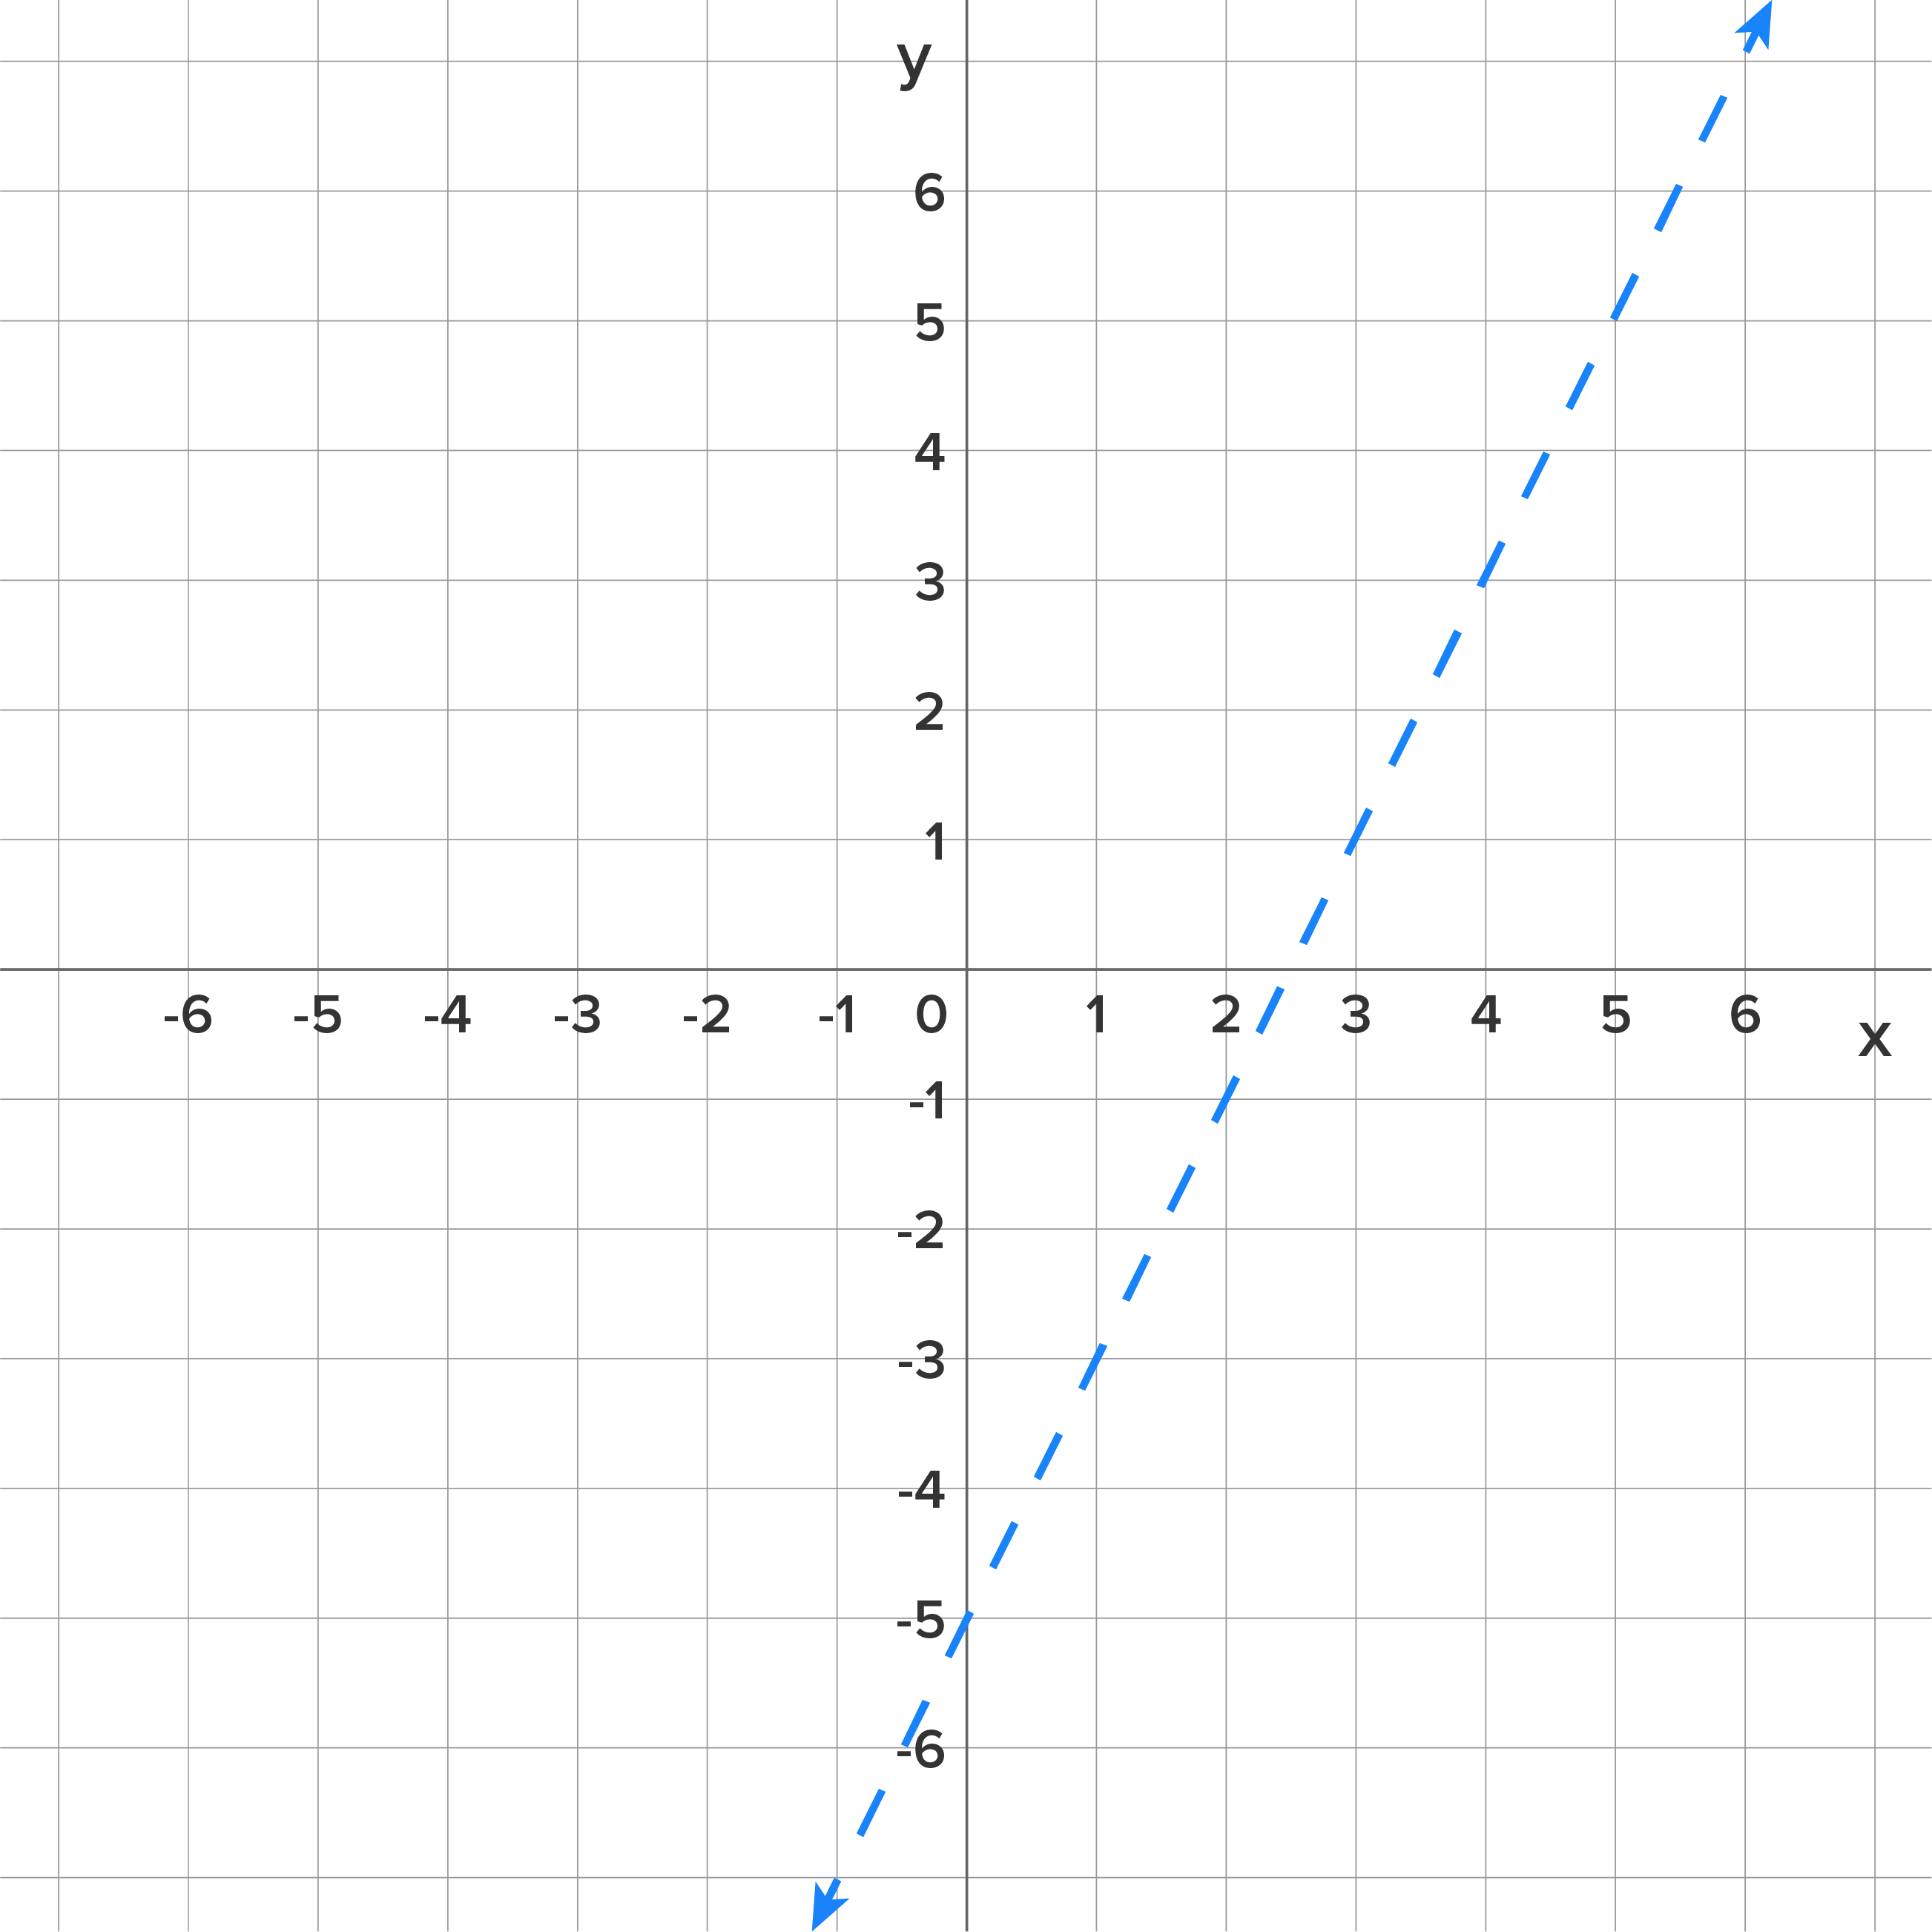
| 1. Use solid or dashed line. | To start, we note that the inequality symbol is strict, thus we will use a dashed line. |
|
|
2. Graph the equation of the line as .
|
Next, we note the y-intercept of -5 and the positive slope of 2 to create the start of our graph. |
|
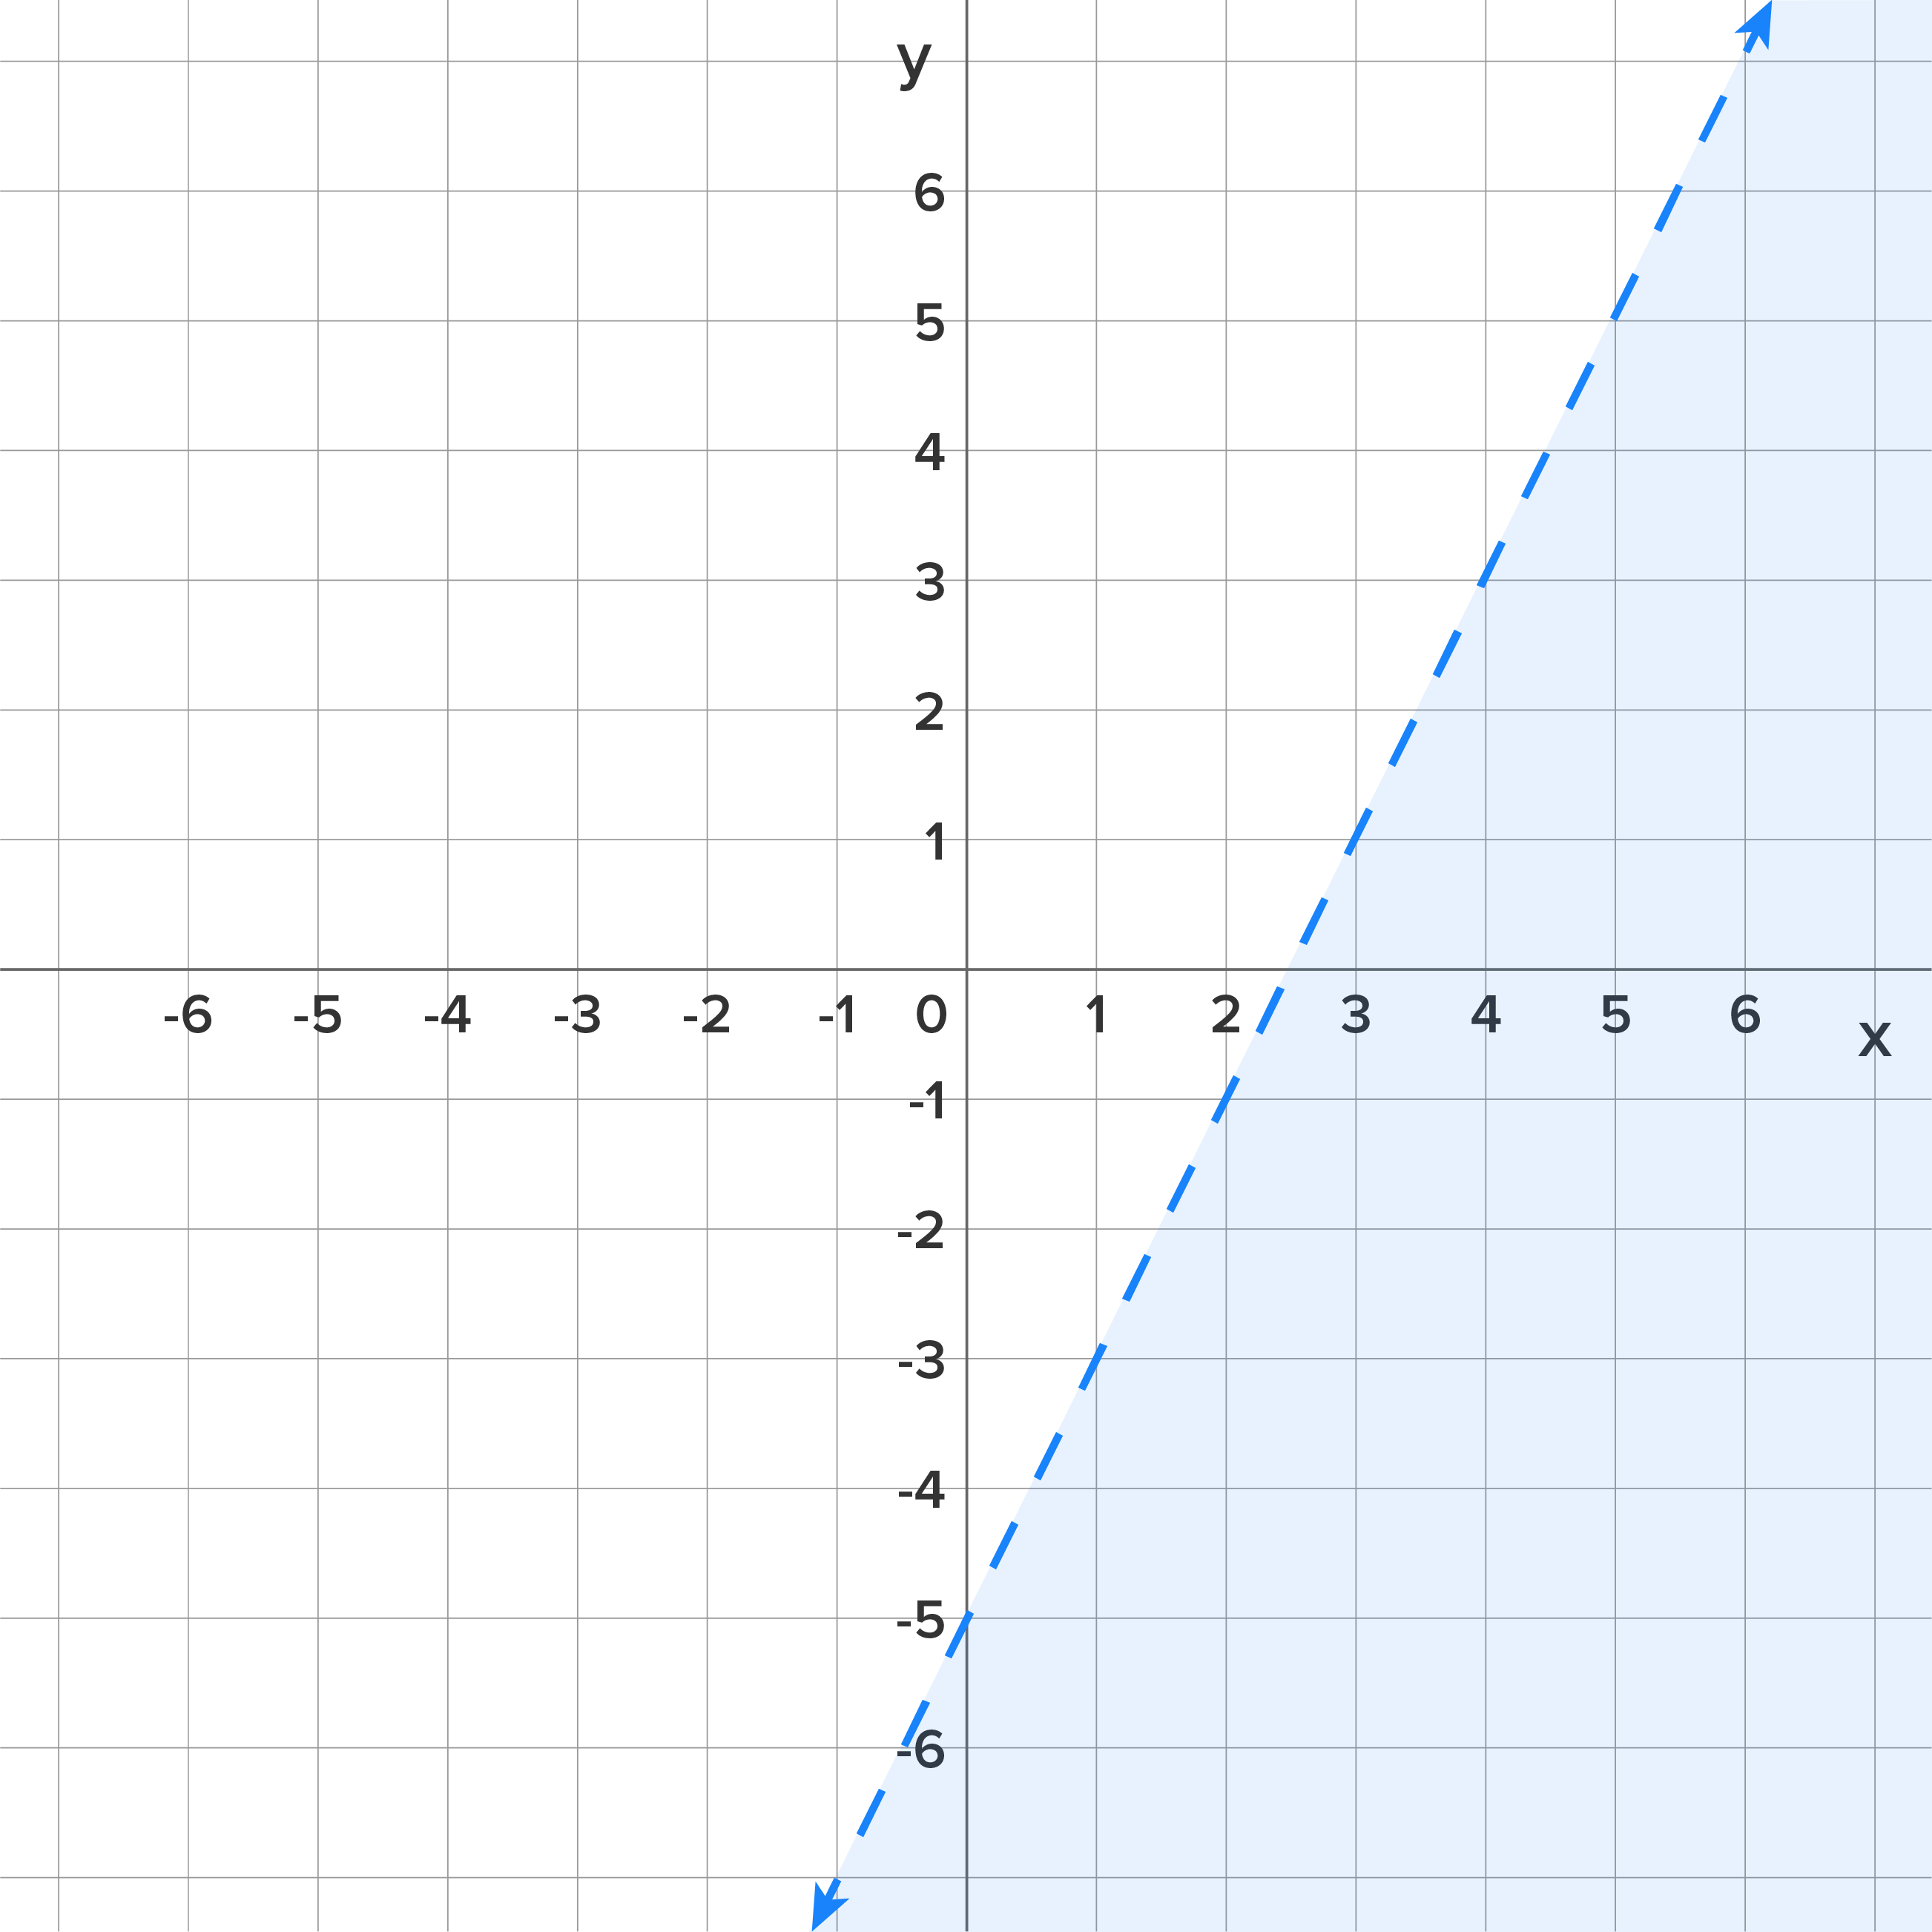
| 3. Shade above or below the line. |
Since our inequality is , a less-than inequality, we know to shade everything below our dashed line.
|
|
 is considered the boundary line, where coordinates on one side of the line are solutions, and coordinates on the other side of the line are non-solutions. The highlighted region is known as the solution region, as it shows all possible x- and y-values that satisfy the inequality.
Results Driven: Skill in Action |
While using the above method to determine which half of the coordinate plane to shade, there is a more mathematically sound method. This method will be particularly useful when graphing non-linear inequalities, where "above the line" and "below the line" aren't as clear cut.
A test point is any coordinate (x, y) that does not lie on the boundary line. We can think of it as being a representative for all other coordinates on that side of the boundary line. If our test point satisfies the inequality, it represents a solution, as do all the other points on that side. If our test point does not satisfy the inequality, then it represents a non-solution, and the other side of the boundary line should be shaded.
EXAMPLE
Consider the example from above. Suppose we have completed Step 2 and have drawn our boundary line. Now we need to determine which side to shade. |
|
Our inequality |

|
Use (0, 0) as our test point. |

|
Evaluate 2(0). |

|
Evaluate  . is a false statement, meaning (0, 0) is not in solution region . is a false statement, meaning (0, 0) is not in solution region
|
Source: THIS TUTORIAL WAS AUTHORED BY SOPHIA LEARNING. PLEASE SEE OUR TERMS OF USE.