Table of Contents |
When we graph a function, we are considering the entire function. What if we only wanted part of the graph?
EXAMPLE
For example, consider the function and several “pieces” of the graph, as shown below:
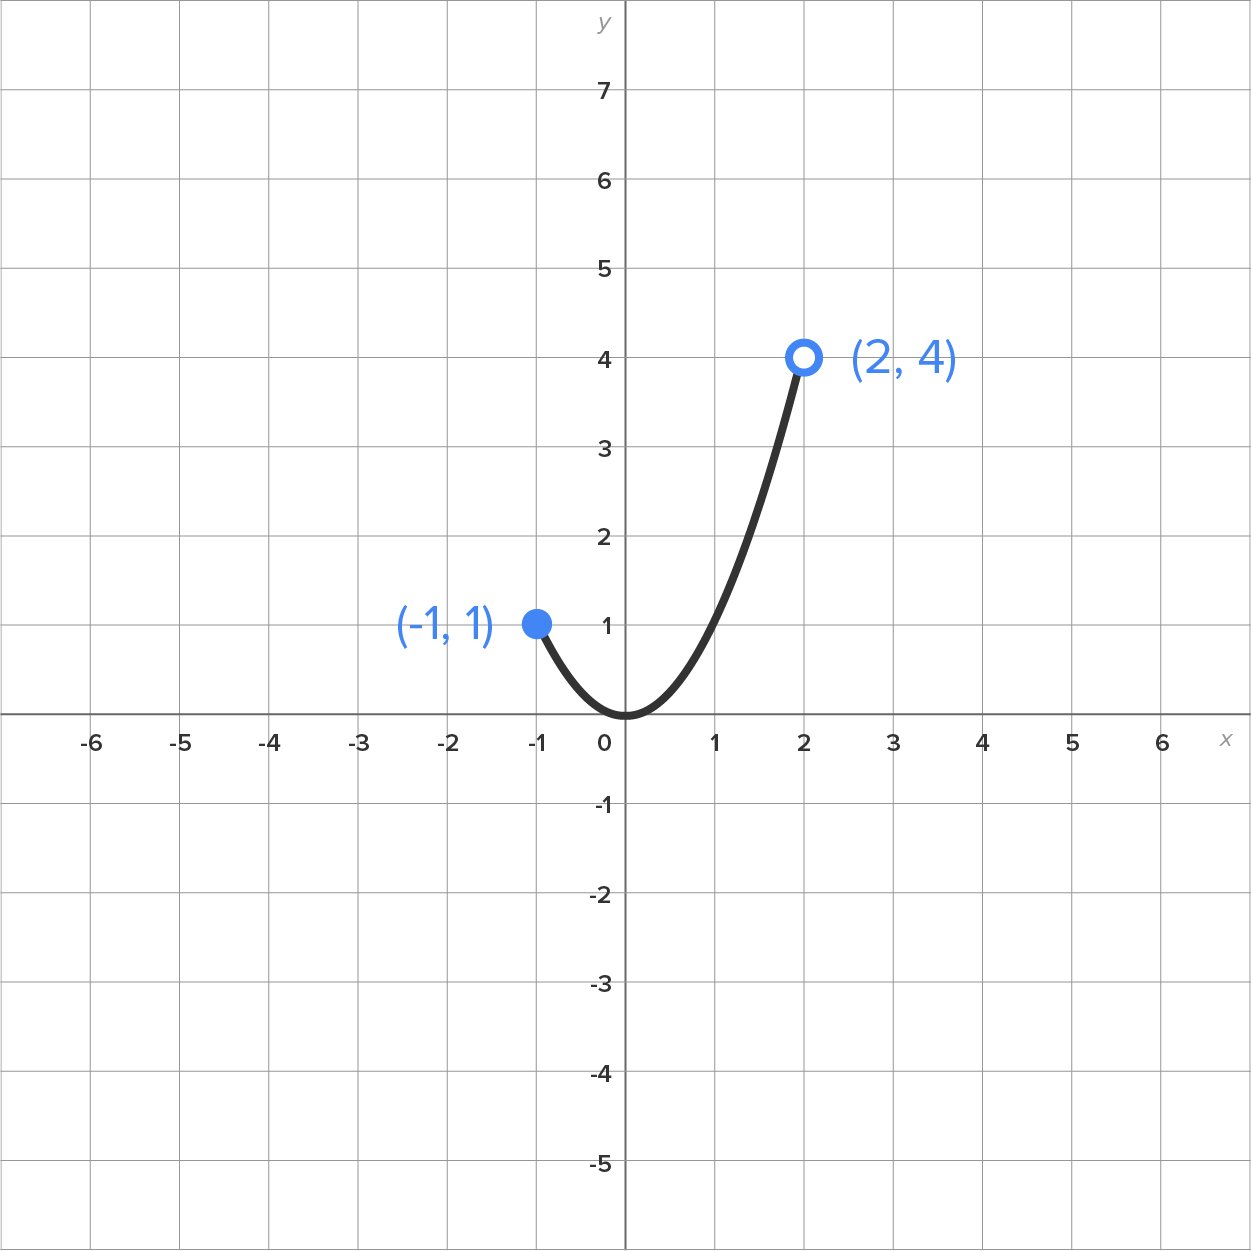
Graph 1:  (entire graph) (entire graph)
|
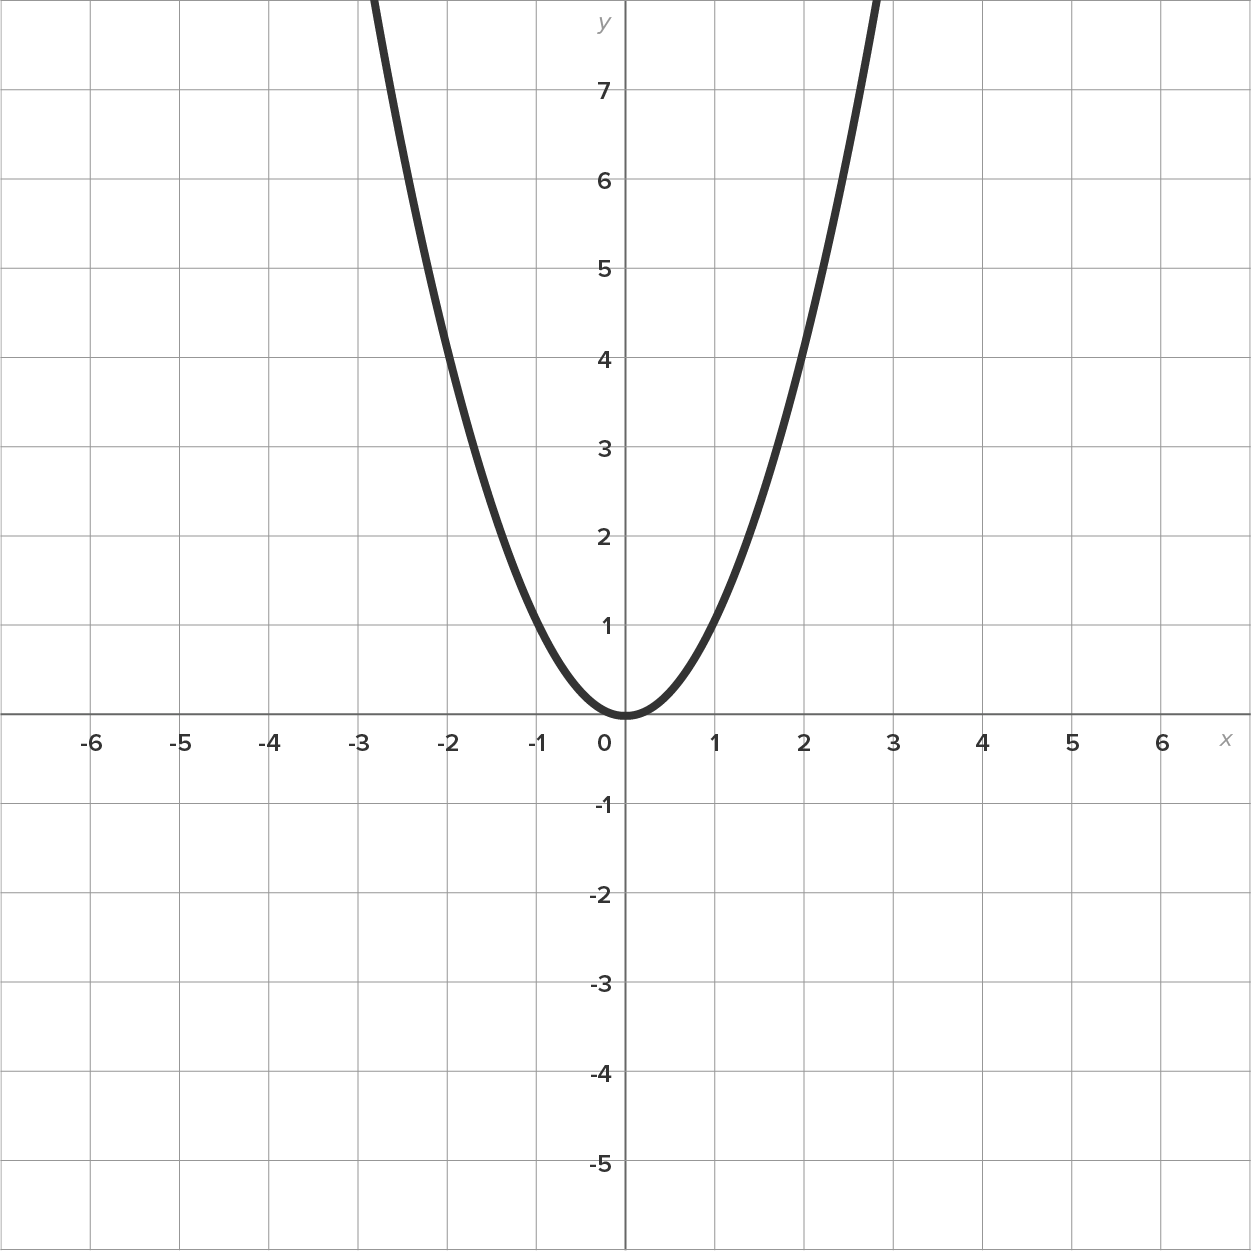
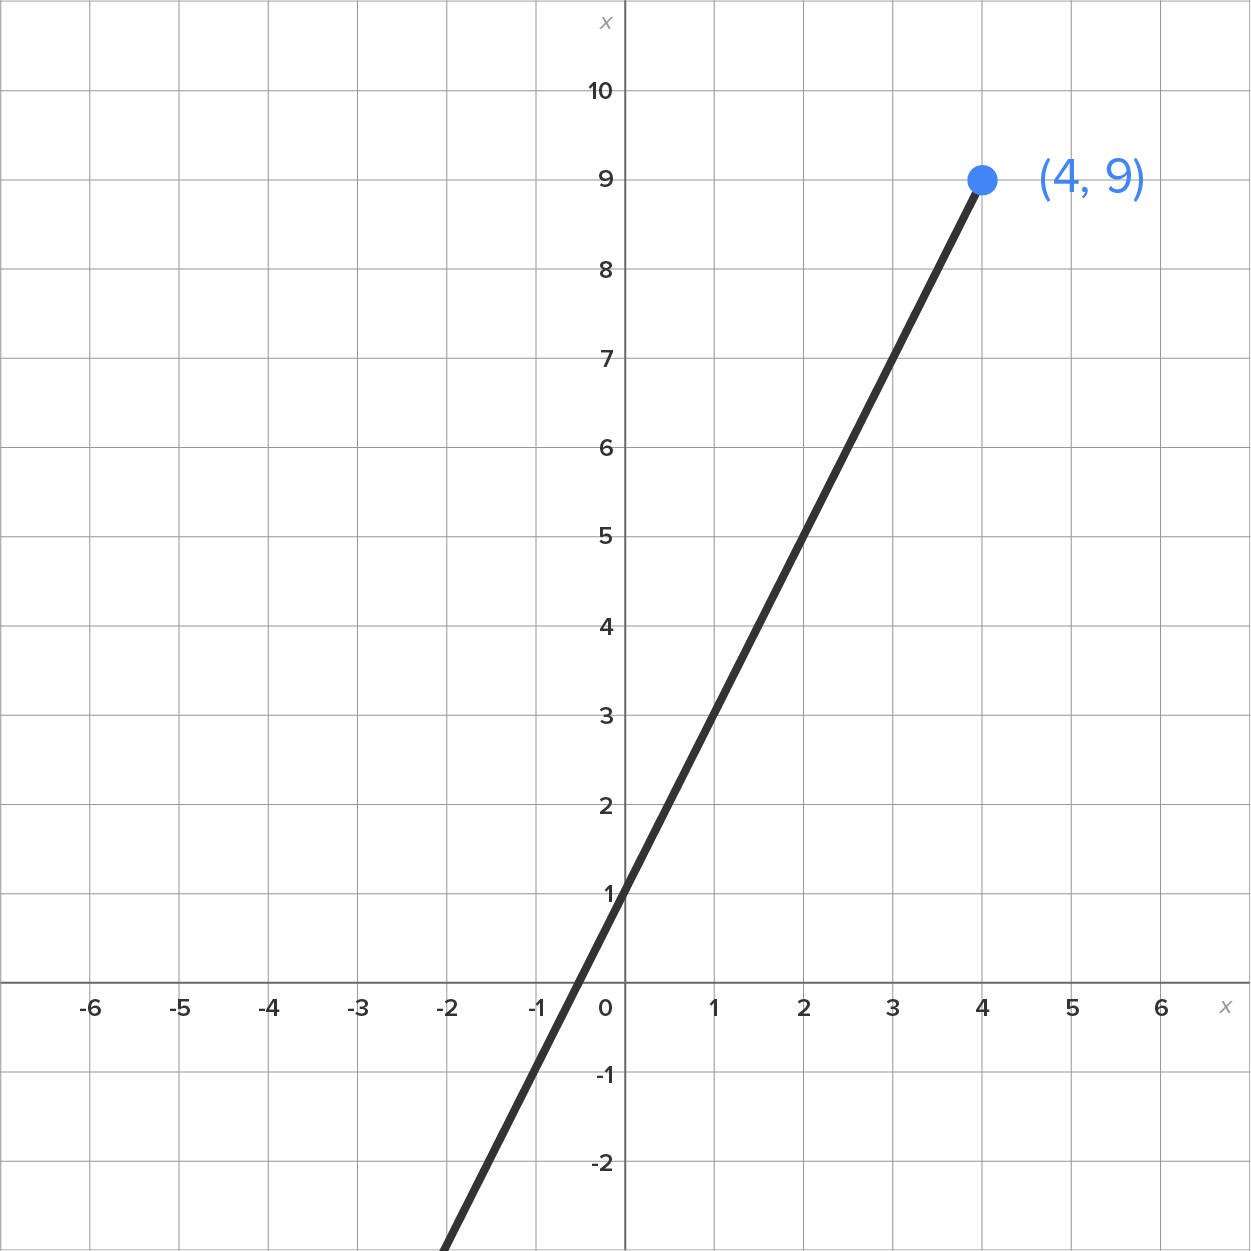
Graph 2: 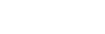
|
|---|---|
|
|
Graph 3: 
|
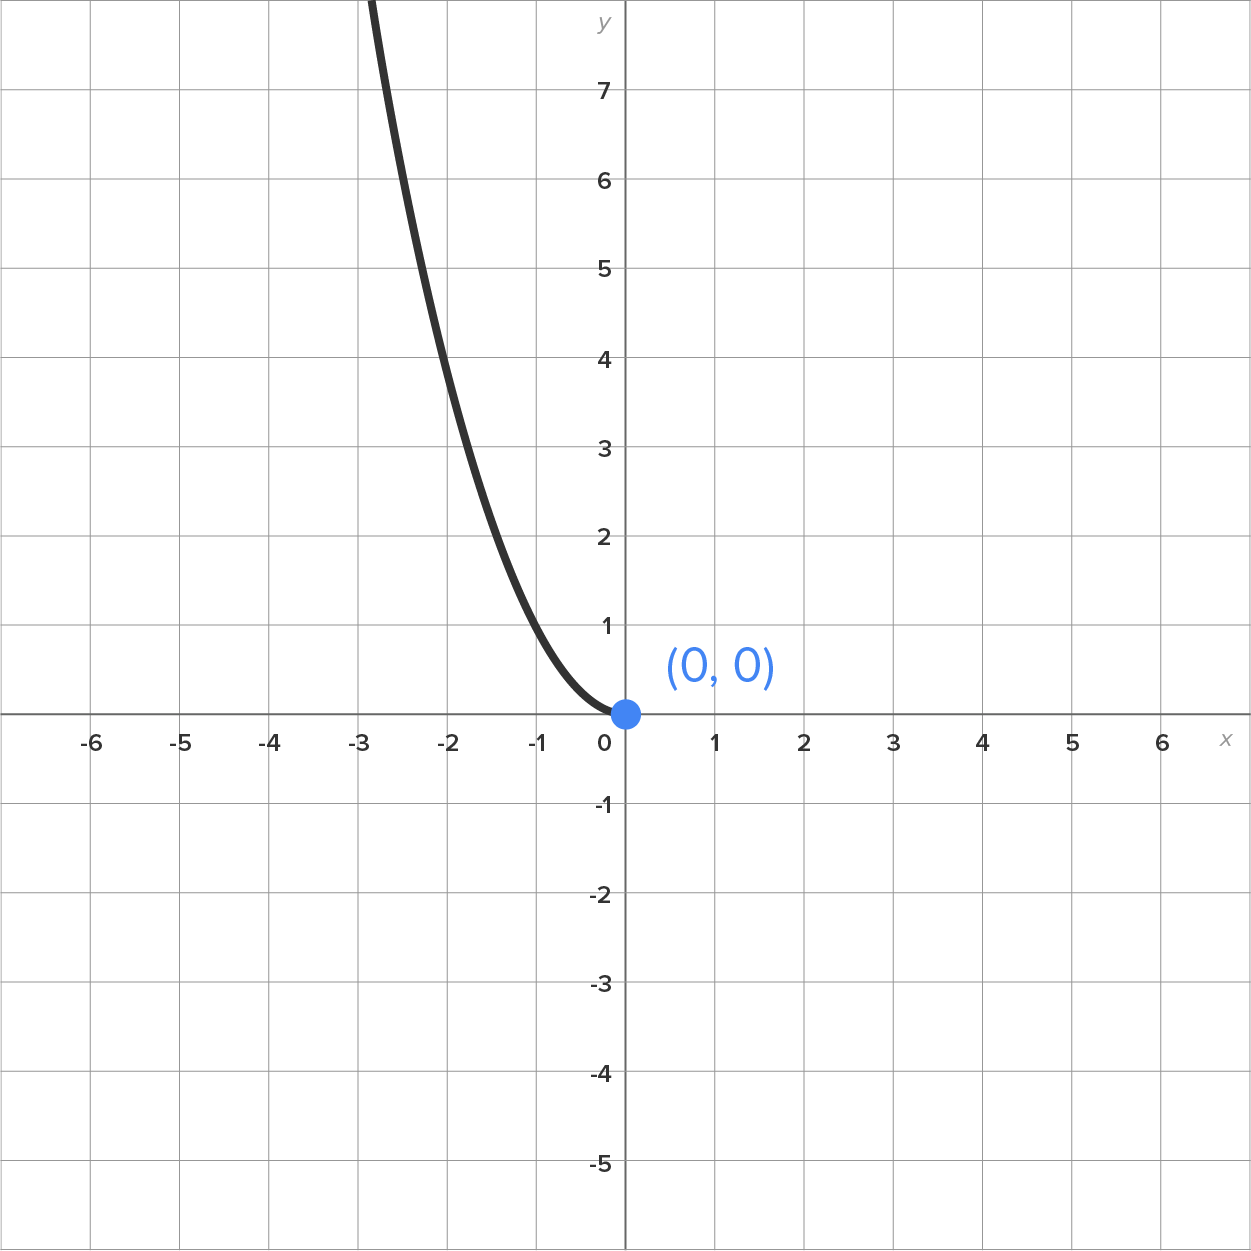
Graph 4: 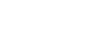
|
|
|
To sketch a portion of the graph, a restricted domain is used. Recall that the domain of a function is the set of all possible inputs for a function.
For example, in Graph 3 above, the  is the domain restriction since it is not the entire domain of
  (which is all real numbers).

 is a line with slope 2 and y-intercept 1, we graph the line but only for values of x up to and including 4.
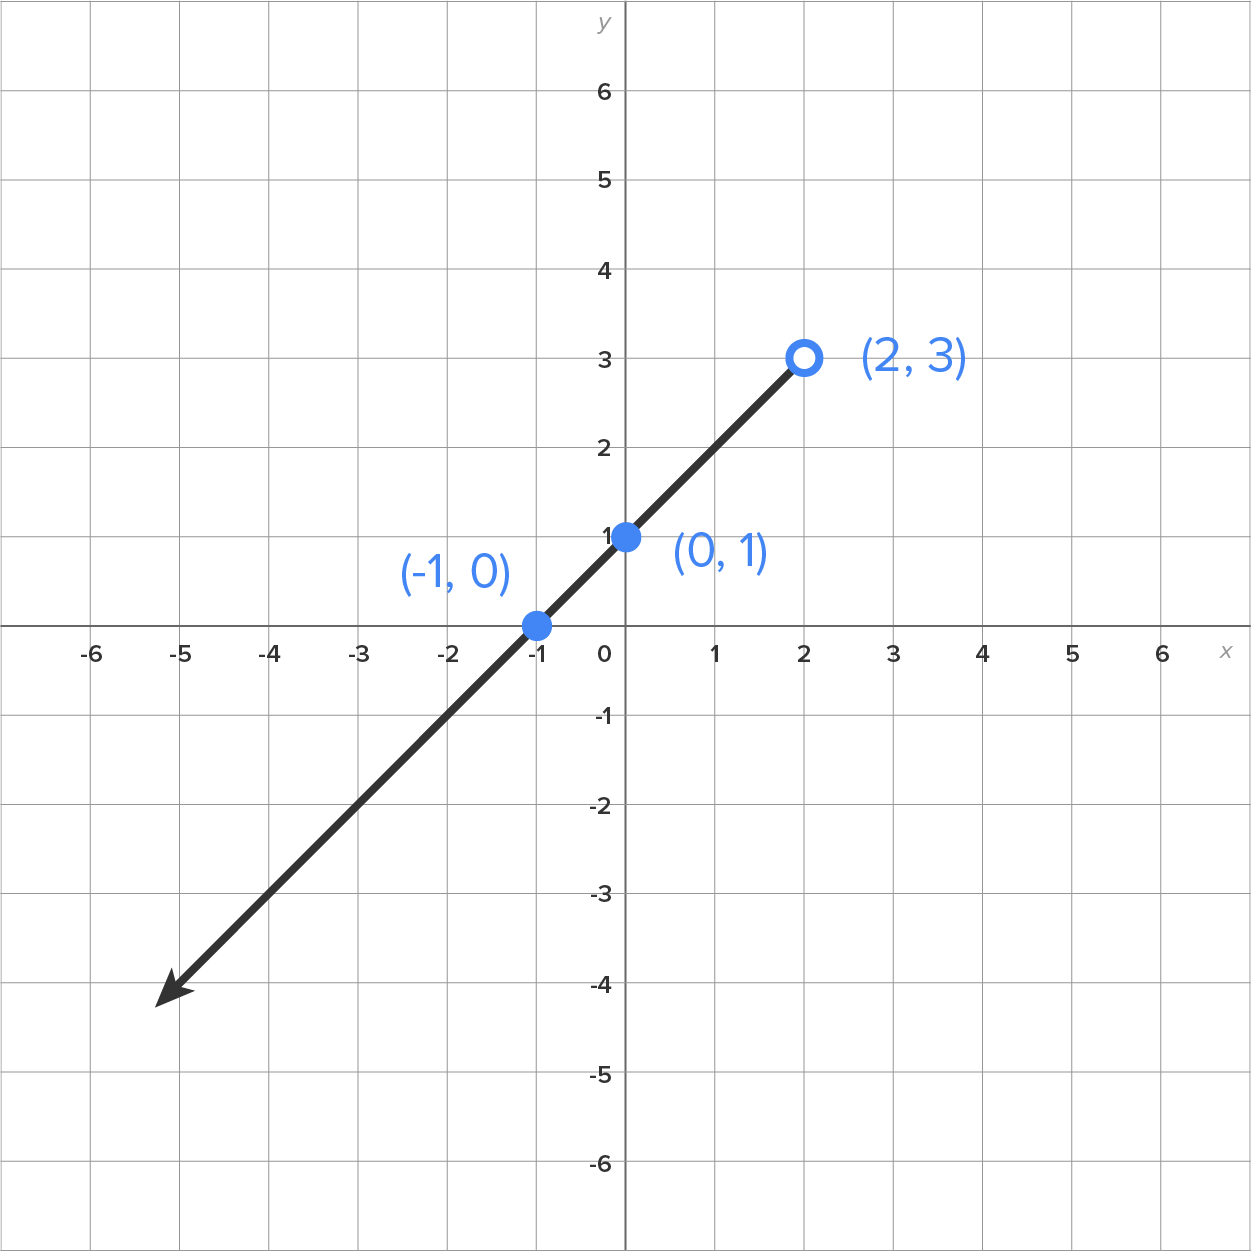
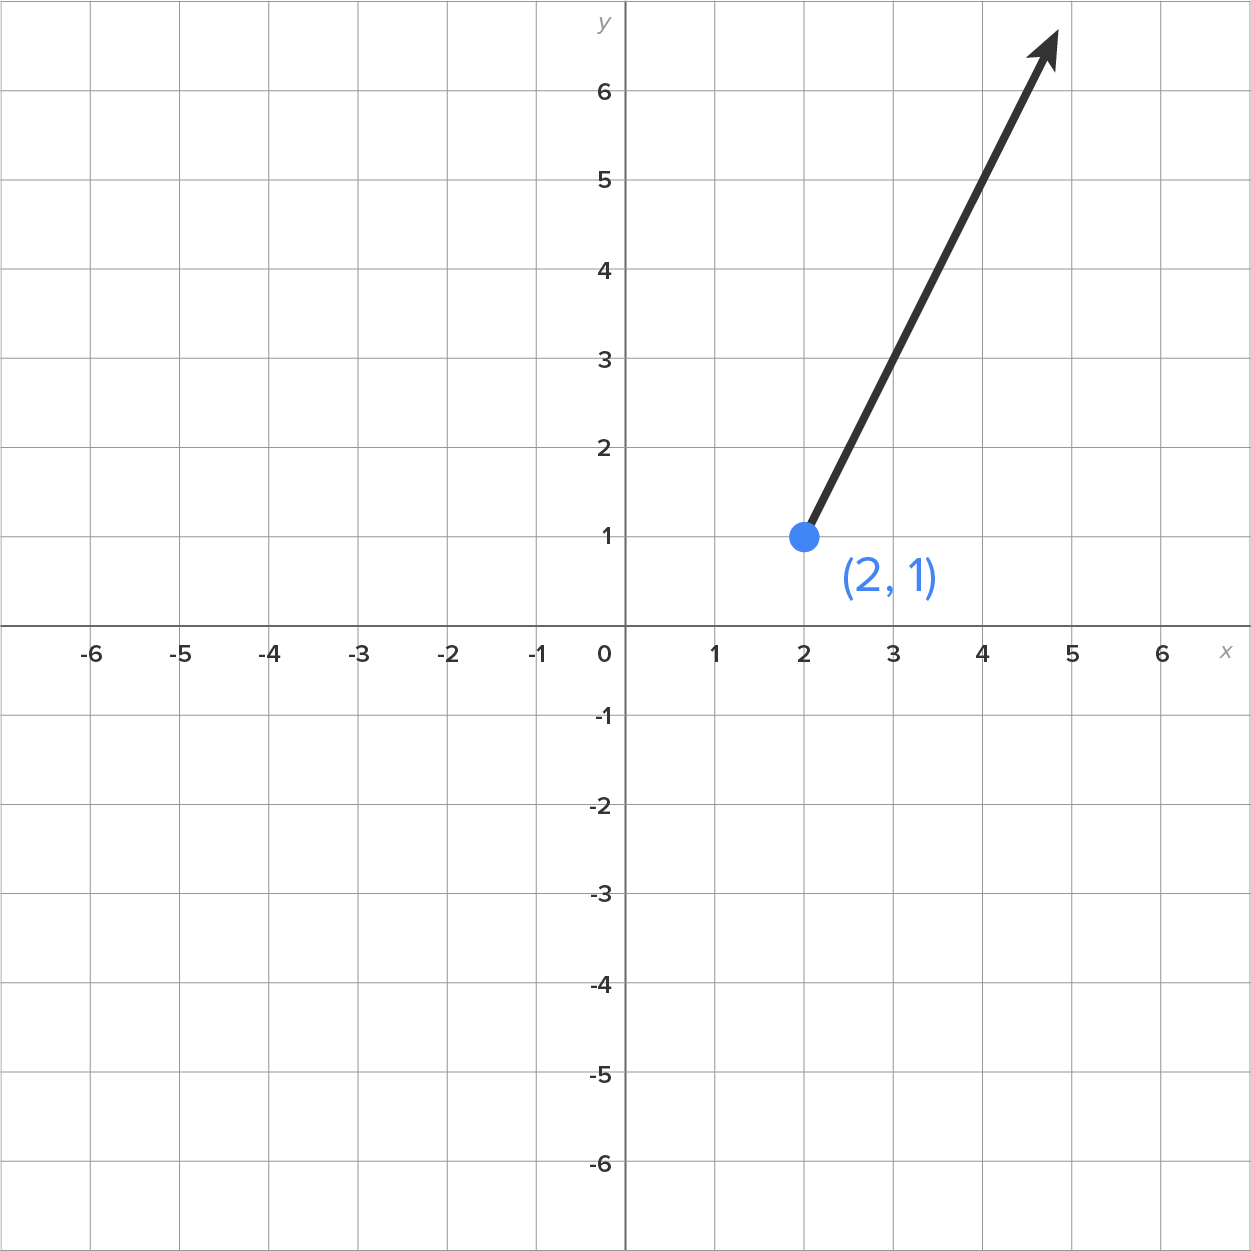
A piecewise function is made up of other functions that are on restricted domains. For example, consider the function:

 ”, but only if the input is less than 2; and to use “
 ” if the input is at least 2.
This means that the graph of the function will be “part of” the graph of  along with “part of” the graph of
  Here is how we put this together:

|

|
|---|---|
|
|
The graph of  is these pieces put together on one graph as follows:
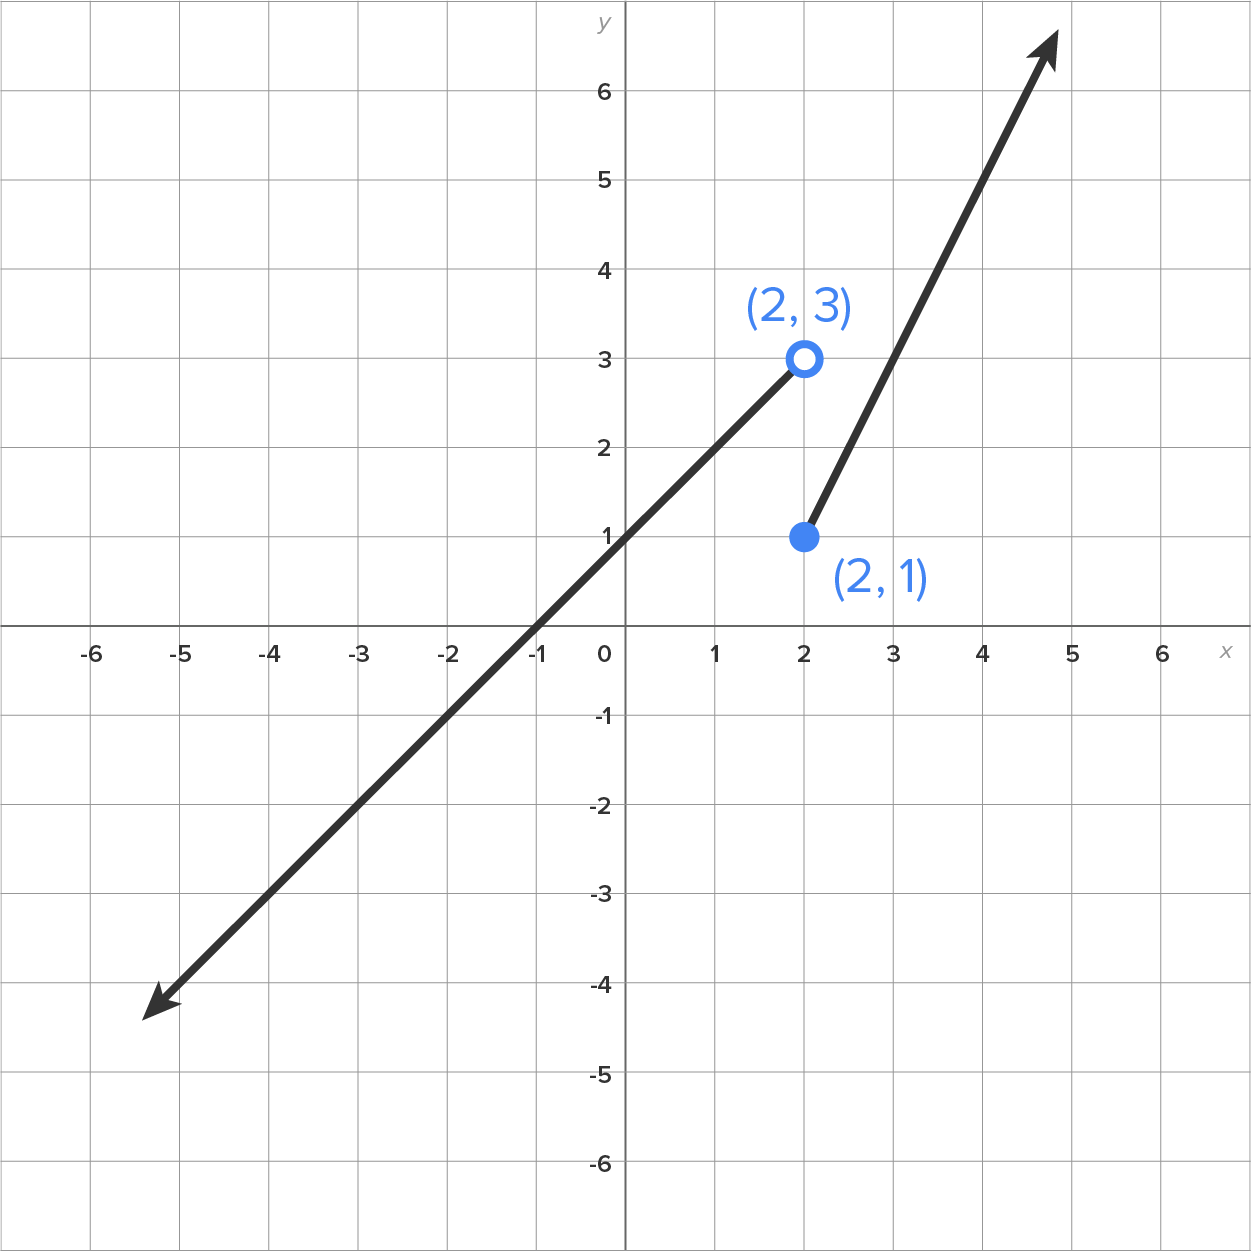
 and
and  on the same axes, you would have this picture.
SOURCE: THIS TUTORIAL HAS BEEN ADAPTED FROM CHAPTER 0 OF "CONTEMPORARY CALCULUS" BY DALE HOFFMAN. ACCESS FOR FREE AT WWW.CONTEMPORARYCALCULUS.COM. LICENSE: CREATIVE COMMONS ATTRIBUTION 3.0 UNITED STATES.
