Table of Contents |
Notice that the exponential equation  can be written in the form of
  , if
, if  or
or  . If the base is a positive number greater than 1, then the general form of the graph will look like this:
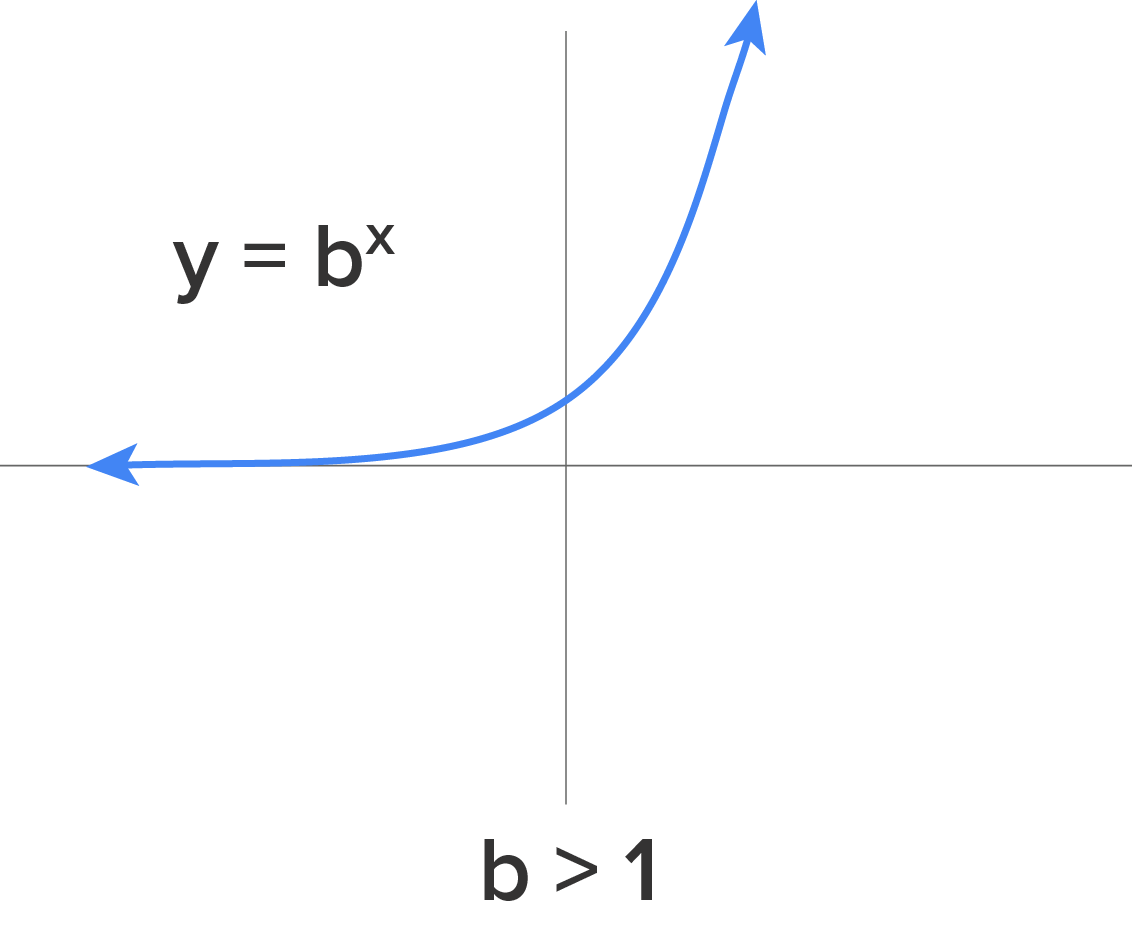
We see that, in this case, as x gets larger (approaches positive infinity), the value of y also increases and approaches positive infinity. The larger the base, b, the faster that y increases to positive infinity. On the other hand, as x gets smaller (approaches negative infinity), the value of y gets smaller as well, but it approaches zero, rather than negative infinity. Again, there are restrictions to the base of exponential equations, such that the base must be greater than 0 and cannot equal 1.
Looking at the graph of the exponential function, the domain of , or the values that x can take on in the equation, are all x values from negative infinity to positive infinity.
However, the range, or the y values that will output from the equation, is greater than zero to positive infinity. As the x value approaches negative infinity, the y values approach 0 but never actually touch the x-axis. There are no x values that make y a negative number (when both  and b are both positive). The range of an exponential function is greater than zero to positive infinity.
and b are positive:
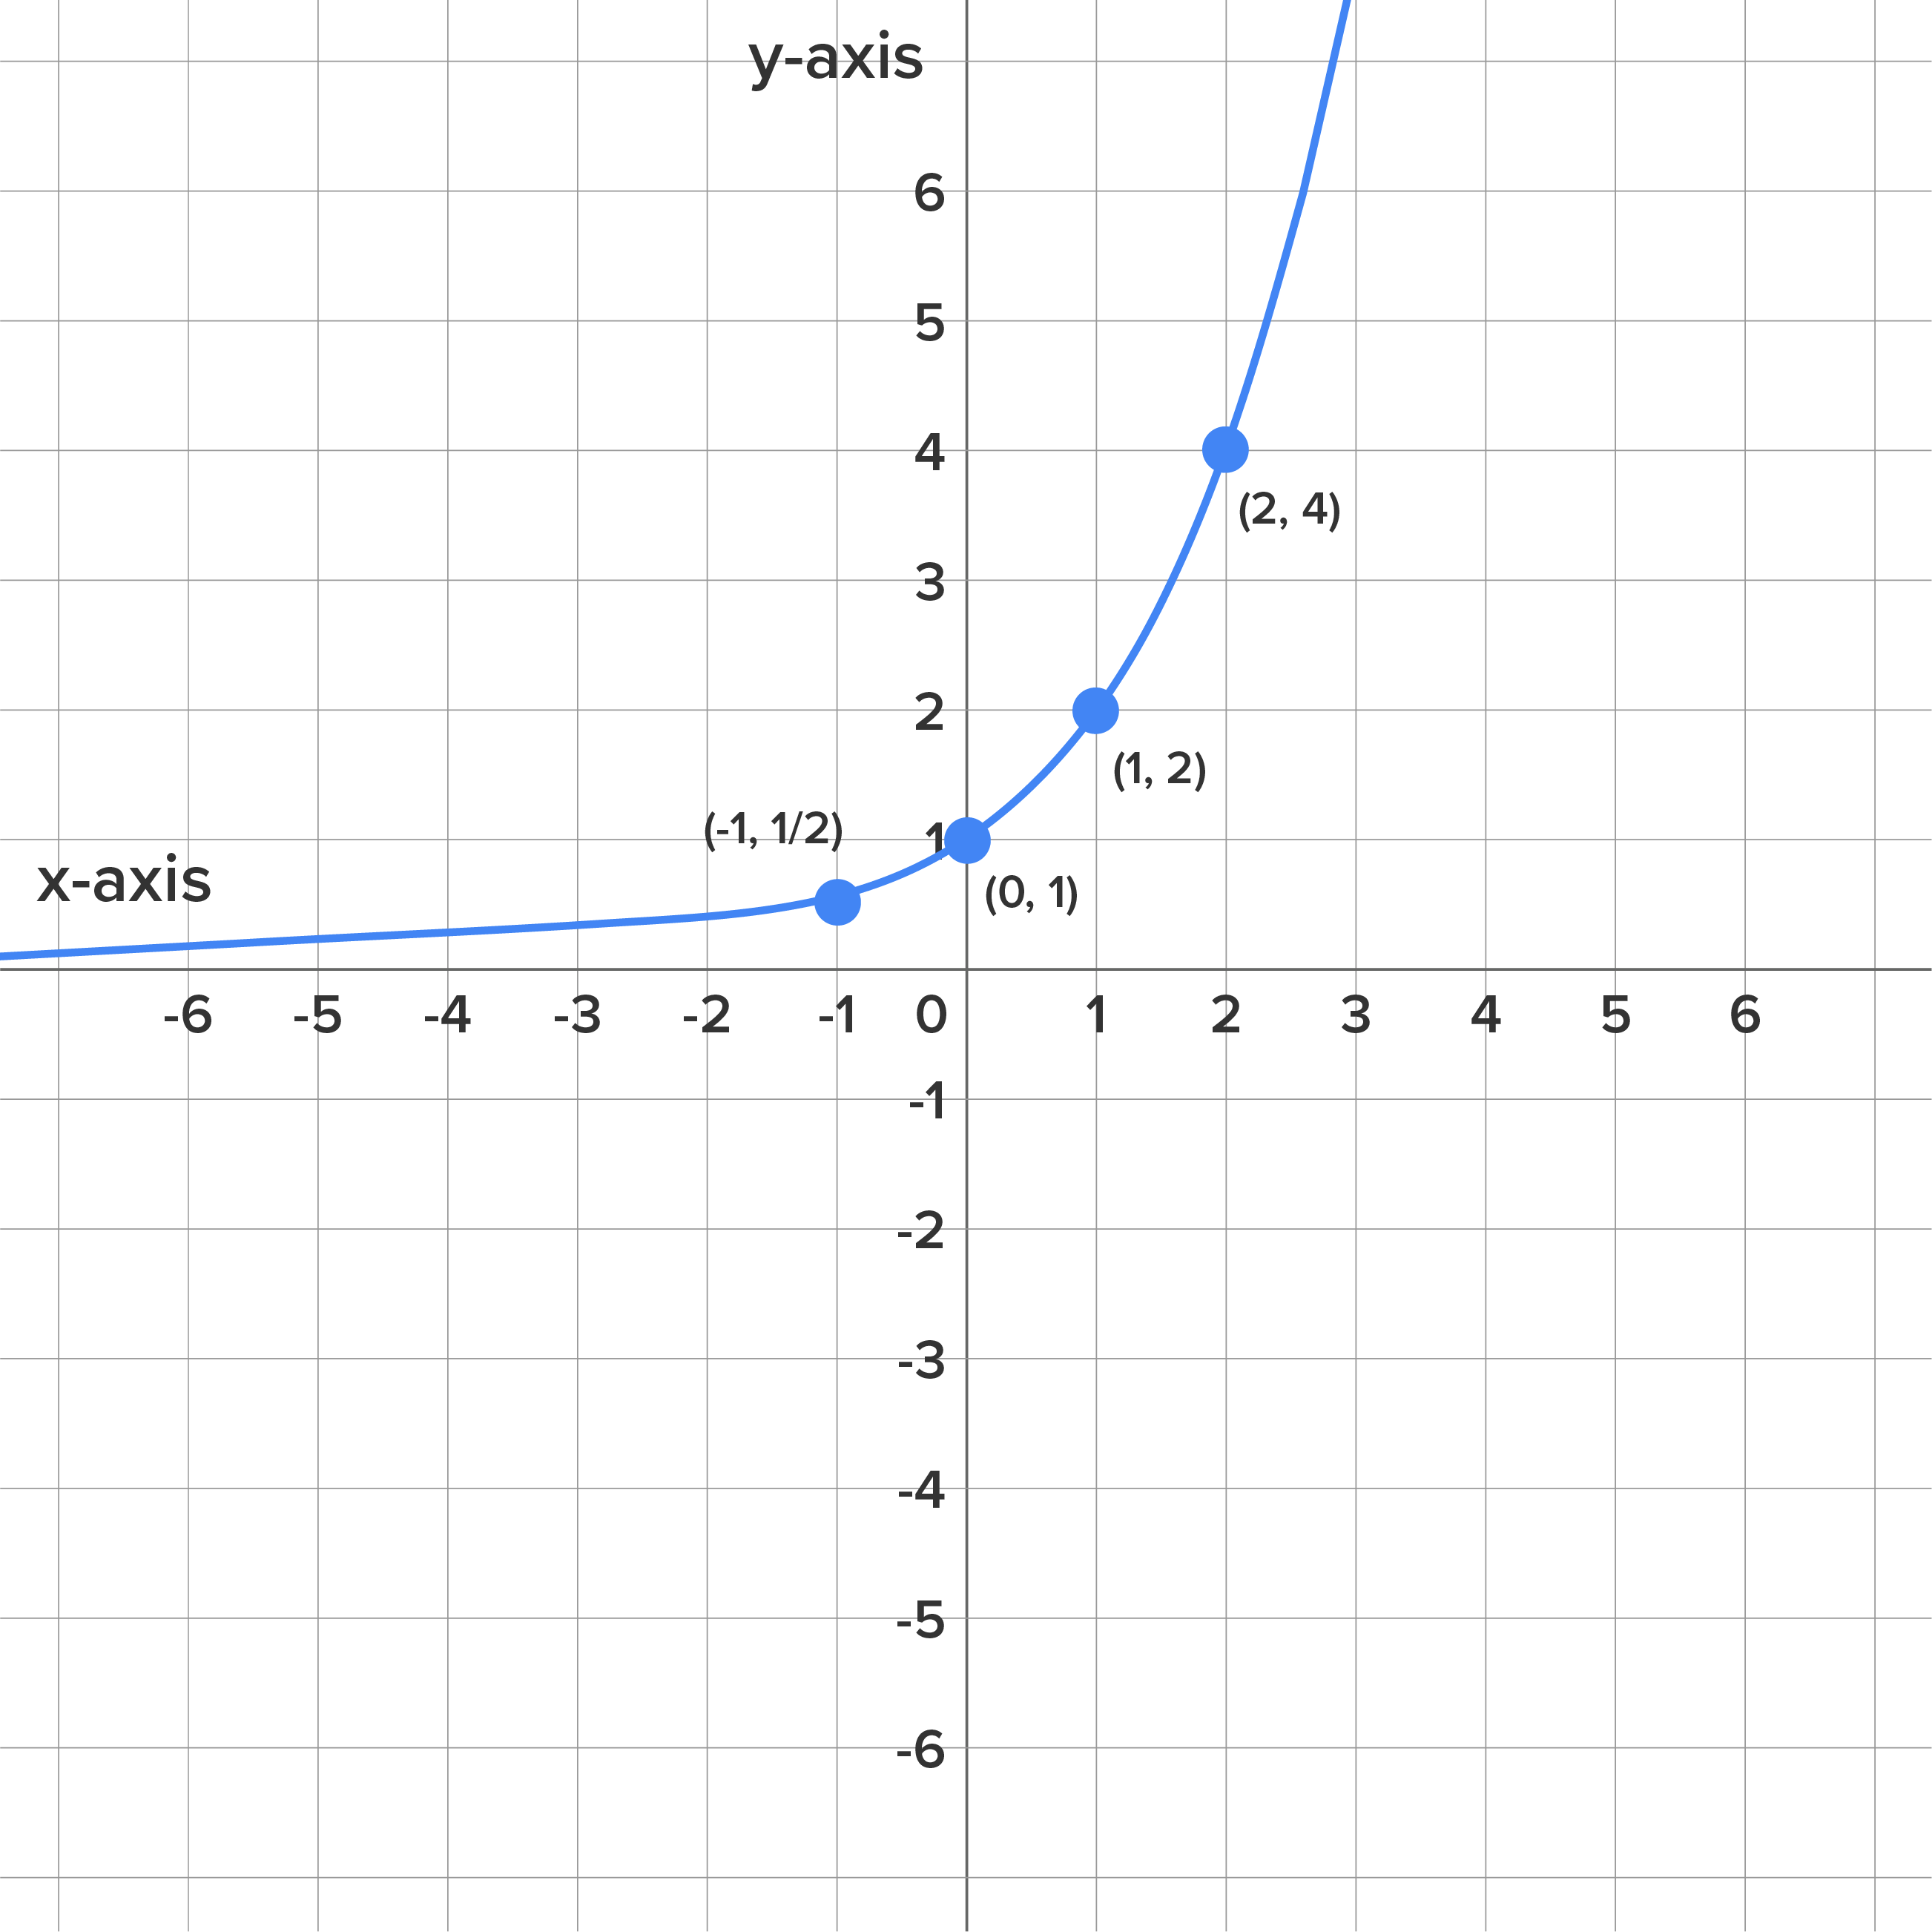
We can plot points on an exponential graph by evaluating the function at different values of x. The evaluated y can be put into our coordinate point (x, y). For example, if we evaluate the function  at
at  , then we will get
  . So, when , the evaluated y from the function is 2, or
  . This means that the point (1, 2) is on the graph of the function .
What is the y-intercept of equations in the form ? Recall, the y-intercept of an equation is the point on the graph at which the line or curve touches or crosses the y-axis. This always occurs when  . Let's return to the equation . When x equals 0 or
  , the y evaluates to 1 because any base number raised to a power of zero is 1 when using the zero property of exponents.
This holds true for all forms of the exponential equation , such as or  . The y-intercept for these equations evaluates to (0, 1).
What is the y-intercept of equations in the form ? Let’s substitute into the general equation.
 , then
  . So, the y-intercept of the exponential equation of the form is at the point (0, ), because
  . We can deduce that the y-intercept depends on the value of in this case. For the general exponential equation , the y-intercept has the coordinates (0, ).
, the y-intercept has coordinates (0, 1) because for any accepted base. For equations in the form , the y-intercept has coordinates (0, ), for the same reasons above. Notice is the specific case when .
. We can deduce that the y-intercept depends on the value of in this case. For the general exponential equation , the y-intercept has the coordinates (0, ).
, the y-intercept has coordinates (0, 1) because for any accepted base. For equations in the form , the y-intercept has coordinates (0, ), for the same reasons above. Notice is the specific case when .
Now that we can evaluate exponential functions, we can use this to plot points on a graph to visualize the exponential graphs. We already know that the y-intercept of the exponential equation is (0, ).
EXAMPLE
Graph the function.
| x | y = 2x | (x, y) |
|---|---|---|

|

|

|

|

|

|

|

|

|

|

|

|
graph.
EXAMPLE
Graph the function .
.
| x | y = 2x | (x, y) |
|---|---|---|

|

|

|
|
|

|

|
|
|

|
|
|
|
|

|
|
|

|

|
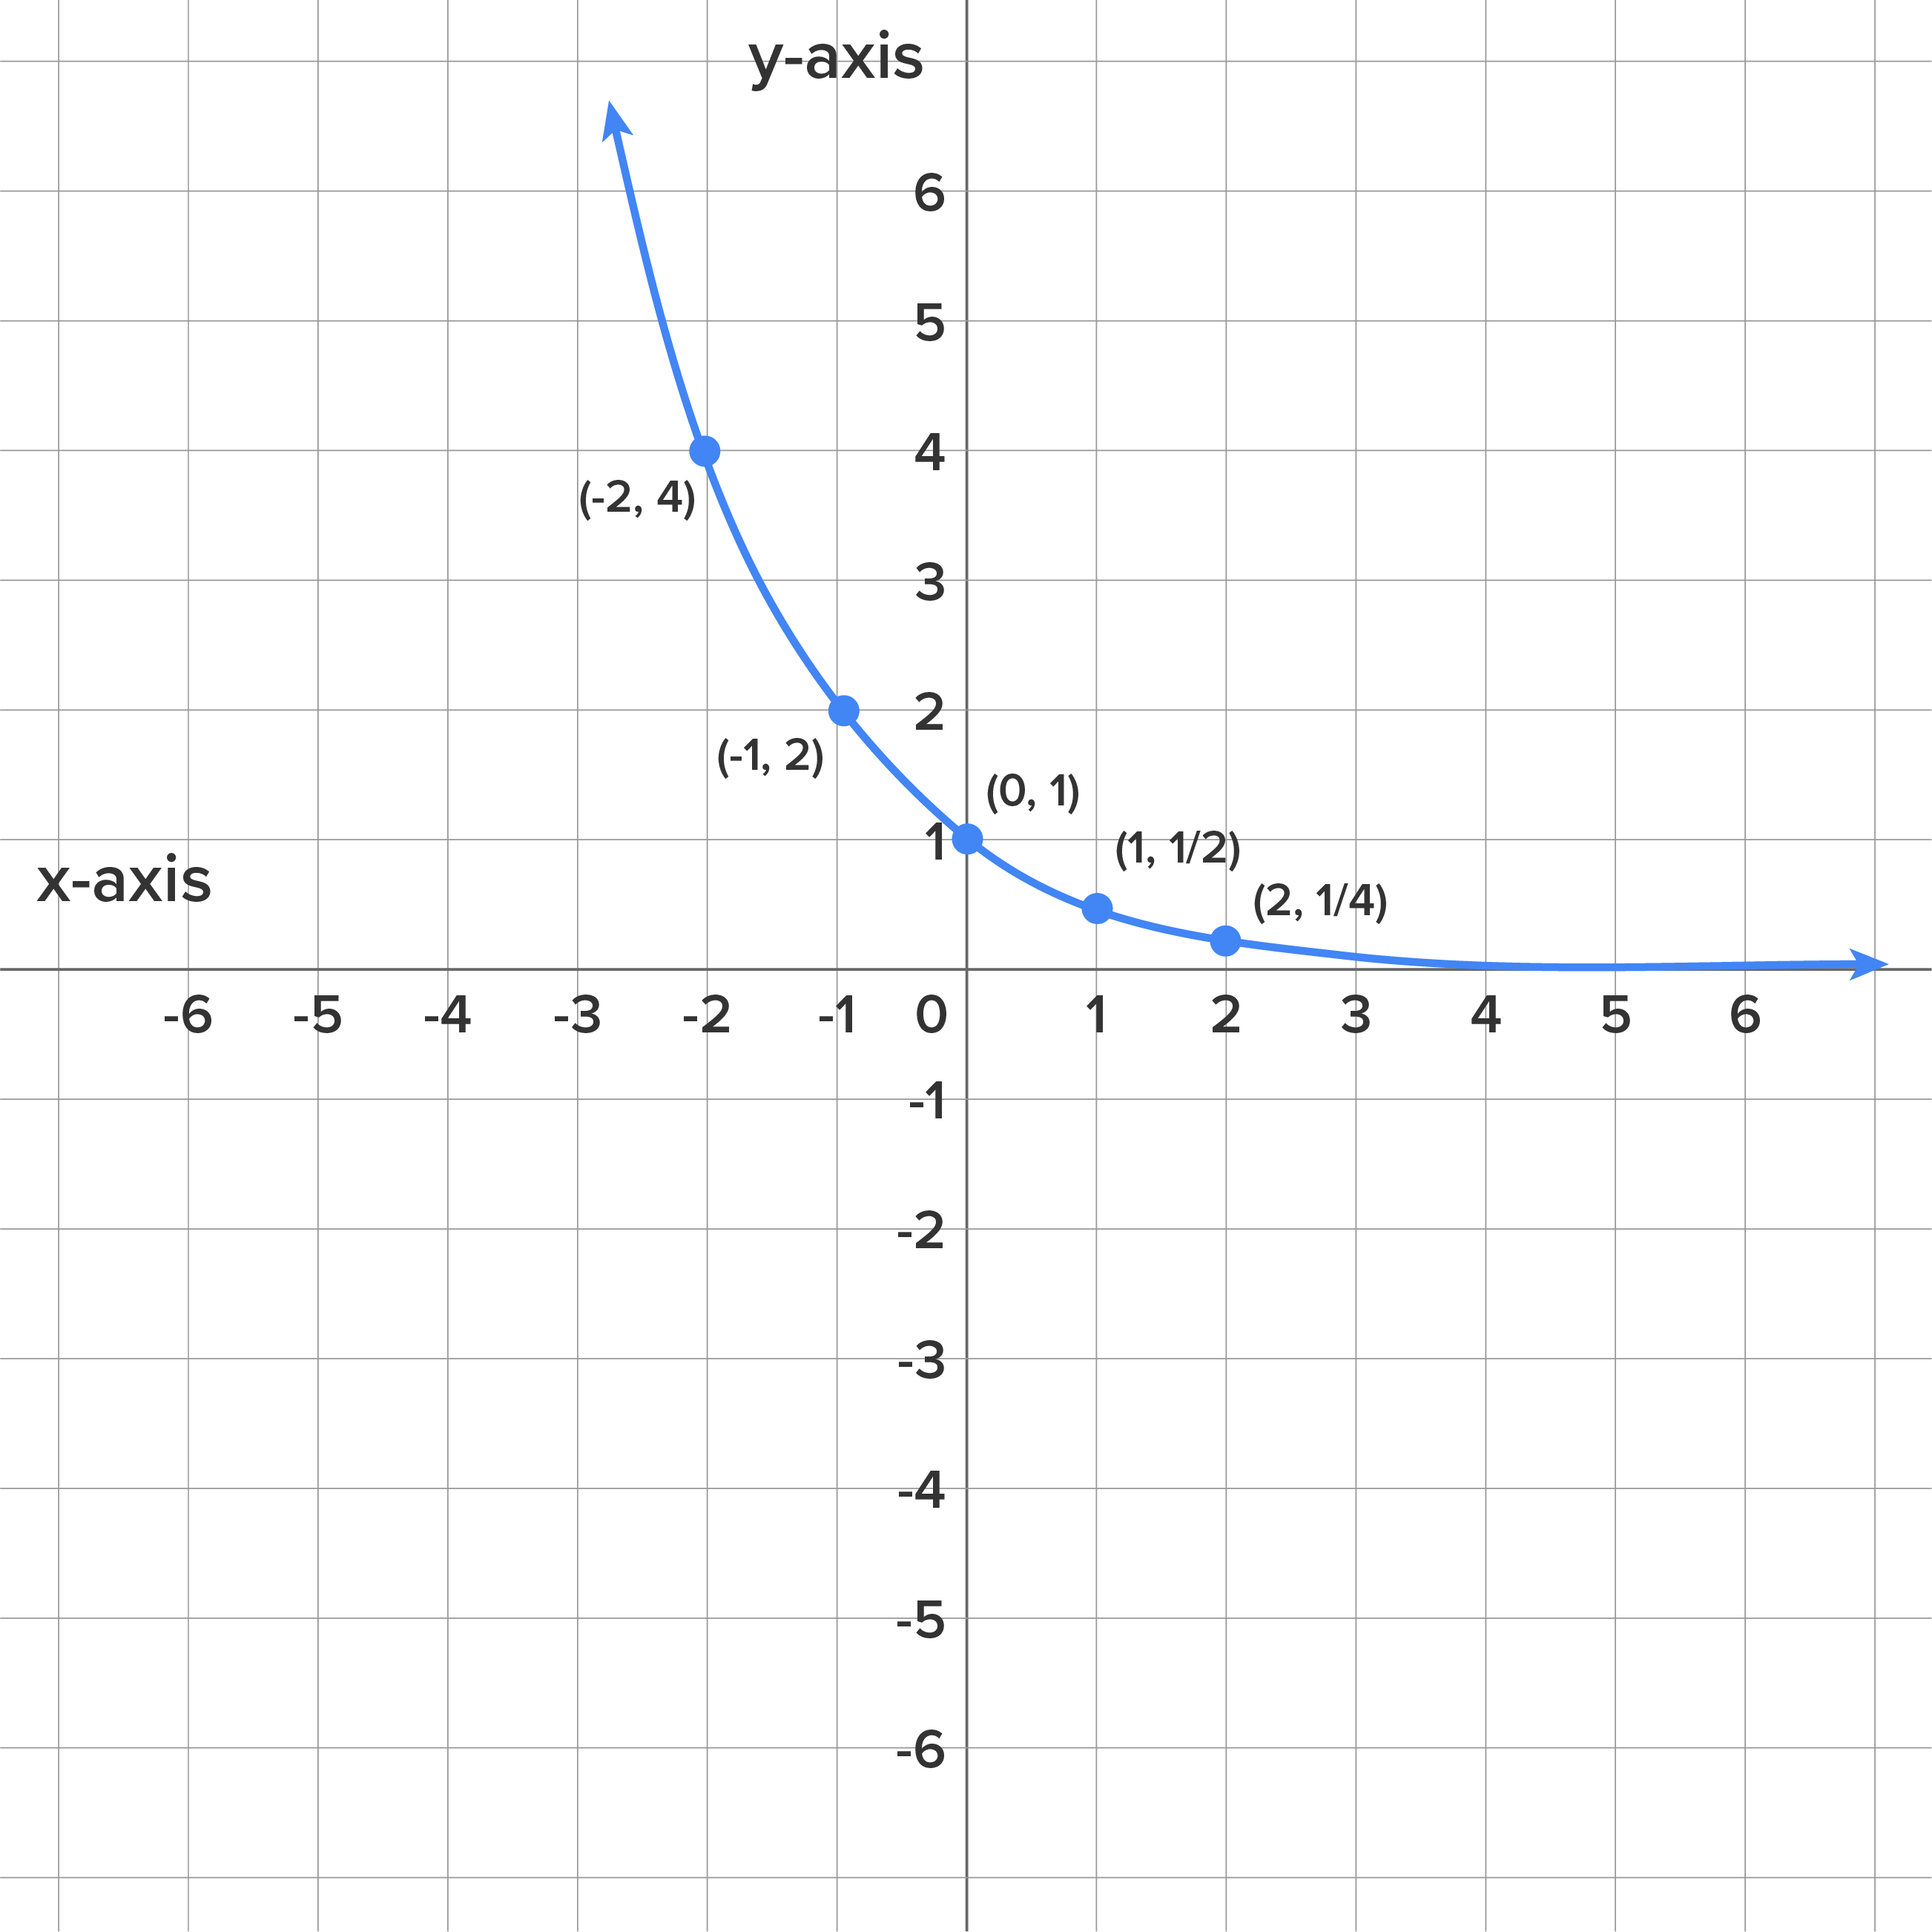
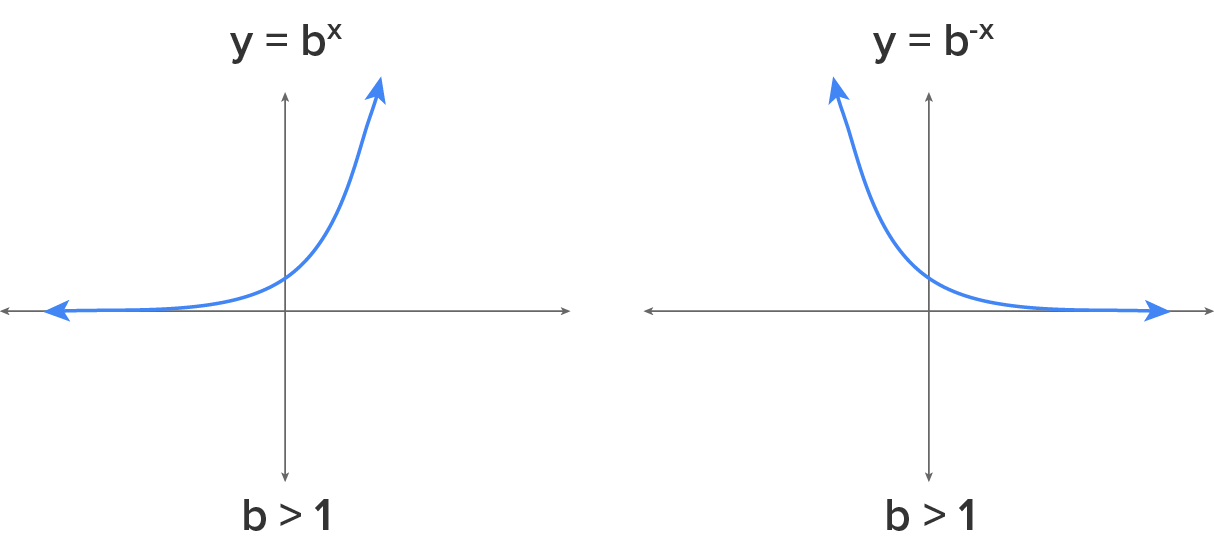
If we compare the graphs of and , we can see that it is the same graph reflected over the y-axis. Both graphs have the same y-intercept (0, 1). But, approaches positive infinity as x approaches positive infinity and approaches zero as x approaches negative infinity. For , it is the opposite. As x approaches positive infinity, approaches zero, and increases toward positive infinity as x approaches negative infinity.
As we saw with the graphs of and , a negative sign in the exponent can reflect the graph over the y-axis. If a and b are both positive, the graphs will generally look like:
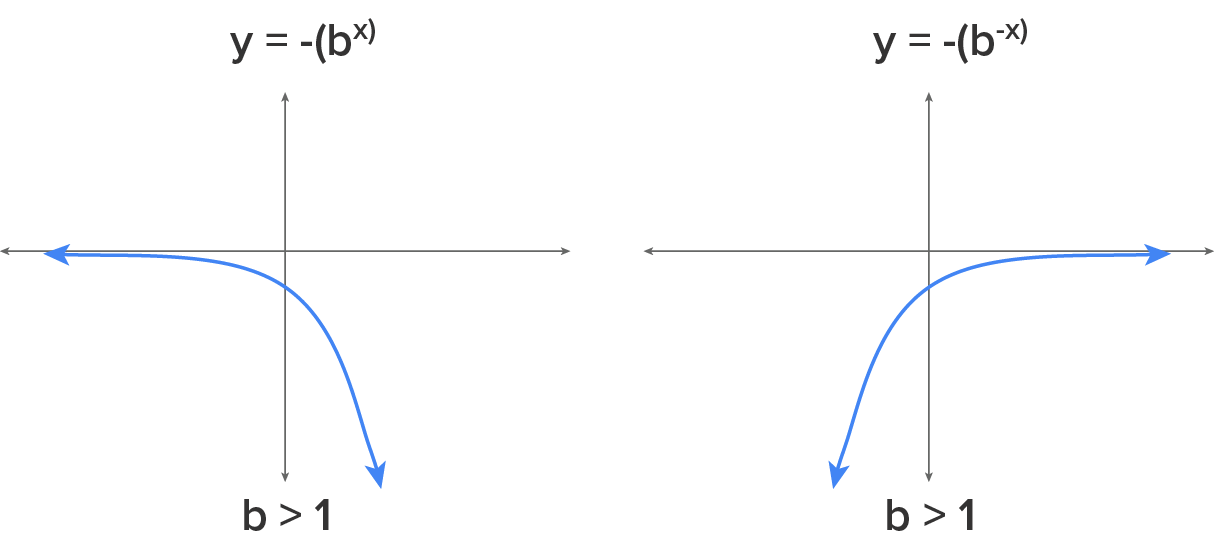
What happens to the graphs when is negative? If we reverse the signs of , we end up with different variations of the general exponential curve. The graph will reflect over the x-axis. If we look at the specific example of  , the y-intercept for this function is (0, -1) according to the property of the exponential function. Below are the general graphs of the exponential functions when is negative. These patterns are illustrated in the graphs below:
 , noting that this exponential equation can be written in the form of , if or . As x gets larger (approaches positive infinity), the value of y also increases and approaches positive infinity; on the other hand, as x gets smaller (approaches negative infinity), the value of y gets smaller as well, but it approaches zero, rather than negative infinity. You examined the domain and range of , noting that for exponential functions where and b are positive, the domain is all x values and the range is restricted to y values greater than zero. You learned that the y-intercept of an exponential equation in the form has coordinates (0, 1) because for any accepted base. For equations in the form , the y-intercept has coordinates (0, ). You practiced graphing exponential equations by selecting several values of x to evaluate in the function and plotting the points on the graph. Lastly, you learned about other features of the graph
  , such as when is negative and when the exponent is negative. A negative exponent reflects the graph over the y-axis, while a negative coefficient reflects the graph over the x-axis.
Source: THIS TUTORIAL WAS AUTHORED BY SOPHIA LEARNING. PLEASE SEE OUR TERMS OF USE.