Table of Contents |
To learn more about the graph of the equation  , let's look at a specific case.
EXAMPLE
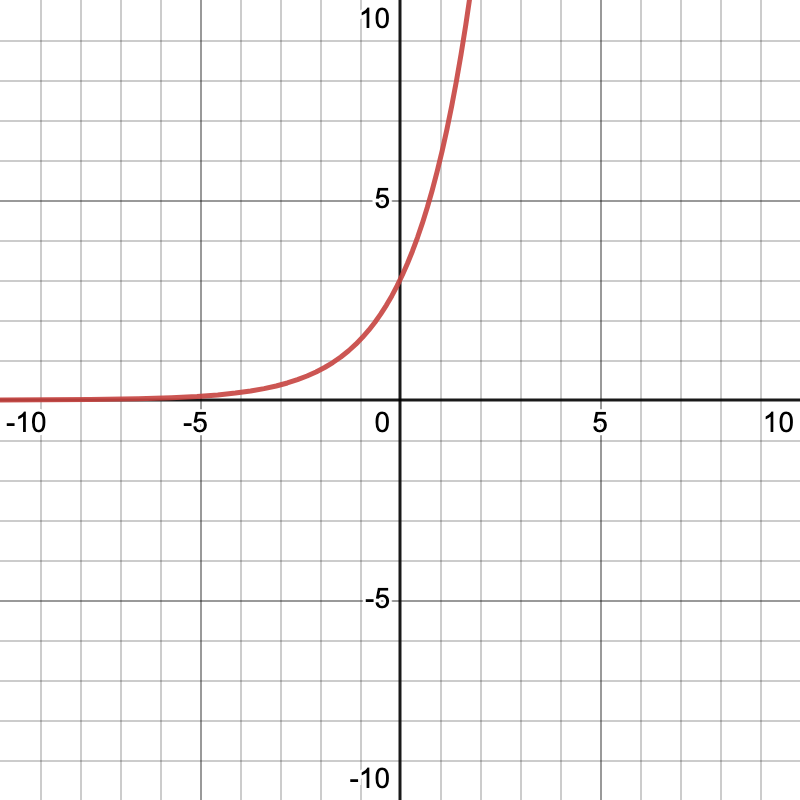
Below is a sketch of the graph . Notice that the base b to the exponential expression is 2, and there is an implied scalar multiplier of 1 in front of this expression, which would be the a in the equation:
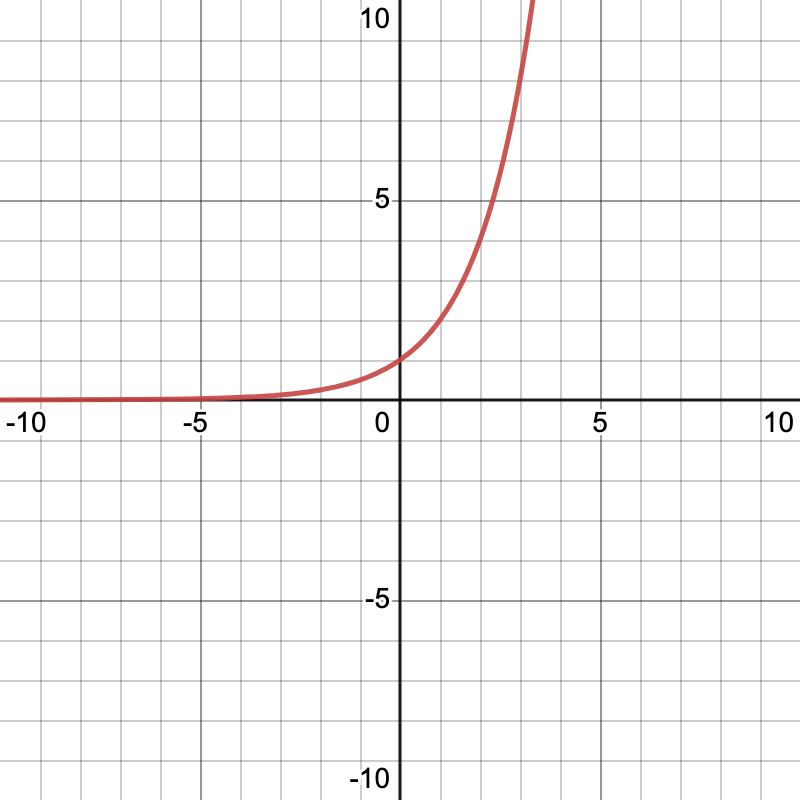
This behavior is characteristic of exponential functions with a base larger than 1. If the base was between 0 and 1, then the behavior would be much different: y would tend towards zero as x gets larger, but tend toward infinity as x gets smaller.
EXAMPLE
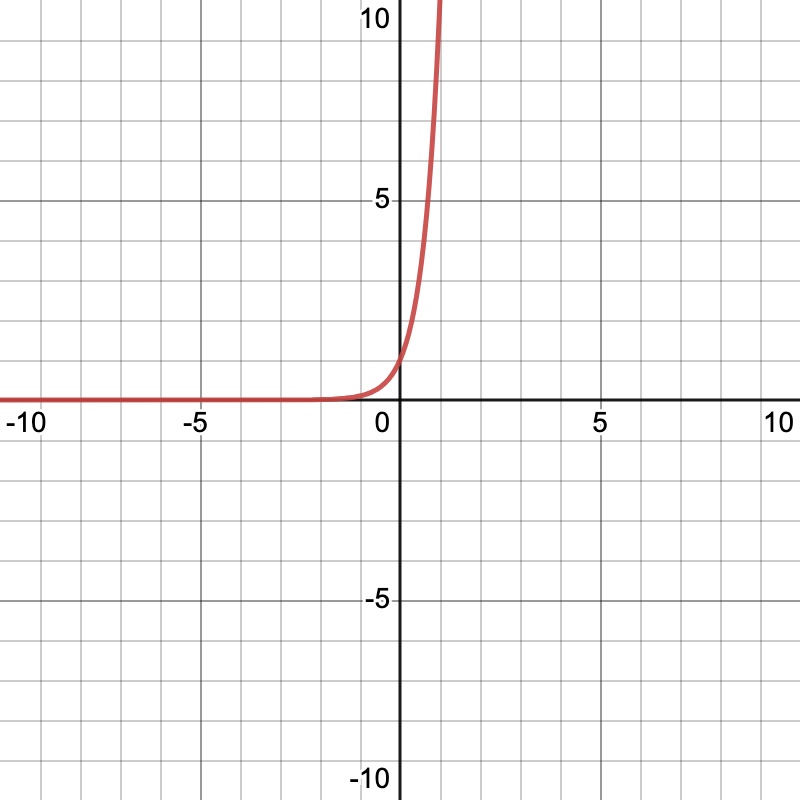
Consider the graph .
.
The y-intercept to any equation is the point on the graph at which the line or curve touches or crosses the y-axis. This always occurs when  .
.
EXAMPLE
Let's return to the equation. When x equals 0, y evaluates to 1, because any base number raised to a power of zero is 1. So we can say when x equals 0,  . That must mean this also holds true for the equation from the second example above.
For the equation  , the y-intercept is at the point (0, 1) because when x equals 0, y equals 1.
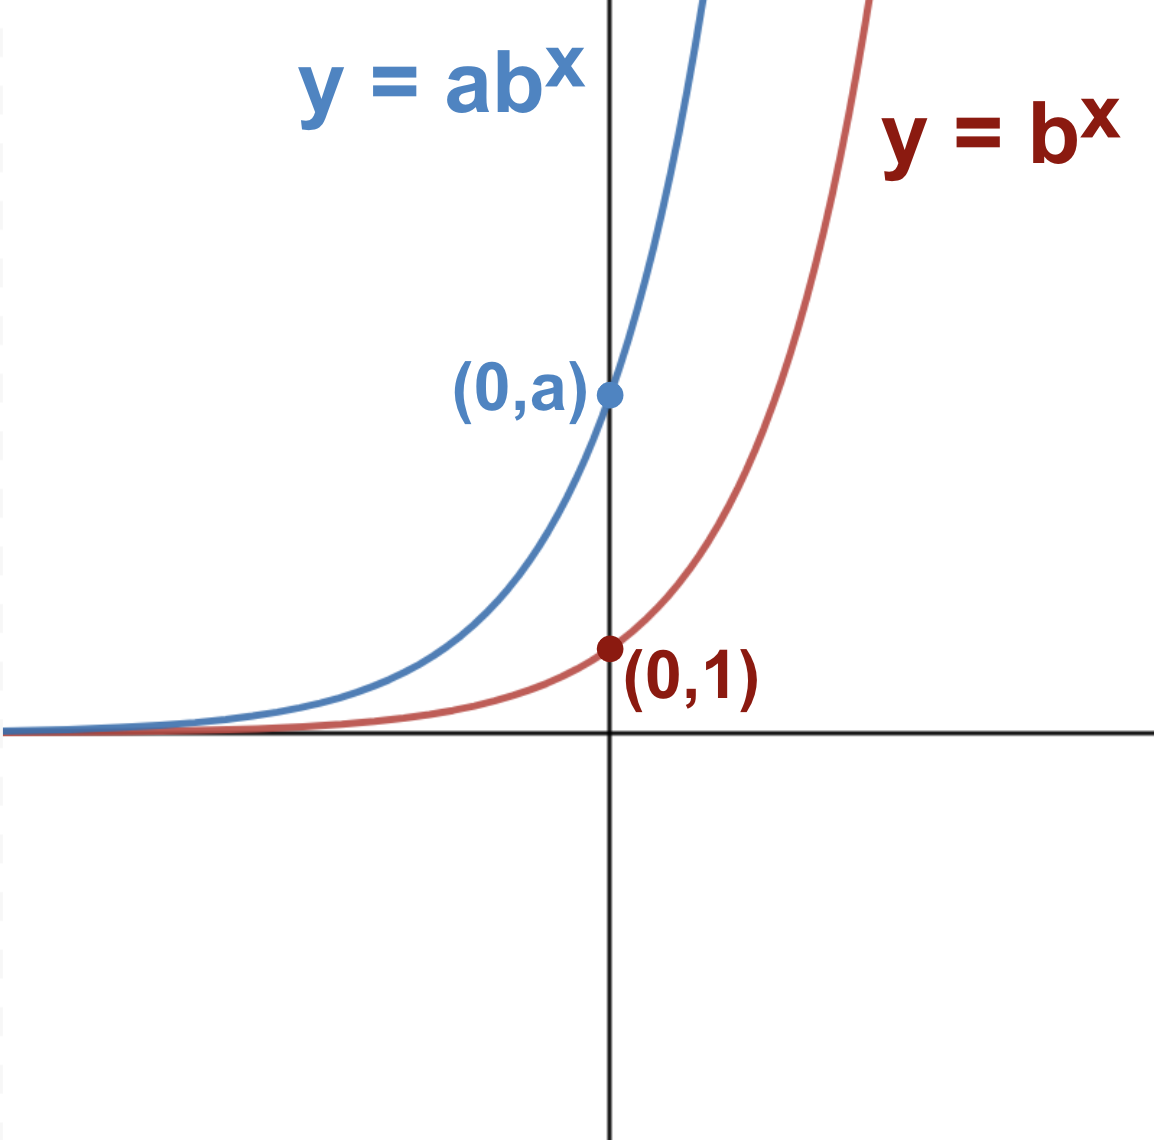
But what about the y-intercept of equations in the form ? We already know that  evaluates to 1 when x equals 0 for any base. We can deduce that the y-intercept depends on the value of
  in this case.
For the general exponential equation , the y-intercept has the coordinates 
, the y-intercept has coordinates (0, 1). , the y-intercept has coordinates
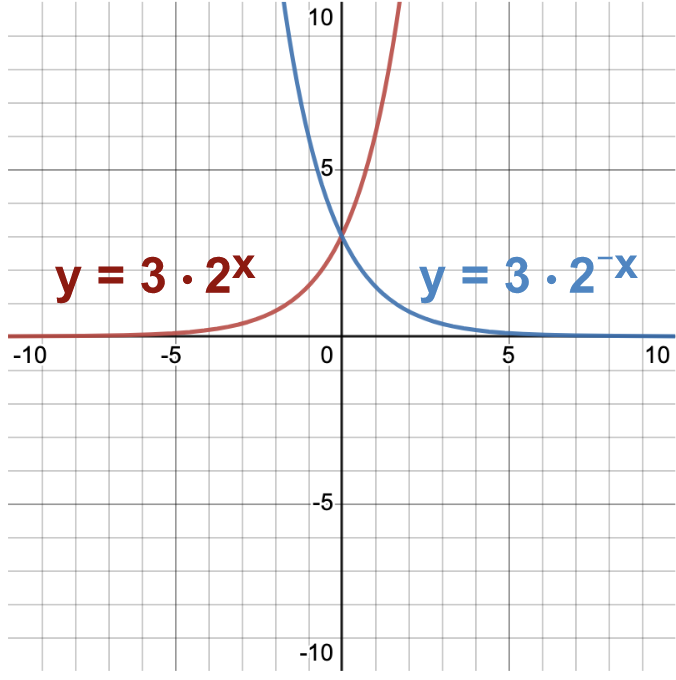
The general exponential equation has a positive and a positive x. If we reverse the signs of and x in the general exponential equation, we end up with different variations of the general exponential curve. More specifically, these are reflections about either the x- or y-axes or perhaps both, if the signs of both and x are reversed. These patterns are illustrated in the graphs below:
Let's look at the characteristics of each case.
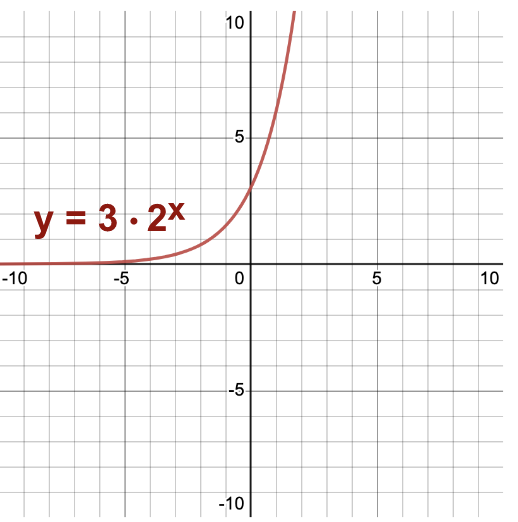
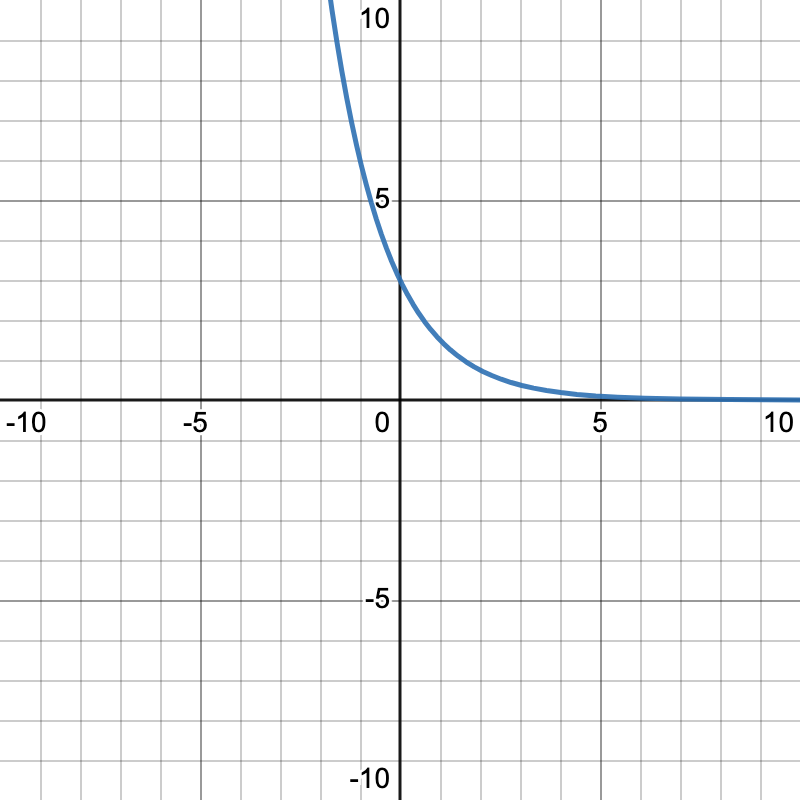
Having a positive and a positive exponent is the general exponential equation:
 . In this graph, as x is tending toward positive infinity, y goes to positive infinity, and as x goes to negative infinity, y approaches 0.
Let's take a further look into the next comparison of having a positive or negative exponent, but still having a positive 

 . A similar equation to , but this equation has a negative exponent. We can see that since negative x and positive x are opposite, their graphs have opposite effects. When our exponent is negative, as x approaches positive infinity, now y is approaching 0, and as x is approaching negative infinity, then our y is approaching positive infinity.
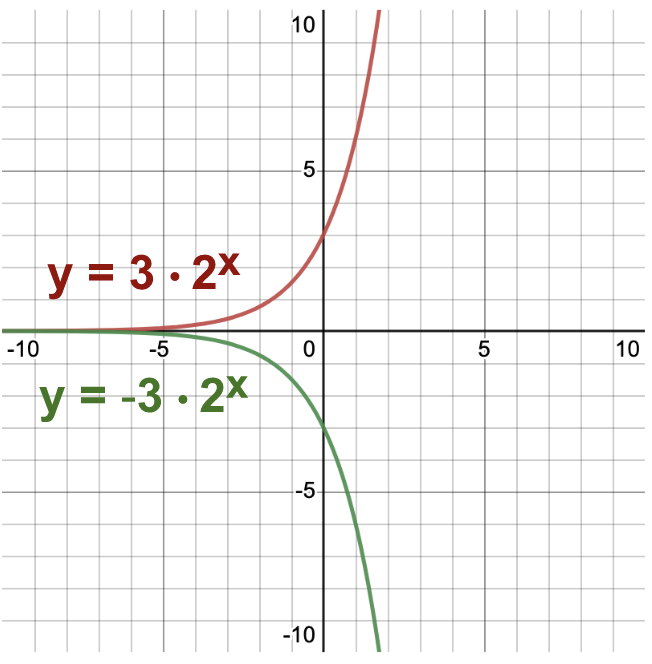
The next characteristic we'll look at is comparing the equations and graphs of exponential equations when the value of  the number in front of the base, is positive or negative.
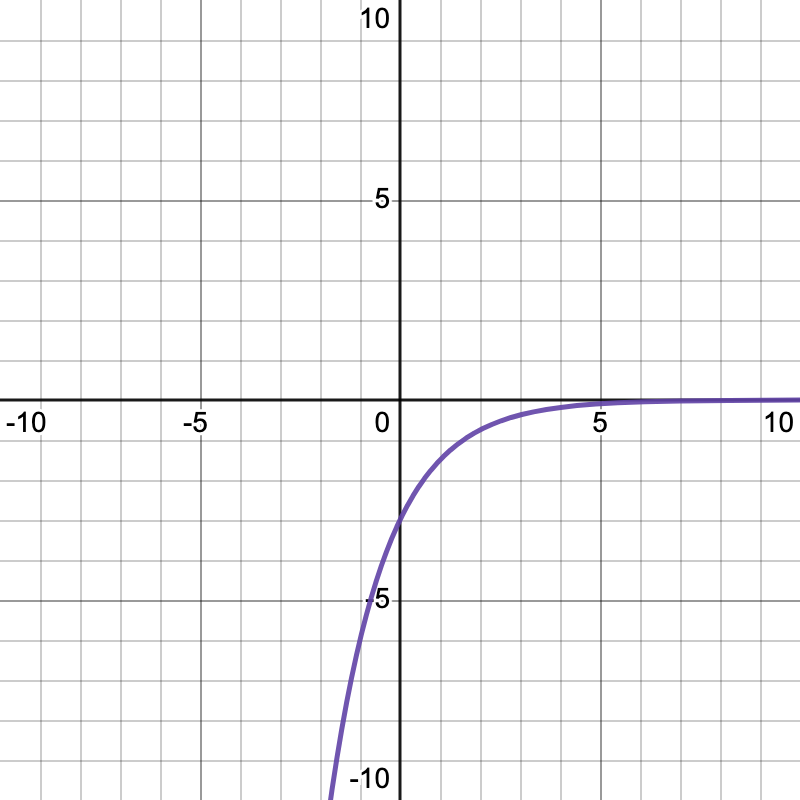
 . Let's compare that to the equation and graph of
  . In the graphs, we can see that it looks like the graph is reflected over the x-axis. When the value is negative, as the x-values approach positive infinity, the y-values approach negative infinity. It's decreasing instead of increasing. Also, notice that as the x-values approach negative infinity, the y-values are still approaching 0 as they were with a graph of our equation with a positive value.
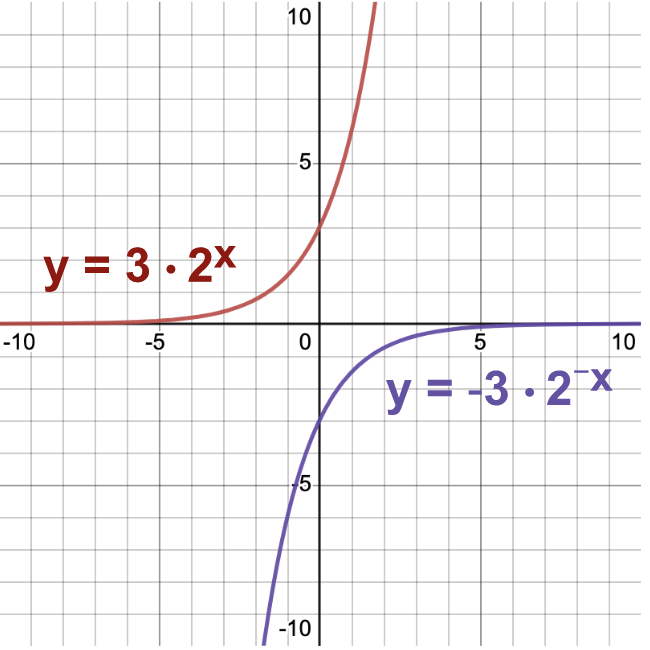
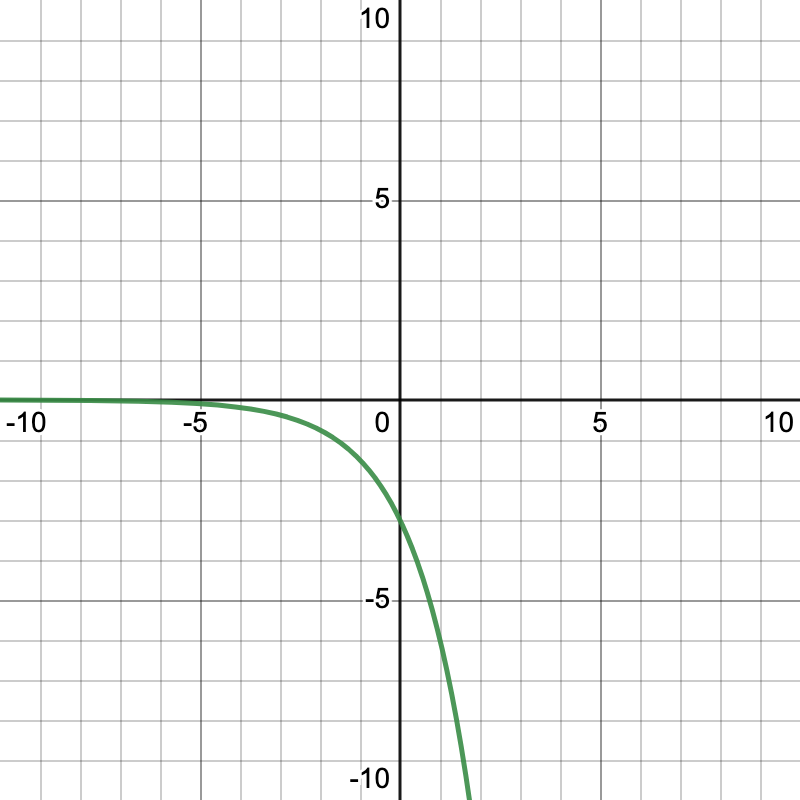
Finally let's look at the characteristics of exponential equations that have both a negative value and a negative exponent.
 and
and  . This second equation has both a negative value and a negative exponent. When the equation has a negative and negative exponent, as the x-values approach positive infinity, we see that the y-values approach 0, and as the x-values approach negative infinity, we see that the y-values are also approaching negative infinity.

|

|
|---|---|
|
|

|

|

|

|
|
|

|

|
 is an exponential equation. The graph of
  has certain characteristics. The y-intercept of the
  function is equal to the value of in the equation. Other features of the graph include looking at cases when is negative and when the exponent is negative. A negative exponent reflects the graph over the y-axis. while a negative coefficient reflects the graph over the x-axis.
Source: ADAPTED FROM "BEGINNING AND INTERMEDIATE ALGEBRA" BY TYLER WALLACE, AN OPEN SOURCE TEXTBOOK AVAILABLE AT www.wallace.ccfaculty.org/book/book.html. License: Creative Commons Attribution 3.0 Unported License