In this lesson, you will learn how to distinguish the difference between independent and dependent events and how this difference affects how the probabilities of joint events are computed. Specifically, this lesson will cover:
1. Dependent Events
From a previous tutorial, you learned that independent events are two or more events in which the occurrence of one event does not affect the probability of the other event happening. In contrast, dependent events do rely on each other. For dependent events, the occurrence of one event influences the probability of another event. Some examples that distinguish between independent and dependent events are given below.
Independent events:
- Owning a dog and growing your own herb garden.
- Paying off your mortgage early and owning a Chevy Cavalier.
- Winning the lottery and running out of milk.
Dependent events:
- Robbing a bank and going to jail.
- Not paying your power bill on time and having your power cut off.
- Boarding a plane and finding a good seat.
-
- Dependent Events
- Two or more events in which one event affects the probability of the other happening.
2. Using Probabilities to Determine Independent vs. Dependent Events
In a business context, many events are dependent. You can use probabilities to determine probabilistic independence or dependency of events.
If events A and B are independent, then knowing that B has occurred does not change the likelihood of A happening. In other words, the probability of A given B is the same as the probability of A alone. Mathematically, this is expressed as:

Similarly, if event A’s occurrence does not influence B, the probability of B given A is the same as the probability of B alone. Mathematically, this is expressed as:

Otherwise, the events are dependent.
When either of these equalities holds true, it means that the occurrence of one event has no impact on the probability of the other. They are essentially unrelated. This is the fundamental characteristic of independent events.
Let’s look at two examples of how we can detect if two events are independent or dependent using these probability formulas.
-
EXAMPLE
Suppose you are analyzing some data for an e-commerce company. They have provided you with a crosstabulation table of data related to the purchasing patterns of customers who purchased a product based on whether the customer received a marketing email. The crosstabulation table is below.
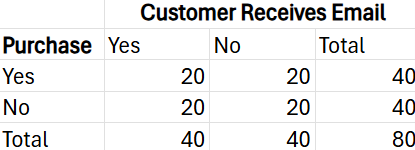
The company wants to determine if the customer receiving the email influences whether the customer purchases a product.
You define the two events:
-
Event A: Customer receives a marketing email.
-
Event B: Customer made a purchase.
You calculate:

And:

By calculating these probabilities and comparing

to

, we can determine if the marketing email campaign was effective in driving purchases. Since the probabilities are equal, you can report to the company that the email campaign had no impact on purchase behavior.
While this example demonstrates the concept of independence, it's important to consider other factors that might influence purchase behavior, such as product popularity, customer demographics, and overall market conditions.
Now, let's consider an example where the comparison of the conditional probability to the single event probability assists in detecting dependent events.
-
EXAMPLE
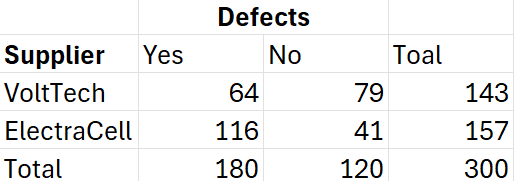
Quantum Power is a company that specializes in manufacturing batteries and power cells for electric vehicles and renewable energy storage. They source critical components from two suppliers: VoltTech Solutions and ElectraCell Solutions. Quantum Power is concerned about the quality of the components and wants to assess if there is a relationship between the suppliers and the number of defects in the components.
Quantum Power has asked you to determine if there is a dependency between the suppliers and the number of defects. A crosstabulation table that summarizes the data is provided below:
 VoltTech Supplier:
-
Event A: Component has a defect.
-
Event B: Component comes from VoltTech.
You will calculate:
-
: Probability that a component has a defect.
-
 : Probability that a component came from VoltTech.
-
: Probability that a product has a defect, given it came from VoltTech.


Since

, these events are dependent.
ElectraCell Supplier:
-
Event A: Component has a defect.
-
Event B: Component comes from ElectraCell.
You will calculate:
-
: Probability that a component has a defect.
-
: Probability that a component came from ElectraCell.
-
: Probability that a product has a defect, given it came from ElectraCell.


Since
, these events are dependent.
These probabilities give Quantum Power some insight into supplier issues. For example, since the

for ElectraCell was significantly higher than

it suggests that components from ElectraCell might have quality control issues and Quantum Power should investigate further.
The

for VoltTech was lower than
which indicates that VoltTech is providing components at a lower defect rate than the overall defect rate. Quantum Power should continue doing business with VoltTech!
-
A retail company that wants to optimize its marketing efforts. They collect data on customer demographics (age groups) and product preferences on 330 of their customers and summarize the information in the crosstabulation table below:
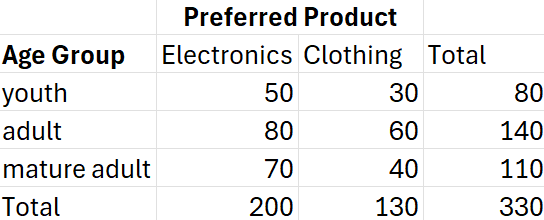
They ask you if there is a dependency between the adult age group and whether they prefer electronic products.
Solution: The events are dependent.
Let event A be that a customer prefers electronics, and let event B be the event that the customer is in the adult age group. You will calculate the following:
-
: Probability that customer prefers electronics.
-
: Probability that customer is in adult age group.
-
: Probability that a customer prefers electronics, given they are in the adult group.


Since
, these events are dependent.
-
You have data on customer purchases and whether they were exposed to a marketing campaign. You want to determine if the following events are independent or dependent using probability formulas in Excel:
-
Event A: Customer makes a purchase.
-
Event B: Customer is exposed to a marketing campaign.
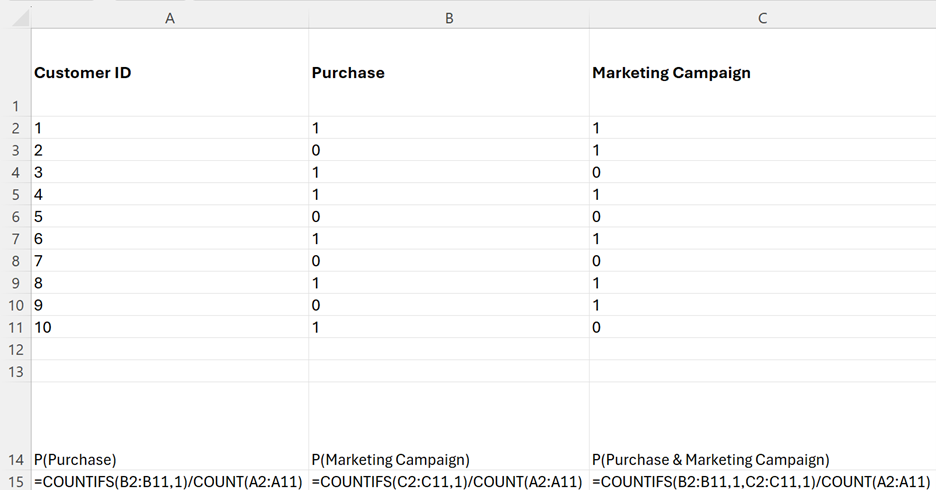
Below is a partial snapshot of data related to customer purchases and whether they were exposed to a marketing campaign. The data is in the
customer_purchase_marketing_campaign.xlsx Excel file.
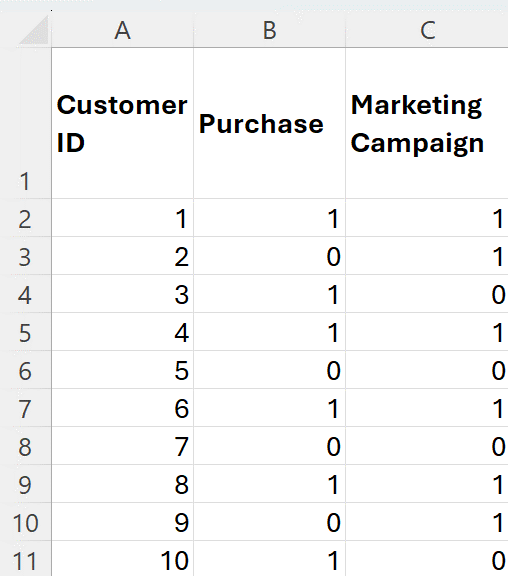
A description of each column is provided below.
-
CustomerID. Unique identifier for each customer.
-
Purchase. Indicator variable where 0 denotes no purchase and 1 denotes a purchase.
-
Marketing Campaign. Indicator variable where 0 denotes the customer was not exposed to the campaign and 1 denotes the customer was exposed to the campaign.
The events are dependent, based on the probability rules.
In Excel, you need to find the following probabilities:
-
 : Probability of a customer making a purchase.
-
 : Probability of a customer being exposed to the marketing campaign.
-
: Probability of a customer making a purchase and being exposed to the marketing campaign.
1. Find P(Purchase). In Excel, enter the following formula in cell A15:
=COUNTIFS(B2:B11,1)/COUNT(A2:A11)
The numerator in the Excel formula is counting the number of 1s in the
Purchase column, which is 6. The COUNTIFS() function is counting the number of cells in the range (B2:B11) that meet the criterion of being equal to 1. The denominator is counting the total number of customers, which is 10. The COUNT() function counts the number of non-empty cells in the range (A2:A11), that is, the
CustomerID column.
2. Find P(Marketing Campaign). In Excel, enter the following formula in cell B15:
=COUNTIFS(C2:C11,1)/COUNT(A2:A11)
The numerator in the Excel formula is counting the number of 1s in the Marketing Campaign column, which is 6. The denominator is counting the total number of customers, which is 10.
3. (Purchase ∩ Marketing Campaign) is the probability of a customer making a purchase and being exposed to the marketing campaign. To find this probability, enter the following formula in cell C15:
=COUNTIFS(B2:B11,1,C2:C11,1)/COUNT(A2:A11)
The numerator is counting the number of rows where both conditions are met:
- The value in the Purchase column (B2:B11) is 1.
- The value in the Marketing Campaign column (C2:C11) is 1.
The denominator is counting the total number of customers.
4. Determine if the events are independent or dependent.


Since

, that is

the events are not independent. They are dependent.
The Excel worksheet with the Excel formulas for the different probabilities computed is shown below.
3. Multiplication Rule
You assess whether two events are independent or dependent to choose the appropriate formula for calculating their joint probability. The multiplication rule varies based on whether the events are independent or dependent, guiding how you calculate their combined probability.
If two events, A and B, are independent, the probability that both events occur together is:

You simply multiply the probability of both events occurring to find the intersection of two independent events.
If two events are dependent, then the probability that both events occur together is:

-
The multiplication rule for dependent events comes from a probability formula you are already familiar with. In the last tutorial, you learned that the conditional probability of event A, given that event B has occurred, is:

You can rearrange the conditional probability formula to determine the multiplication rule for two dependent events.
Multiply by P(B) on both sides. This will cancel out the P(B) terms on the right-hand side of the equation.

Leaving you with:

This is the multiplication rule when two events are dependent.
To illustrate the use of the multiplicative rule, let’s return to an example from the last tutorial. The following crosstabulation table contains the churn status of customers by their contract type:
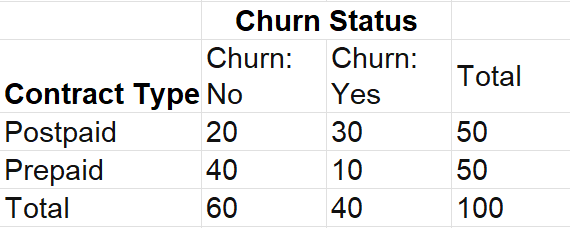
Let’s calculate the probability that a customer churns and has a Postpaid contract,  From the multiplicative rule, this is calculated as
  where event A is the event that a customer churns and event B is the event that a customer is in a Postpaid contract.
From the table, you can calculate:
-


Using the multiplication rule, you can find

This probability matches the probability shown for

in the numerator of the conditional probability that was found using the crosstabulation table. The multiplication rule is useful when you know the conditional probabilities but do not know the joint probabilities from the crosstabulation table.
-
You are assisting the inventory manager for an online electronics store in computing some probabilities. The store sells smartphones and smartwatches. Each week, customers visit the website and browse products. The following probabilities describe customer behavior:
Smartphone Behavior:
- Probability of a customer purchasing a smartphone: 40%
- Probability of a customer browsing smartphones: 70%
Smartwatch Behavior:
- Probability of a customer purchasing a smartwatch: 25%
- Probability of a customer browsing smartwatches: 60%
Assumptions:
- The events (purchasing a smartphone and purchasing a smartwatch) are independent.
Find the following probability for the inventory manager:
-
A luxury car dealership is analyzing its sales data to understand customer behavior and improve marketing strategies. They have data on the number of customers who test-drove a car and the number of customers who purchased a car after a test drive.
- Total number of customers who visited the dealership: 1000
- Number of customers who test-drove a car: 300
- Number of customers who purchased a car after a test drive: 150
Find the probability of a customer test-driving a car and purchasing it.15%
The events of test-driving a car and purchasing a car are dependent because the probability of purchasing the car is affected by whether the customer test-drove the car. Customers who test-drive a car are more likely to purchase a car compared to those who do not test-drive. So, when applying the multiplicative rule, the conditional probability must be considered.
Let event A be that the customer purchased the car and event B be the customer test-drove car.


In this lesson, you learned how to distinguish between independent and dependent events and how this distinction affects the calculation of probabilities for joint events. You explored the concept of dependent events and how probabilities can be used to determine whether events are independent or dependent. The multiplication rule was introduced to help calculate joint probabilities. You applied this knowledge through an example involving Quantum Power, a company that manufactures batteries. In the example, you assessed whether there was a relationship between the suppliers, VoltTech Solutions and ElectraCell Solutions, and the number of defects in the components they provided.
 where event A is the customer browses smartphones and event B is the customer purchases a smartwatch.
