Use Sophia to knock out your gen-ed requirements quickly and affordably. Learn more
×

Functions Defined by Graphs and Tables of Values

Author: Sophia

what's covered
In this lesson, you will see how functions can be represented with graphs and tables (not only by equations). Specifically, this lesson will cover:

Table of Contents

1. Functions Represented by Tables

Consider the table shown below, which shows the revenue (in thousands of dollars) earned by a particular company after each year for their first 8 years of business.

Year 1 2 3 4 5 6 7 8
Revenue 61 70.5 82 91 112.5 107.5 118.5 134.5

Thinking of the input-output relationship, it makes the most sense to label the year as input and the revenue as output. Since each input (1, 2, ..., 8) corresponds to one output, this table of values represents a function where the input is “Year” and the output is “Revenue.” We say that this defines revenue as a function of the year.


2. Functions Represented by Graphs

2a. From Tables of Values

Let’s take the table of values from the first section and graph the points:

A graph providing data on the annual revenue of a company for the first 8 years. The horizontal axis represents years ranging from 1 to 9 at intervals of 1 year. The vertical axis represents the revenue in thousands of dollars ranging from 0 to 150 at intervals of 50. The points plotted for the revenue in Years 1, 2, 3, 4, 5, 6, 7, and 8 are approximately 61, 70.5, 82, 91, 112.5, 107.5, and 134.5, respectively.

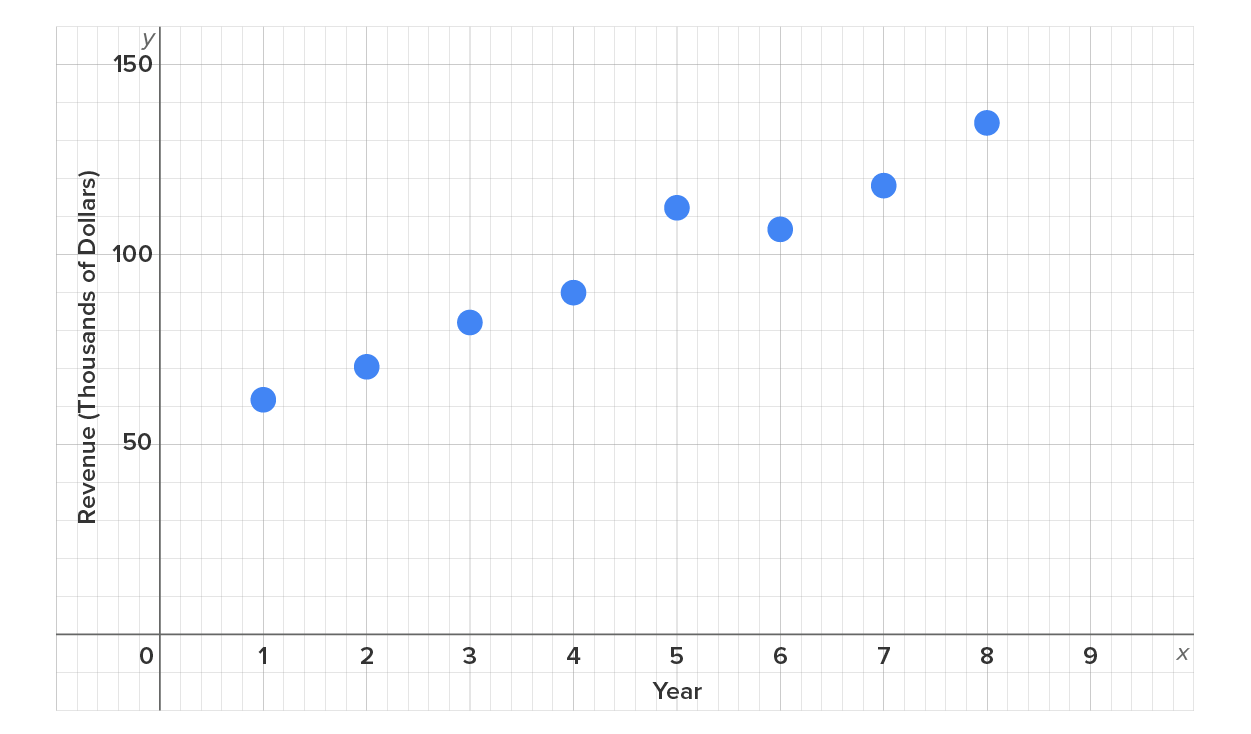
One could say that the graph looks almost linear or roughly linear, but not perfectly linear.

2b. From Equations

Consider the function f open parentheses x close parentheses equals 2 x plus 3. The following table of values shows some input-output pairs for this function:

x -2 -1 0 1 2 3 4
bold italic f open parentheses bold x close parentheses -1 1 3 5 7 9 11

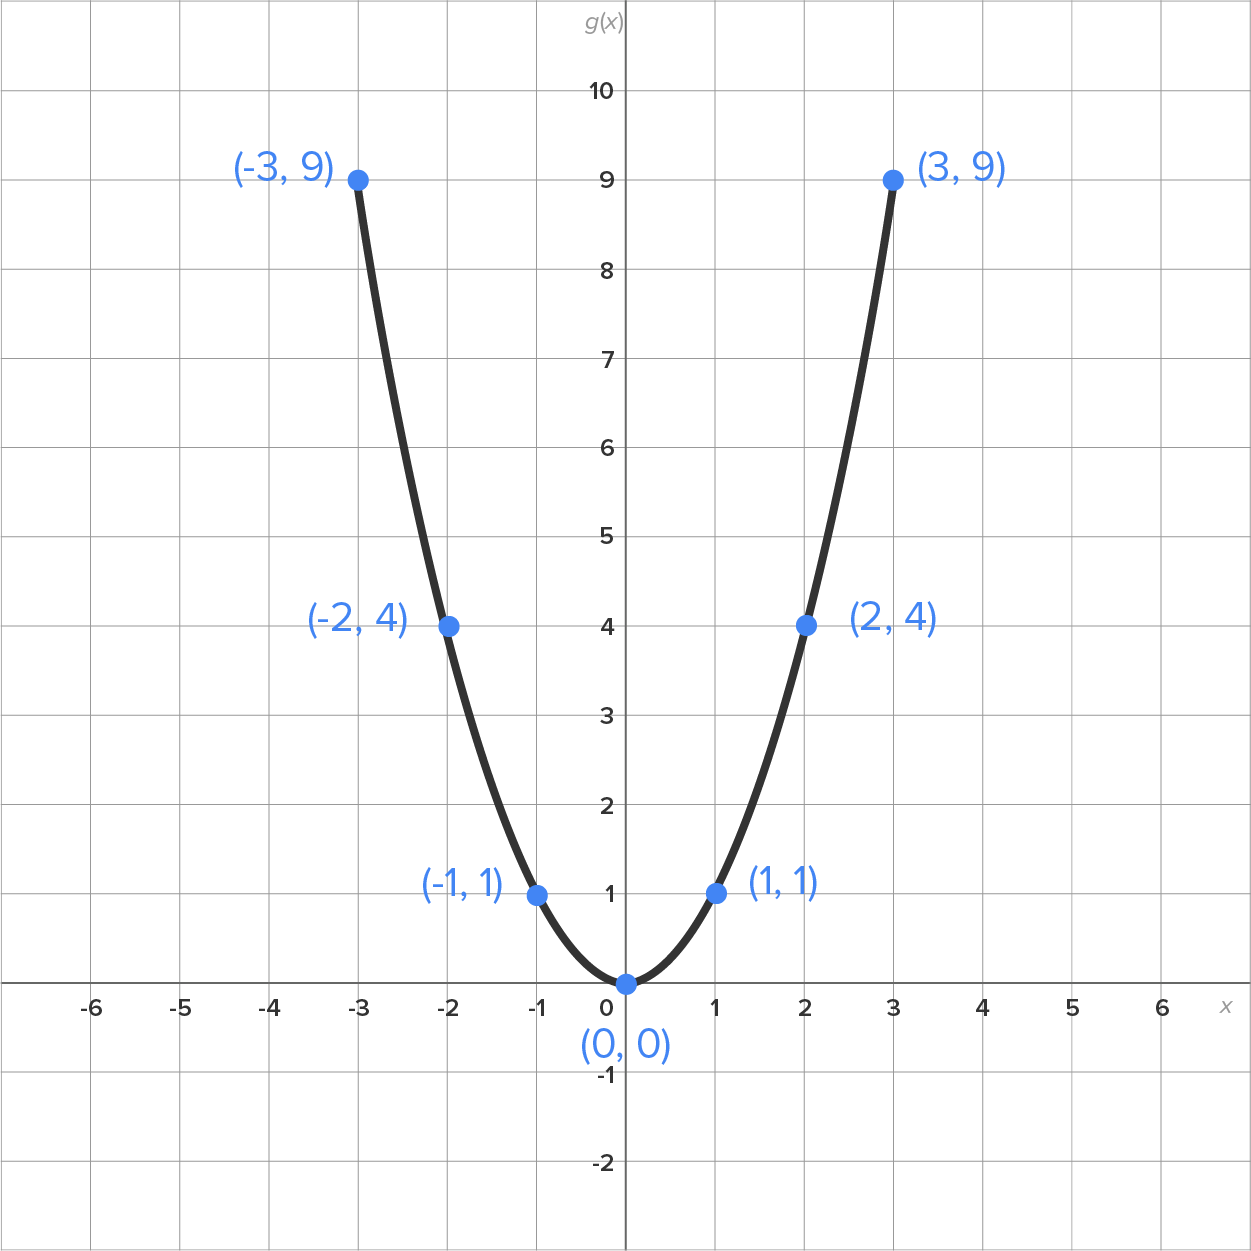
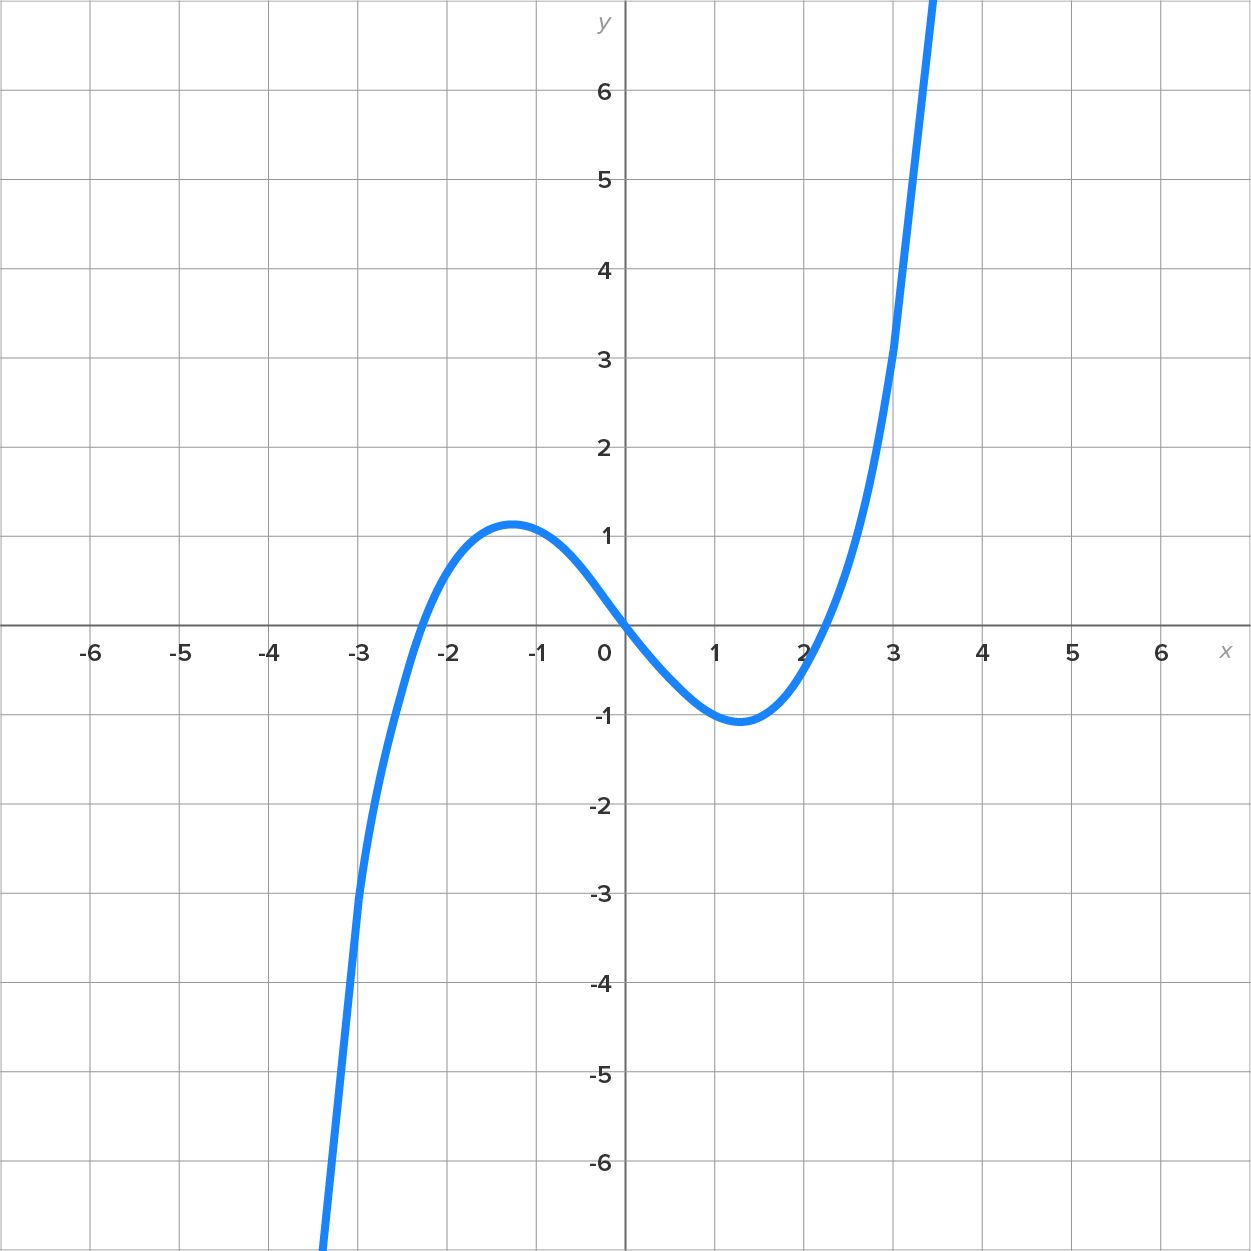
Now we plot the ordered pairs to form the graph (remember, we connect the dots since there are many other points on the graph; we just chose easy ones).

A graph with an x-axis and a y-axis ranging from −12 to 12. A line slants upward from left to right, passing through six marked points with the coordinates (–2, –1), (–1,1), (0,3), (1, 5), (2, 7), (3, 9), and (4, 11).

hint
Note that this looks exactly like the graph of y equals 2 x plus 3
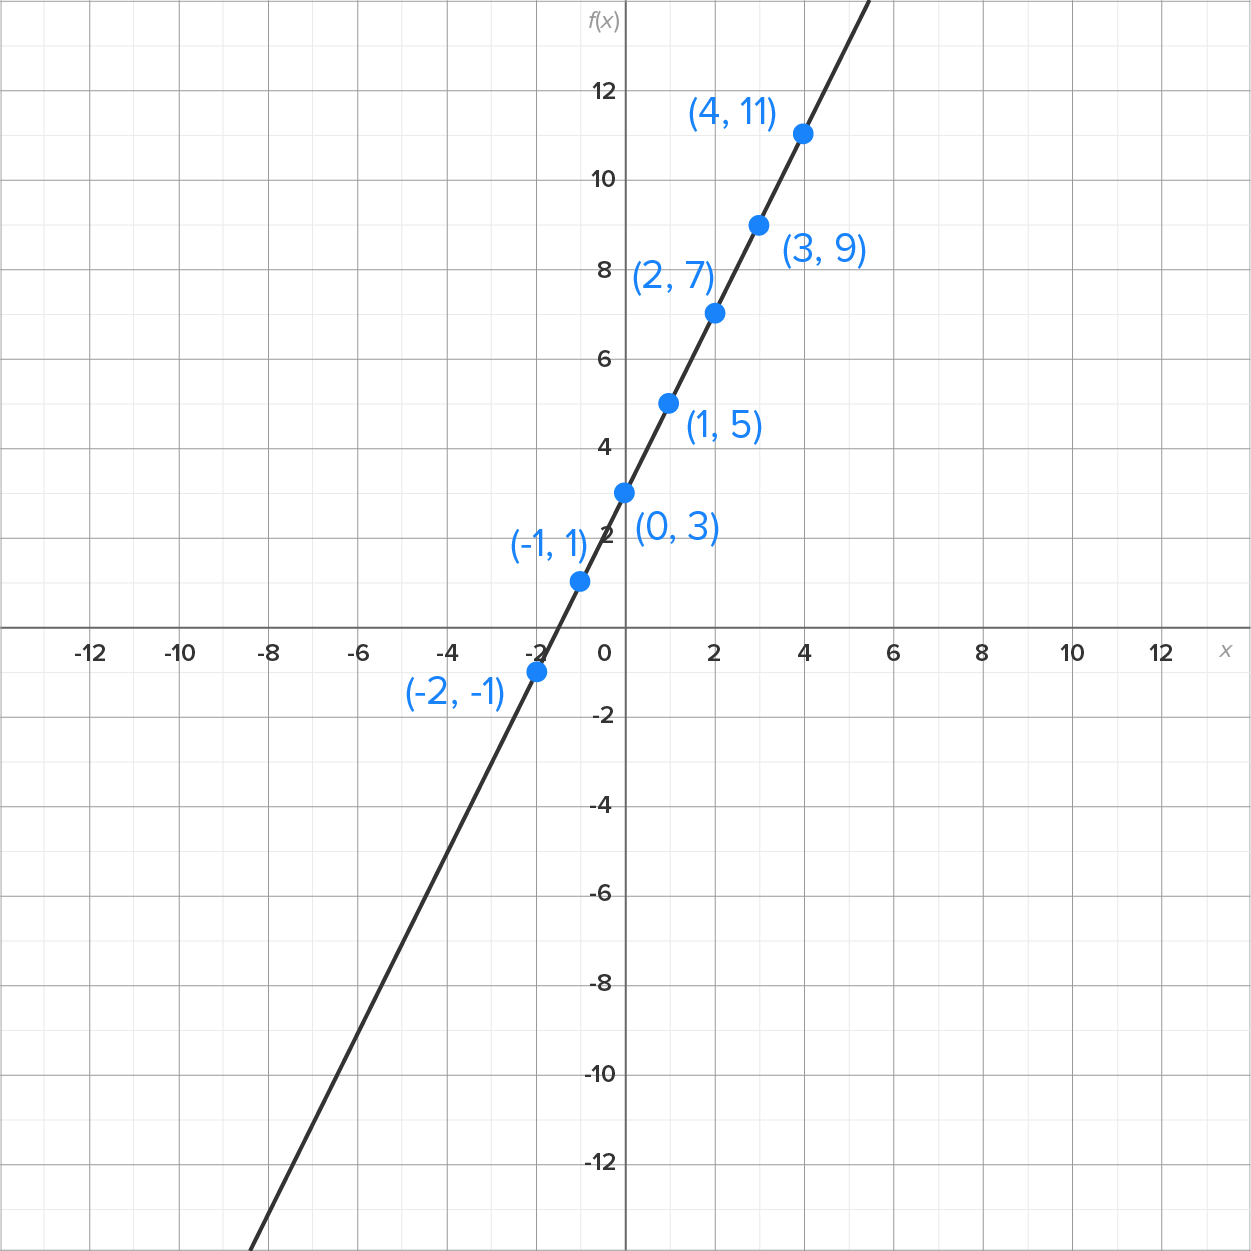
. In a previous lesson, you learned that f open parentheses x close parentheses is simply a replacement for y.

Thus, graphing a function in the form “f open parentheses x close parentheses equals horizontal ellipsis” is identical to graphing an equation of the form “y equals horizontal ellipsis”.


3. Using a Graph to Determine if It Represents a Function

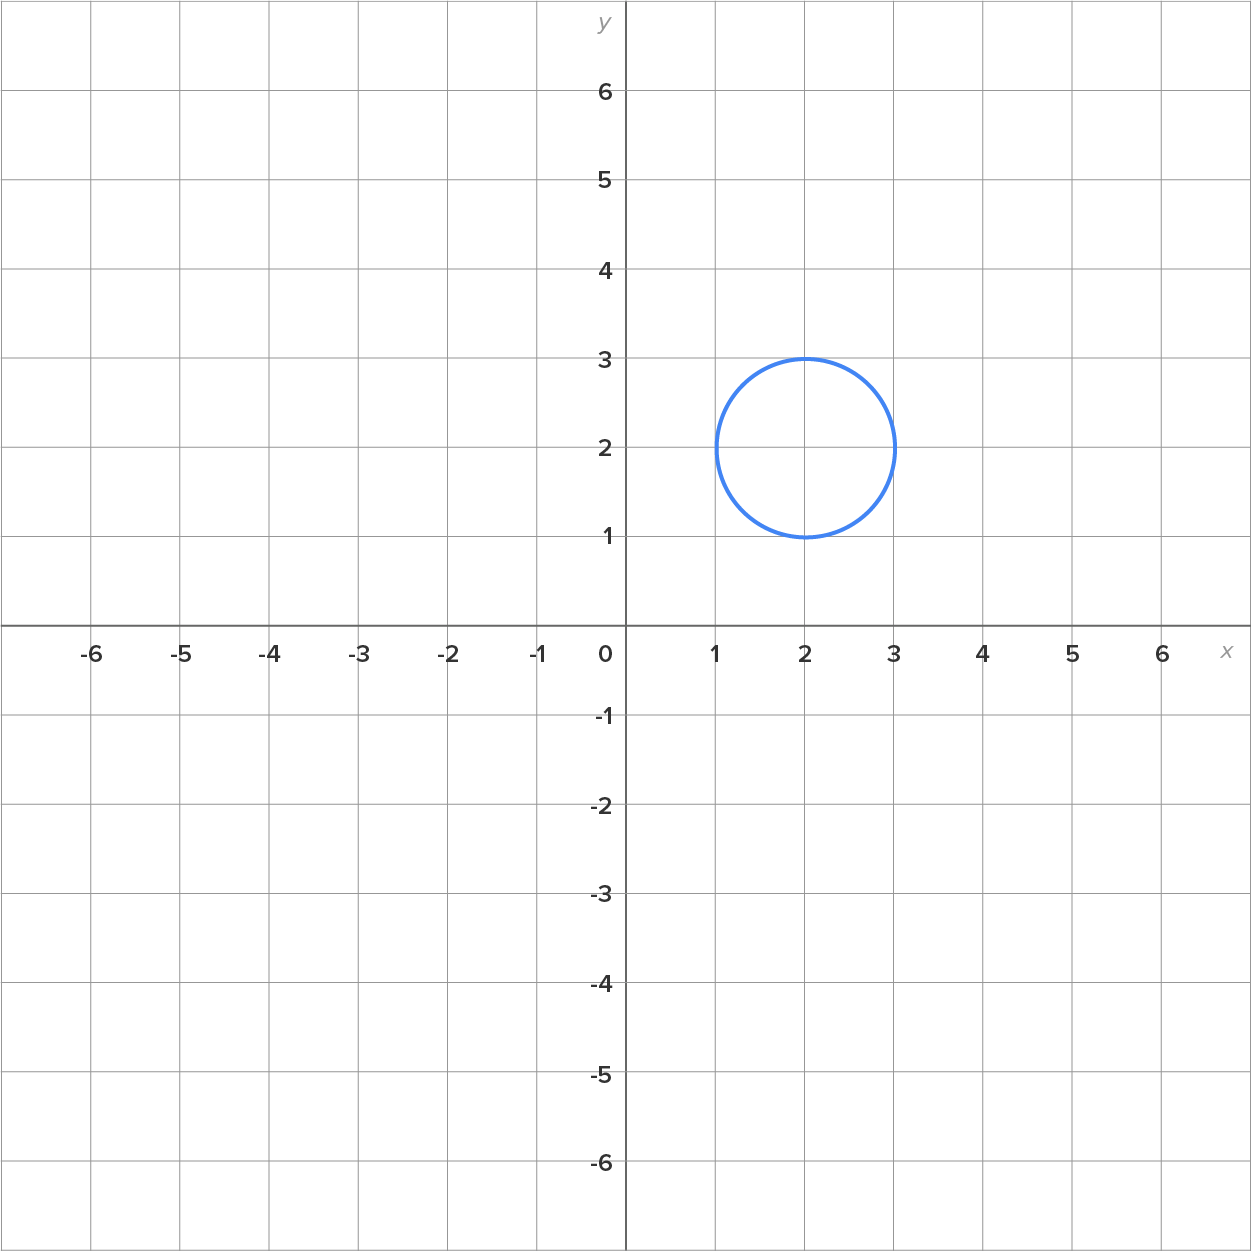
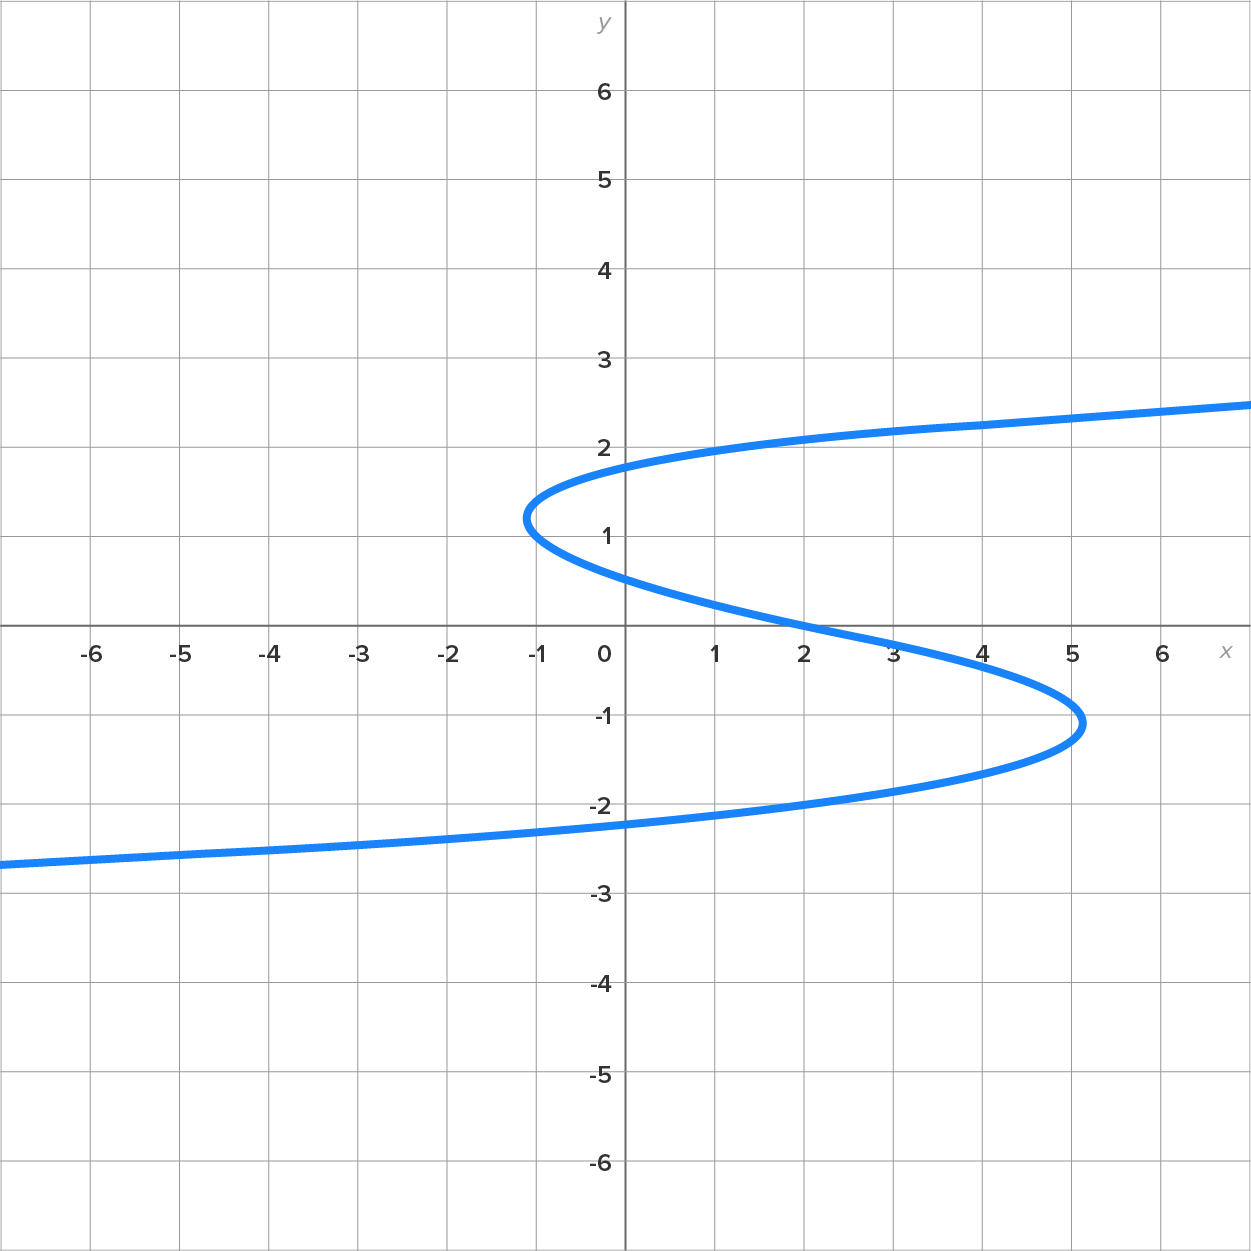
Something to think about: what would a graph look like if it wasn’t a function?

Remember that if there is an input that corresponds to two or more outputs, then the relationship is not a function.

The equations f open parentheses x close parentheses equals 2 x plus 3 and g open parentheses x close parentheses equals x squared are both functions, as shown in the last two examples.

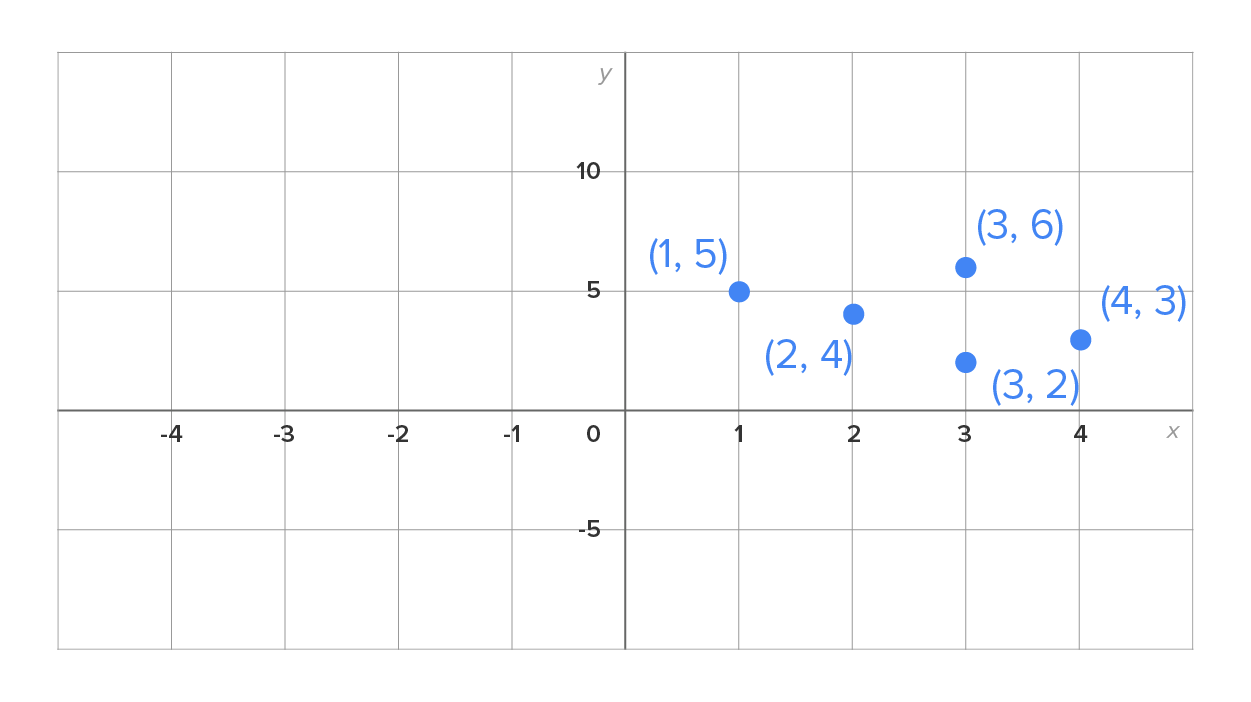
Now consider this table of values, and the graph of the ordered pairs to its right:

x y
1 5
2 4
3 6
3 2
4 3

A graph with an x-axis ranging from –4 to 4 and a y-axis ranging from –5 to 10. There are five marked points in the first quadrant with the coordinates (1, 5), (2, 4), (3, 2), (3, 6), and (4, 3).

From the table of values, we can see that this is not a function, since x equals 3 corresponds to two different outputs, y equals 6 and y equals 2.

On the graph, let’s pay attention to the points open parentheses 3 comma space 2 close parentheses and open parentheses 3 comma space 6 close parentheses. Notice that these points could be connected by a vertical line. This only happens when there are two points with the same x-coordinate. Thus, we have a simple test to determine whether or not a graph defines y as a function of x.

key concept
The Vertical Line Test
Given a graph, if a vertical line can be drawn and intersects more than once with the graph, then the graph does not define y as a function of x.

try it
Consider the following graphs and determine which of these graphs defines y as a function of x.

Graph 1
A graph with an x-axis and a y-axis ranging from –6 to 6. A circle with a radius of 1 unit is located in the first quadrant with its center at the coordinates (2, 2).

Graph 1: Function or Not a Function?
This is not a function. There exists a vertical line that passes through two points when drawn through the graph.

Graph 2
A graph with an x-axis and a y-axis ranging from –6 to 6. A curve extends through all four quadrants. It starts from the third quadrant, passing through the coordinates (–3, –3), and rises toward the second quadrant by crossing the negative x-axis between the points –3 and –2. The curve reaches a peak up to 1 unit before dipping into the fourth quadrant by 1 unit after crossing the origin. The curve then rises steeply in the first quadrant, crossing the x-axis between points 2 and 3, and continues upward, passing through the coordinates (3, 3).

Graph 2: Function or Not a Function?
This is a function. Any vertical line will pass through one point on this graph.

Graph 3
A graph of a curve that starts in the third quadrant, passes into the 4th quadrant around the point (0, -2), continues to the point (5, -1), then curves upward to the left, passing through the y-axis at the point (0, 0.5), continuing into the second quadrant until reaching the point (-1, 1.5), then curving upward to the right, passing through the point (0, 2) and continuing a slow rise in the first quadrant.

Graph 3: Function or Not a Function?
This is not a function. There are some places where a vertical line will pass through three points on the graph.

summary
In this lesson, you learned about the various ways that functions can be represented, including functions represented by tables and functions represented by graphs, including from tables of values and from equations. Understanding that if there is an input that corresponds to two or more outputs, then the relationship is not a function, you learned how to use a graph to determine if it represents a function, by utilizing the vertical line test: given a graph, if a vertical line can be drawn and intersects more than once with the graph, then the graph does not define y as a function of x.

Source: THIS TUTORIAL HAS BEEN ADAPTED FROM CHAPTER 0 OF "CONTEMPORARY CALCULUS" BY DALE HOFFMAN. ACCESS FOR FREE AT WWW.CONTEMPORARYCALCULUS.COM. LICENSE: CREATIVE COMMONS ATTRIBUTION 3.0 UNITED STATES.