In this lesson, you will calculate and interpret three common measures of forecast accuracy. Specifically, this lesson will cover:
1. Introduction to Forecasting Accuracy
Forecasting accuracy is all about how close your predictions are to what actually happens. Imagine you are trying to guess the temperature for tomorrow. If you predict it will be 70°F and it turns out to be 70°F, your forecast is perfect. But if you predict 70°F and it is actually 80°F, your forecast is not very accurate.
Why is Forecasting Accuracy Important?
-
Better Decisions: Accurate forecasts help businesses make better decisions. For example, if a store can accurately predict how many customers will come in, they can stock the right amount of products.
-
Managing Risks: Knowing how accurate your forecasts are helps manage risks. If you know your predictions might be off, you can plan for that.
-
Evaluating Performance: Measuring how accurate your forecasts are helps you know which methods work best. This way, you can choose the best way to make future predictions.
There are three common measures used to assess forecast accuracy:
-
Mean Squared Error (MSE): This measures the average of the squared differences between what you predicted and what actually happened. It’s useful when you want to penalize big mistakes more than small ones.
-
Mean Absolute Error (MAE): This measures the average of the absolute differences between your predictions and the actual values. It treats all mistakes equally.
-
Mean Absolute Percentage Error (MAPE): This measures the average of the absolute percentage differences between your predictions and the actual values. It’s helpful when you want to understand the error in percentage terms.
You will learn about each of these measures and how to compute them in Python in the upcoming sections.
1a. Mean Squared Error (MSE)
As an introduction to Mean Squared Error (MSE), it is important to recall what an error is in the context of forecasting. An error is the difference between the actual value and the forecasted value. If you forecast that a stock price will be $50, but it turns out to be $52, the error is 
Earlier in the course, you referred to this difference between actual and predicted values as the residual or error. In a similar manner, forecast error is essentially the same as the residual, representing the discrepancy between the observed data points and the values predicted by your forecasting model.
Forecast error is defined as  where:
-
y is the observed (actual) data point
-
 is the forecasted value (the value predicted by your forecasting model)
Mean Squared Error (MSE) is a common measure used to evaluate the accuracy of a forecasting model. It calculates the average of the squared differences between the actual values and the predicted values. By squaring the differences, MSE gives more weight to larger errors, making it particularly useful when large errors are especially undesirable.
The formula for MSE is  where:
-
n is the total number of observations
-
y is the observed (actual) data point
-
is the forecasted value (the value predicted by your forecasting model)
-
 denotes the sum over all the observations 1 to n
In simple terms, MSE is the average of the squared errors. Just like how an average is the sum of values divided by the number of values, the MSE is the sum of squared errors divided by the number of data points. This makes MSE a measure of the average squared error, providing a single value that represents the overall accuracy of the forecasts.
Now that you understand what MSE is and how it helps us measure forecasting accuracy, let's see how we can calculate MSE using Python with a practical example.
-
EXAMPLE
To illustrate the application of MSE in evaluating forecast accuracy, let's examine a dataset containing actual stock prices and their corresponding forecasted values over a five-day period.
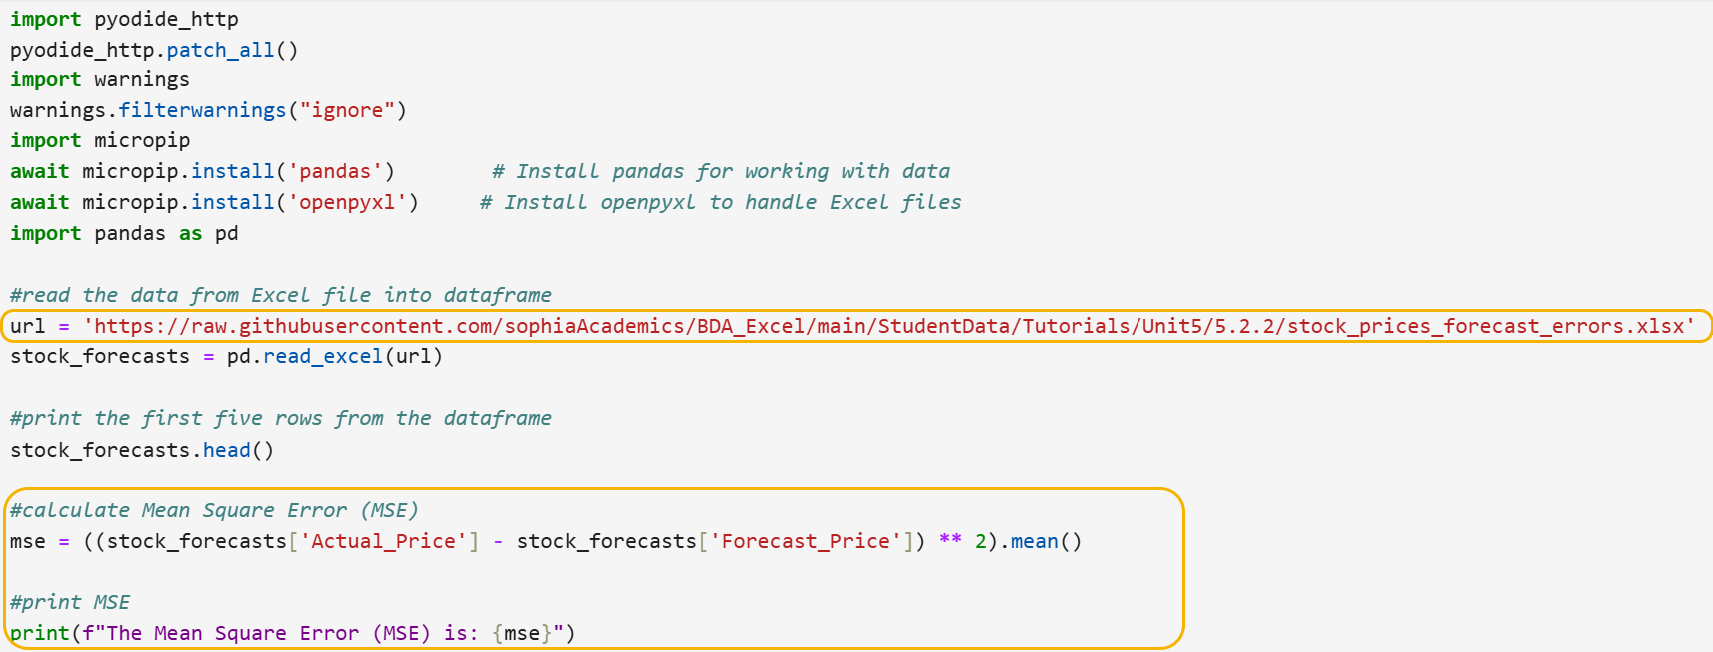
You are now ready to use Python to calculate MSE. The new URL for the data is provided in the first circled portion of the code as:
https://raw.githubusercontent.com/sophiaAcademics/BDA_Excel/main/StudentData/Tutorials/Unit5/5.2.2/stock_prices_forecast_errors.xlsx
The code below calculates and prints the MSE for the stock data and is shown as the second circled portion of code.
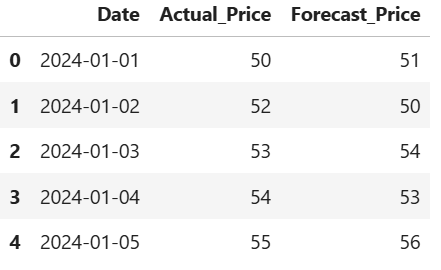
A preview of the DataFrame head() is:
Let’s break down the steps of the code line by line.
Step 1: Calculate the MSE value.
mse = ((stock_forecasts['Actual_Price'] - stock_forecasts['Forecast_Price']) ** 2).mean()
- This line calculates the MSE by:
- Subtracting the Forecast_Price column from the Actual_Price column to obtain the errors.
- Squaring these errors.
- Taking the mean (average) of these squared errors to compute the MSE.
Step 2: Print the MSE.
print(f"The Mean Square Error (MSE) is: {mse}")
- This line prints the calculated MSE value using a format string to define the measure that is being printed to the output.
The following text is printed in the output:

A Mean Square Error (MSE) value of 1.6 indicates the average squared difference between the actual stock prices and the forecasted stock prices is 1.6. Below is what this value means in practical terms.
1. Magnitude of Errors:
- The MSE value of 1.6 suggests that, on average, the squared errors (differences between actual and forecasted prices) are 1.6. Since the errors are squared, this value emphasizes larger errors more than smaller ones.
2. Forecast Accuracy:
- A lower MSE value indicates more accurate forecasts, as the differences between actual and forecasted values are smaller. Conversely, a higher MSE value indicates less accurate forecasts. There are no general rules of thumb for distinguishing between small and large MSE values because it depends on the context of the data and the specific application.
3. Interpretation in Context:
- To better understand the accuracy, you can compare this MSE value with other forecasting models or benchmarks. If other forecast models have higher MSE values, then an MSE of 1.6 would be considered relatively good. If other models have lower MSE values, then there might be room for improvement in the forecasting model.
4. Units of Measurement:
- The MSE value is in the squared units of the original data. For example, if the stock prices are in dollars, the MSE value of 1.6 is measured in squared dollars. This can sometimes make it less intuitive to interpret directly, but it still provides a useful measure of forecast accuracy.
In summary, an MSE of 1.6 indicates that, on average, the squared differences between the actual and forecasted stock prices are 1.6. This value helps quantify the accuracy of the forecasts, with lower values indicating better accuracy.
Now, it is your turn to practice your forecast accuracy skills in Python!
-
TrendyThreads is a popular online fashion retailer that heavily relies on social media to engage with its audience and drive sales. The marketing team at TrendyThreads wants to improve their social media strategy by accurately forecasting the number of likes their posts will receive. Accurate forecasts will help them plan their content better and allocate resources more effectively.
The team has collected data on the actual number of likes their posts received over a week and their forecasted likes for the same period.
The new link for the GitHub data is here:
https://raw.githubusercontent.com/sophiaAcademics/BDA_Excel/main/StudentData/Tutorials/Unit5/5.2.2/social_media_likes_forecast_errors.xlsx
Perform the following:
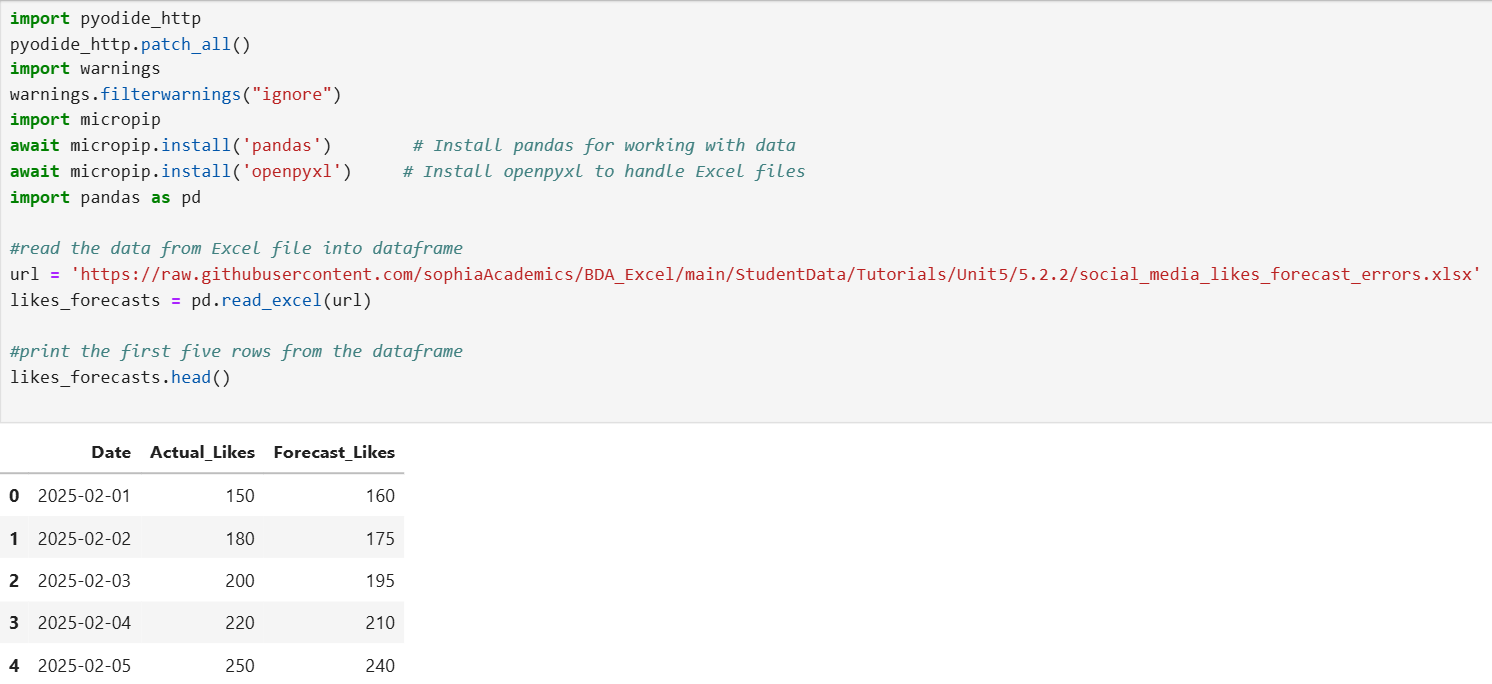
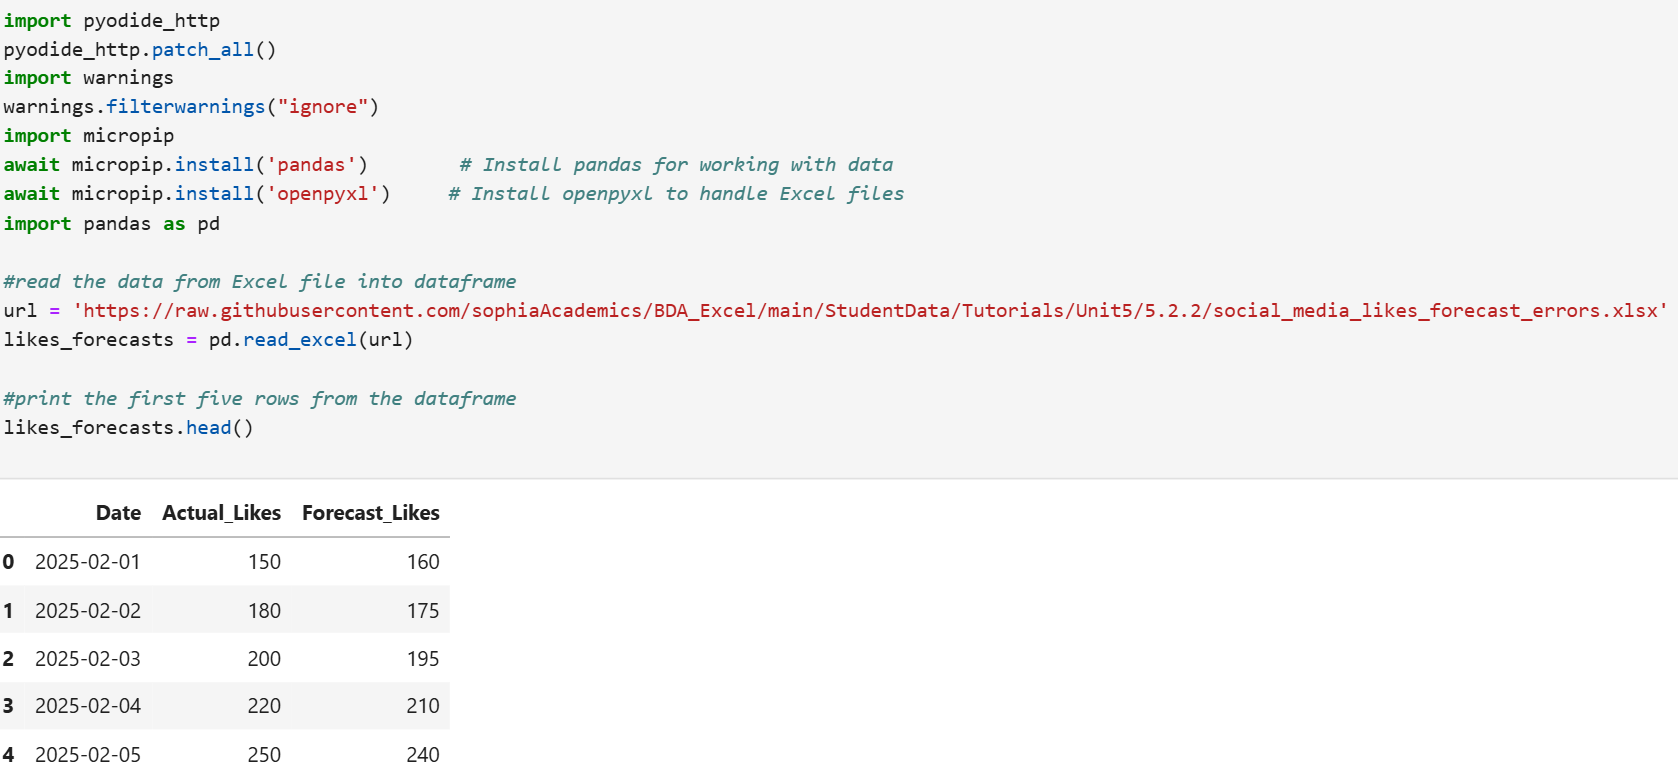
- Import the Excel file, create a pandas DataFrame named likes_forecasts, and view the five rows of the DataFrame.
- Calculate MSE in Python to evaluate the accuracy of the forecasted number of social media likes.
- Interpret the MSE value.
Solution:
1. The code below will create a pandas DataFrame named likes_forecasts and display the five rows of the data.
2. The code below calculates MSE.
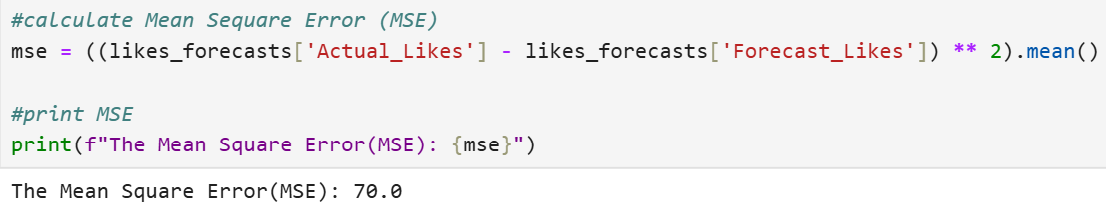
3. An MSE of 70 indicates that, on average, the squared differences between the actual and forecasted likes are 70. However, "squared likes" is not a unit that you can easily relate to or interpret in a practical sense. Unlike simple counts of likes, squared likes do not have a direct, intuitive meaning.
-
Follow along with this video that looks at TrendyBox sales to forecast the number of likes and examine MSE to evaluate the accuracy.
1b. Mean Absolute Error (MAE)
Mean Absolute Error (MAE) is another way to measure how accurate your forecasts or predictions are. It tells you, on average, how far off your predictions are from the actual values. Unlike other error metrics, MAE uses the absolute value of the errors, which means it does not matter if the errors are positive or negative.
MAE is simple to understand and easy to calculate. It gives you a clear idea of the average error in your predictions, making it a useful metric for evaluating the accuracy of forecasting models.
Unlike Mean Squared Error (MSE), which squares the errors and thus gives more weight to larger errors, MAE treats all errors equally. This makes MAE less sensitive to outliers, which can be beneficial if your data contains extreme values that you don't want to disproportionately influence the error metric.
The formula for MAE is  where:
-
n is the total number of observations
-
y is the observed (actual) data point
-
is the forecasted value (the value predicted by your forecasting model)
-
denotes the sum over all the observations 1 to n
MAE is calculated by taking the average of the absolute errors. Just like how an average is the sum of values divided by the number of values, the MAE is the sum of absolute errors divided by the number of data points. This makes MAE a measure of the average absolute error, providing a single value that represents the overall accuracy of the forecasts.
Let’s return to the stock prices example to see how to calculate MAE in Python and interpret the measure.
-
EXAMPLE
Returning to the stock price forecasts data (
https://raw.githubusercontent.com/sophiaAcademics/BDA_Excel/main/StudentData/Tutorials/Unit5/5.2.2/stock_prices_forecast_errors.xlsx), you will use Python to calculate MAE and interpret what this measure tells you about the accuracy of the forecasts.
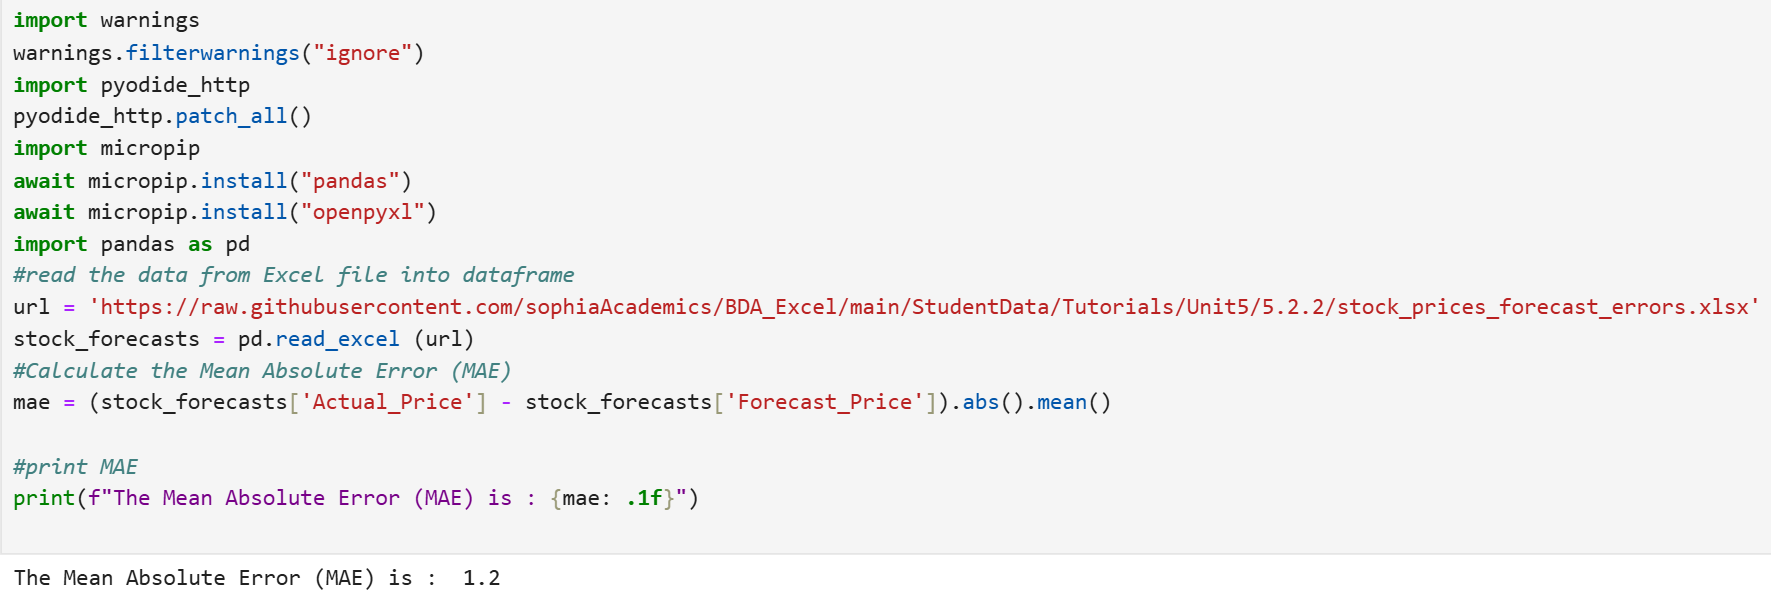
The code below imports pandas, imports an Excel file from a URL, and creates a pandas DataFrame.
 Step 1:
 Calculate the MAE value.
mae = (stock_forecasts['Actual_Price'] - stock_forecasts['Forecast_Price']).abs().mean()
- This line calculates the MAE by:
- Subtracting the Forecast_Price column from the Actual_Price column to obtain the errors.
- Taking the absolute value of these errors.
- Calculating the mean (average) of the absolute errors.
Step 2: Print the MAE.
print(f"The Mean Absolute Error (MAE) is: {mae}")
- This line prints the calculated MAE value using a format string to define the measure that is being printed to the output.
The following text is printed in the output:

In the context of this stock prices example, an MAE value of 1.2 means that, on average, the forecasted stock prices differ from the actual stock prices by 1.2 units (dollars, in this case). Below is what this value means in practical terms:
Forecast Accuracy:
- The MAE value of 1.2 suggests that the forecasts are relatively close to the actual prices, with an average error of 1.2 units (dollars, in this case). In a similar fashion to MSE, there are no general rules of thumb for distinguishing between small and large values of MAE, because it depends on the context of the data and the specific application.
Interpretation in Context:
- Since stock prices are measured in dollars, an MAE of $1.2 means that, on average, the forecasted prices are off by $1.20 from the actual prices. This can help you understand the typical deviation you might expect from your forecasts.
Units of Measurement:
- The units of MAE are not squared as they are in MSE, so the interpretation is more straightforward than when using MSE.
-
You are going to return to an example you have worked with previously, but now you are going to calculate MAE to assess forecast accuracy.
TrendyThreads is a popular online fashion retailer that heavily relies on social media to engage with its audience and drive sales. The marketing team at TrendyThreads wants to improve their social media strategy by accurately forecasting the number of likes their posts will receive. Accurate forecasts will help them plan their content better and allocate resources more effectively.
The team has collected data on the actual number of likes their posts received over a week and their forecasted likes for the same period.
The GitHub link that contains the data we previously worked with is:
https://raw.githubusercontent.com/sophiaAcademics/BDA_Excel/main/StudentData/Tutorials/Unit5/5.2.2/social_media_likes_forecast_errors.xlsx
Perform the following:
- Import the Excel file, create a pandas DataFrame named likes_forecasts, and view the five rows of the DataFrame.
- Calculate MAE in Python to evaluate the accuracy of the forecasted number of social media likes.
- Interpret the MAE value.
- Provide the business implications of the MAE value in the context of TrendyThreads' social media strategy. Explain how understanding the MAE can help the marketing team improve their content planning and resource allocation.
Solution:
1. The code below will create a pandas DataFrame named likes_forecasts and display the five rows of the data.

2. The code below calculates MAE.
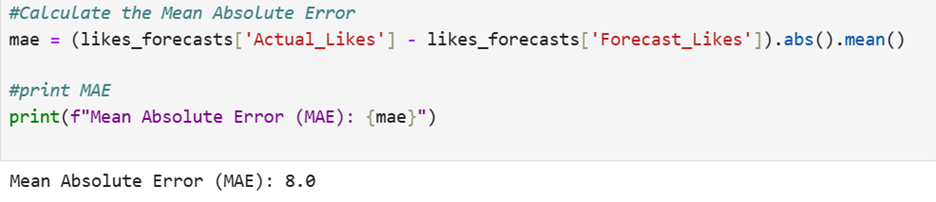
3. An MAE of 8 means that, on average, the forecasted likes are off by 8 likes from the actual likes.
4.
Resource Allocation: Knowing that their forecasts are, on average, 8 likes off, the marketing team can better allocate resources by adjusting their budget and manpower to focus on posts that are likely to perform well. This helps in planning content more strategically and scheduling posts at optimal times to maximize engagement.
Content Strategy: By understanding the forecast accuracy, the team can identify which types of content are consistently underperforming or overperforming. This insight allows TrendyThreads to refine its content strategy, focusing on creating posts that are more likely to resonate with their audience, thereby reducing the error margin and improving overall engagement.
-
This video looks at TrendyBox sales to calculate MAE to evaluate the forecasted number of likes.
1c. Mean Absolute Percentage Error (MAPE)
Yet another way to measure forecast accuracy is using Mean Absolute Percentage Error (MAPE). MAPE is a measure to tell you how far off our predictions are from the actual values, but it does this in percentage terms.
MAPE is useful because it gives you a clear, easy-to-understand percentage that tells you how accurate your predictions are. For example, a MAPE of 5% means that, on average, your predictions are off by 5%. This makes it simple to communicate and compare the accuracy of different forecasting models. In addition, because MAPE is reported as a percentage, you can compare the forecast errors across different scales.
-
EXAMPLE
Consider a scenario where two different forecasting models have been developed to predict key metrics for a retail company. You have a forecast accuracy for sales (in dollars) and a forecast accuracy for customer foot traffic (number of customers that visit the store). The sales forecast has a MAPE of 6.4%, meaning the predictions are, on average, 6.4% off from the actual sales values. On the other hand, the customer foot traffic forecast has a MAPE of 2.5%, indicating that these predictions are only 2.5% off from the actual foot traffic numbers.
MAPE is particularly useful in this context because it converts errors into percentages, allowing you to compare the accuracy of these forecasts directly, despite their different measurement scales. By standardizing the errors, MAPE provides a clear and intuitive way to see that the customer foot traffic forecast is more accurate than the sales forecast.
This insight helps the business prioritize improvements, such as refining the sales forecasting model to reduce its error rate while maintaining the already fairly accurate foot traffic forecast.
The formula for MAPE is

where:
-
n is the total number of observations
-
y is the observed (actual) data point
-
is the forecasted value (the value predicted by your forecasting model)
-
denotes the sum over all the observations 1 to n
MAPE is calculated by taking the average of the absolute percentage errors between the actual and predicted values. This involves finding the absolute difference between each actual and predicted value, dividing by the actual value to get a percentage error, and then averaging these percentage errors across all observations. Finally, the result is multiplied by 100 to convert it to a percentage.
Let’s return to the stock prices example and see how to calculate MAPE in Python and interpret the measure.
Returning to the stock price forecasts (
https://raw.githubusercontent.com/sophiaAcademics/BDA_Excel/main/StudentData/Tutorials/Unit5/5.2.2/stock_prices_forecast_errors.xlsx), you will use Python to calculate MAPE and interpret what this measure tells you about the accuracy of the forecasts.
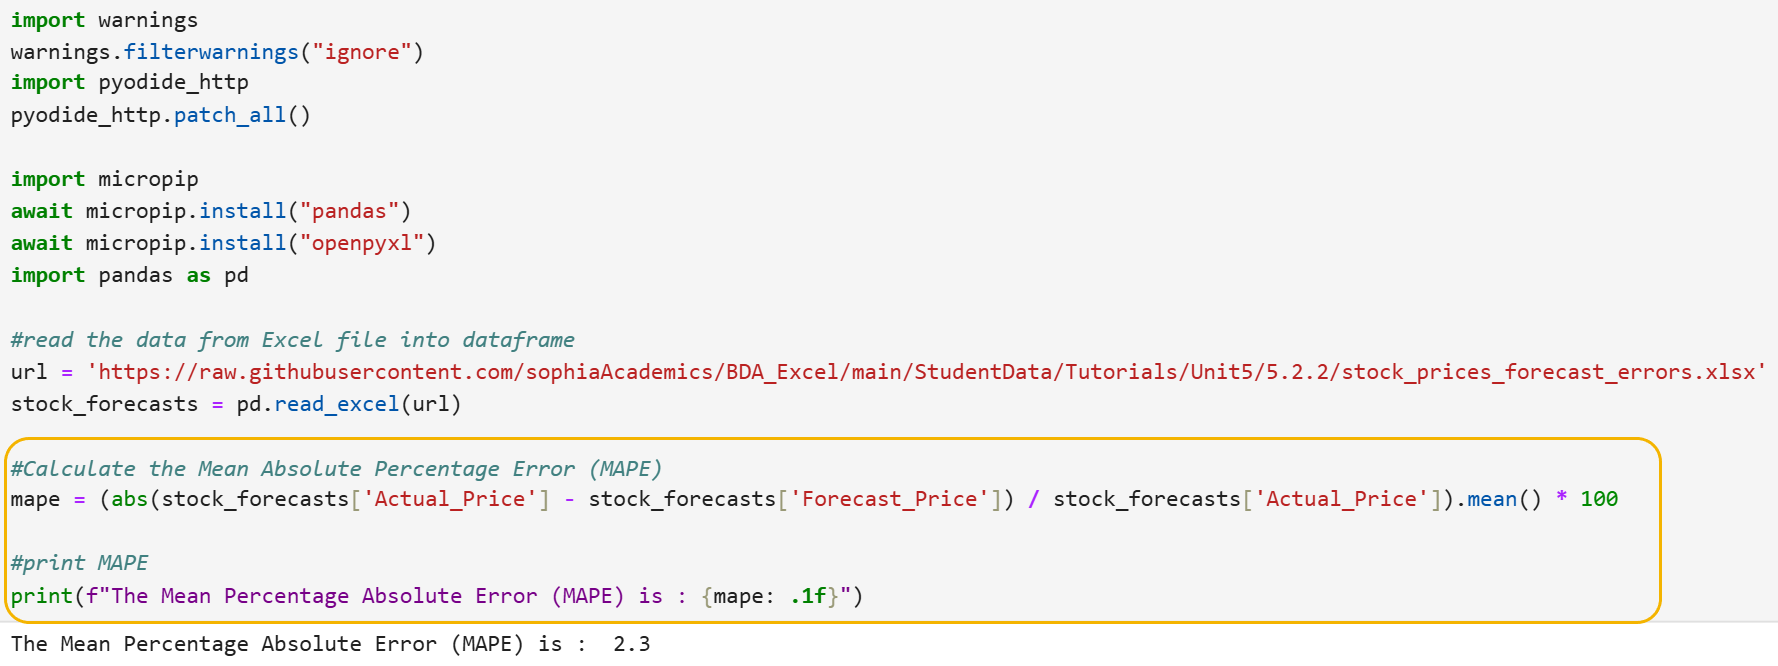
The code below—like previous examples—imports pandas, imports an Excel file from a URL, and creates a pandas DataFrame, while the code circled in yellow is new code to calculate MAPE.
Let’s break down the code line by line.
Step 1: Calculate the MAPE value.
mape = (abs(stock_forecasts['Actual_Price'] - stock_forecasts['Forecast_Price']) / stock_forecasts['Actual_Price']).mean() * 100
- This line calculates the MAPE by:
- Subtracting the Forecast column from the Actual column to obtain the errors.
- Taking the absolute value of these errors to ensure all errors are positive.
- Dividing each absolute error by the corresponding actual value to convert the errors into percentage errors.
- Calculating the mean (average) of these percentage errors to get the average percentage error.
- Multiplying by 100 to convert the result into a percentage.
Step 2: Print the MAPE.
print(f"The Mean Absolute Percentage Error (MAPE) is: {mape: .1f}")
- This line prints the calculated MAPE value and rounds the value to one decimal place using a format string to define the measure that is being printed to the output.
The following text is printed in the output:

In the context of this stock prices example, a MAPE value of 2.3 means that, on average, the forecasted stock prices differ from the actual stock prices by 2.3%. Below is what this value means in practical terms:
1. Forecast Accuracy:
- The MAPE value of 2.3% means that the forecasts are highly accurate, with an average error of just 2.3%. This indicates that the predicted stock prices are very close to the actual prices, making the forecast reliable for decision-making. Similar to MAE, there are no universal thresholds for what constitutes a good or bad MAPE value, as it depends on the specific context and application. However, a lower percentage indicates the predicted forecasts are more accurate.
2. Interpretation in Context:
- Since stock prices are measured in dollars, a MAPE of 2.3% means that, on average, the forecasted prices are off by 2.3% of the actual prices. This MAPE value indicates a high level of accuracy in the forecasts. For example, if a stock’s actual price is $100, the forecasted stock value would typically be (on average) within 2.3% of this actual price, or about $2.30. This helps you understand the relative accuracy of your forecasts in percentage terms, which can be more intuitive and easier to communicate.
3. Units of Measurement:
- Unlike MAE, which is measured in the same units as the data (dollars, in this case), MAPE is expressed as a percentage. This makes it easier to compare the accuracy of forecasts across different datasets and scales, providing a standardized measure of forecast accuracy.
Now, it is your chance to put your forecast accuracy skills to the test in Python!
-
You are going to return to an example you have worked with previously, but now you are going to calculate MAPE to assess forecast accuracy.
TrendyThreads is a popular online fashion retailer that heavily relies on social media to engage with its audience and drive sales. The marketing team at TrendyThreads wants to improve their social media strategy by accurately forecasting the number of likes their posts will receive. Accurate forecasts will help them plan their content better and allocate resources more effectively.
The team has collected data on the actual number of likes their posts received over a week and their forecasted likes for the same period.
The GitHub link that contains the data we previously worked with is:
https://raw.githubusercontent.com/sophiaAcademics/BDA_Excel/main/StudentData/Tutorials/Unit5/5.2.2/social_media_likes_forecast_errors.xlsx
Perform the following:
- Import the Excel file, create a pandas DataFrame named likes_forecasts, and view the five rows of the data frame.
- Calculate MAPE in Python to evaluate the accuracy of the forecasted number of social media likes. Round the MAPE measure to one decimal place.
- Interpret the MAPE value.
Solution:
1. The code below will create a pandas DataFrame named likes_forecasts and display the five rows of the data.
2. The code below calculates MAPE and rounds the value to one decimal place.
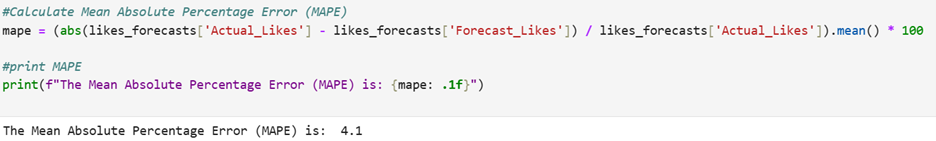
3. A MAPE of 4.1% means that, on average, the forecasted likes are off by 4.1% from the actual likes. This indicates a high level of accuracy in the forecasts. For example, if a post is expected to receive 200 likes, the forecasted number of likes would typically be within 4.1% of this value, or approximately 8 likes.
-
This video looks at TrendyBox sales to calculate MAPE to evaluate the forecasted number of likes.
1d. Choosing Between the Forecast Accuracy Measures
The table below provides some guidance on when you should use each of the different forecast accuracy measures this tutorial has discussed. The table presents the advantages and disadvantages of each forecast accuracy measure.
|
Metric
|
When to Use
|
Advantages
|
Disadvantages
|
|
MSE
|
Use MSE when you want to penalize larger errors more heavily. Useful in situations where large errors are particularly undesirable.
|
Sensitive to large errors. Highlights significant deviations.
|
Can be overly influenced by outliers. Less interpretable because the errors are squared.
|
|
MAE
|
Use MAE when you want a straightforward measure of average error magnitude. Useful when all errors should be treated equally, regardless of their size.
|
Easy to interpret. Less sensitive to outliers.
|
Does not penalize large errors as heavily as MSE.
|
|
MAPE
|
Use MAPE when you need to compare forecast accuracy across different measurement scales or when percentage errors are more meaningful. Useful in business contexts where relative error is important.
|
Provides a percentage error. Easy to interpret and compare across different measurement scales.
|
Can be problematic with actual values close to zero*. Less effective with very small or very large values.
|
|
*MAPE can be problematic when actual values are close to 0 because the formula involves dividing by the actual value. When the actual value is very small, even a tiny error in the prediction can result in a very large percentage error. This can distort the overall MAPE, making it appear much larger than it actually is in practical terms. Essentially, the percentage error becomes exaggerated, which can lead to misleading conclusions about the accuracy of the forecast.
|
In this lesson, you learned how to calculate and interpret three key measures of forecast accuracy: Mean Squared Error (MSE), Mean Absolute Error (MAE), and Mean Absolute Percentage Error (MAPE). MSE, MAE, and MAPE each offer unique perspectives on forecast accuracy. MSE emphasizes larger errors due to squaring the error differences, while MAE provides a straightforward average of absolute forecast errors. MAPE, on the other hand, expresses errors as a percentage, making it easier to understand forecast accuracy across different scales. You gained hands-on practice by computing, comparing, and interpreting these three forecast accuracy measures in Python using stock price data. By practicing computing these forecasting accuracy measures, you are now equipped to evaluate the accuracy of a forecasting model.