Use Sophia to knock out your gen-ed requirements quickly and affordably. Learn more
×

First Shape Theorem

Author: Sophia

what's covered
In this lesson, you will use properties of a function f open parentheses x close parentheses to sketch the graph of its derivative, f apostrophe open parentheses x close parentheses. Specifically, this lesson will cover:

Table of Contents

1. What f'  (x) Tells Us About the Graph of y = f    (x)

Consider the graph of a function y equals f open parentheses x close parentheses, shown below.

A graph with an x-axis ranging from −6 to 6 and a y-axis ranging from −8 to 16 in increments of 2. The graph has a horizontal S-shaped curve starting from the second quadrant and extending into the fourth quadrant. The curve descends to the marked point ‘A’ (−4, 1) and passes along several marked points labeled from A to J: A (−4, 1), B (−3, −5.9), C (−2, −7.9), D (−1, −6), E (0, −2), F (1, 3.1), G (2, 8.1), H (3, 12.1), I (4, 14), and J (5, 12). The curve then falls sharply from Point J (5, 12).

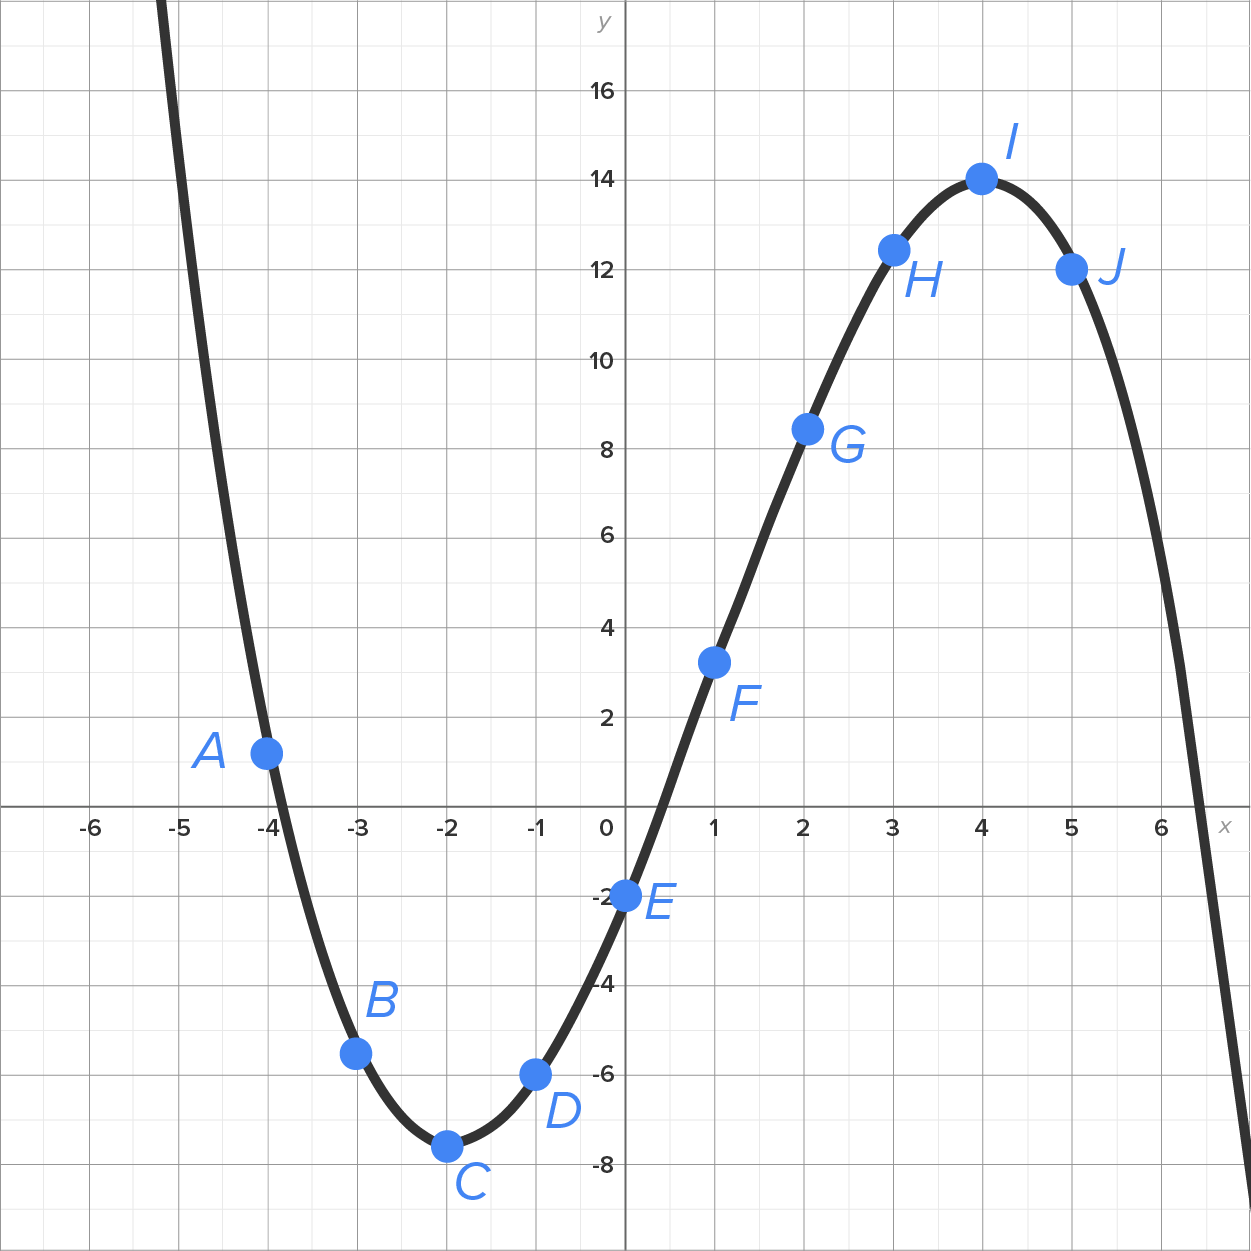
Note that the graph is decreasing at points A, B, and J. Notice also that the slopes of the tangent lines at each of these points are negative.

Note that the graph increases at points D, E, F, G, and H. Notice also that the slopes of the tangent lines at each of these points are positive.

Finally, points C and I are local maximum/minimum points. Notice also that the slope of the tangent line at each of these points is zero.

This leads to a very useful link between the behavior of f open parentheses x close parentheses and the value of f apostrophe open parentheses x close parentheses.

big idea
If f open parentheses x close parentheses is increasing at x equals a, then f apostrophe open parentheses a close parentheses greater than 0.
If f open parentheses x close parentheses is decreasing at x equals a, then f apostrophe open parentheses a close parentheses less than 0.


2. Using Slope to Graph y = f'  (x) Given y = f    (x)

Given what we know about f apostrophe open parentheses x close parentheses when f open parentheses x close parentheses is increasing or decreasing, we can get a rough sketch of the graph of f apostrophe open parentheses x close parentheses when given the graph of f open parentheses x close parentheses.

EXAMPLE

Consider the graph of y equals f open parentheses x close parentheses shown below with tangent line segments at points A through J. Notice also the local minimum at point C and the local maximum at point I.

A graph with an x-axis ranging from −6 to 6 and a y-axis ranging from −8 to 16 in increments of 2. The graph has a horizontal S-shaped curve extending from the second quadrant into the fourth quadrant. The curve descends to the marked point ‘A’ (−4, 1) in the second quadrant and passes through several marked points labeled from A to J: A (−4, 1), B (−3, −5.9), C (−2, −7.9), D (−1, −6), E (0, −2), F (1, 3.1), G (2, 8.1), H (3, 12.1), I (4, 14), and J (5, 12). The curve then falls sharply from Point J (5, 12). Ten small tangent line segments pass through each marked point from A to J, one at each point. The line segments are not connected and they are horizontal at Points C and I.

The behavior of f apostrophe open parentheses x close parentheses 
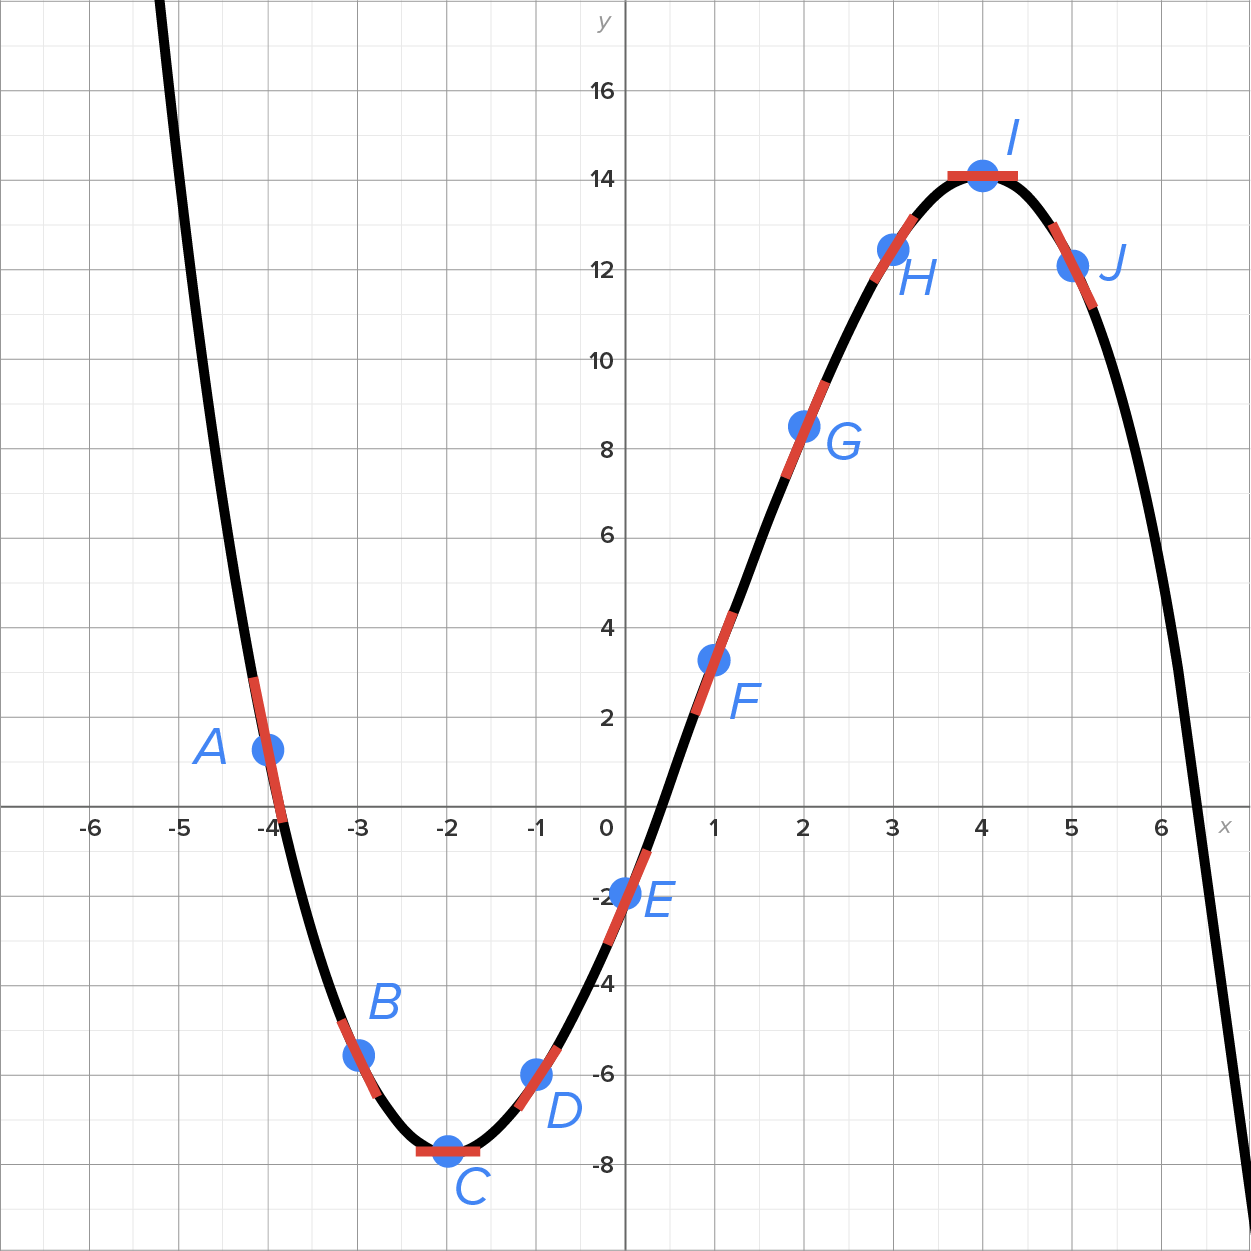
can be summarized in the following table at each point. Remember that m subscript tan is the value of f apostrophe open parentheses x close parentheses at any point.

Point Value of bold italic f bold apostrophe open parentheses bold x close parentheses
A f apostrophe open parentheses x close parentheses less than 0
B f apostrophe open parentheses x close parentheses less than 0, but the value of f apostrophe open parentheses x close parentheses is larger than its value at A
C f apostrophe open parentheses x close parentheses equals 0 (horizontal tangent line)
D f apostrophe open parentheses x close parentheses greater than 0
E f apostrophe open parentheses x close parentheses greater than 0, but its value is noticeably greater than the slope at point D
F f apostrophe open parentheses x close parentheses greater than 0, but its value is slightly greater than the slope at point E
G f apostrophe open parentheses x close parentheses greater than 0, but its value is slightly less than the slope at point F
H f apostrophe open parentheses x close parentheses greater than 0, but its value is noticeably less than the slope at point G
I f apostrophe open parentheses x close parentheses equals 0 (horizontal tangent line)
J f apostrophe open parentheses x close parentheses less than 0

The graph of the derivative is shown here. Note that the points A through J have the same x-coordinates as those marked on the graph of f open parentheses x close parentheses.

A graph with an x-axis ranging from −4 to 8 in increments of 2 and a y-axis ranging from −20 to 10 in increments of 5. The graph has a parabolic curve opening downward, extending from the third quadrant into the fourth quadrant. Several points are marked along the curve labeled from A to J: A (−4, −9.9), B (−3, −4.9), C (−2, 0), D (−1, 2.5), E (0, 5), F (1, 5.1), G (2, 5), H (3, 2.5), I (4, 0), and J (5, −4.9).

watch
In this video, we’ll sketch the derivative of a function given its graph.

watch
In this next video, we’ll sketch the derivative of a function given its graph.

summary
In this lesson, you learned about a useful link between the behavior of f open parentheses x close parentheses and the value of f apostrophe open parentheses x close parentheses. Specifically, given the graph of bold italic y bold equals bold italic f bold left parenthesis bold italic x bold right parenthesis, it is possible to sketch the graph of bold italic y bold equals bold italic f bold apostrophe bold left parenthesis bold italic x bold right parenthesis by using slopes of the tangent lines at given points and their respective behavior.

Source: THIS TUTORIAL HAS BEEN ADAPTED FROM CHAPTER 3 OF "CONTEMPORARY CALCULUS" BY DALE HOFFMAN. ACCESS FOR FREE AT WWW.CONTEMPORARYCALCULUS.COM. LICENSE: CREATIVE COMMONS ATTRIBUTION 3.0 UNITED STATES.