Table of Contents |
The slope of a line describes its steepness. Slope can be positive, negative, or zero. For now, we will focus on positive and negative slopes. To determine if the slope of a line is positive or negative, "read" the graph left to right. If the line increases, or goes up, then the slope is positive. In other words, as x increases, the y values also increase. If the line decreases, or goes down, the slope is negative. As x increases, the y values decrease. Slopes are used to find patterns in data. This strengthens your problem solving skill by drawing conclusions from the slope on the graph.
Here are the graphs of two lines: one with a positive slope, and one with a negative slope.
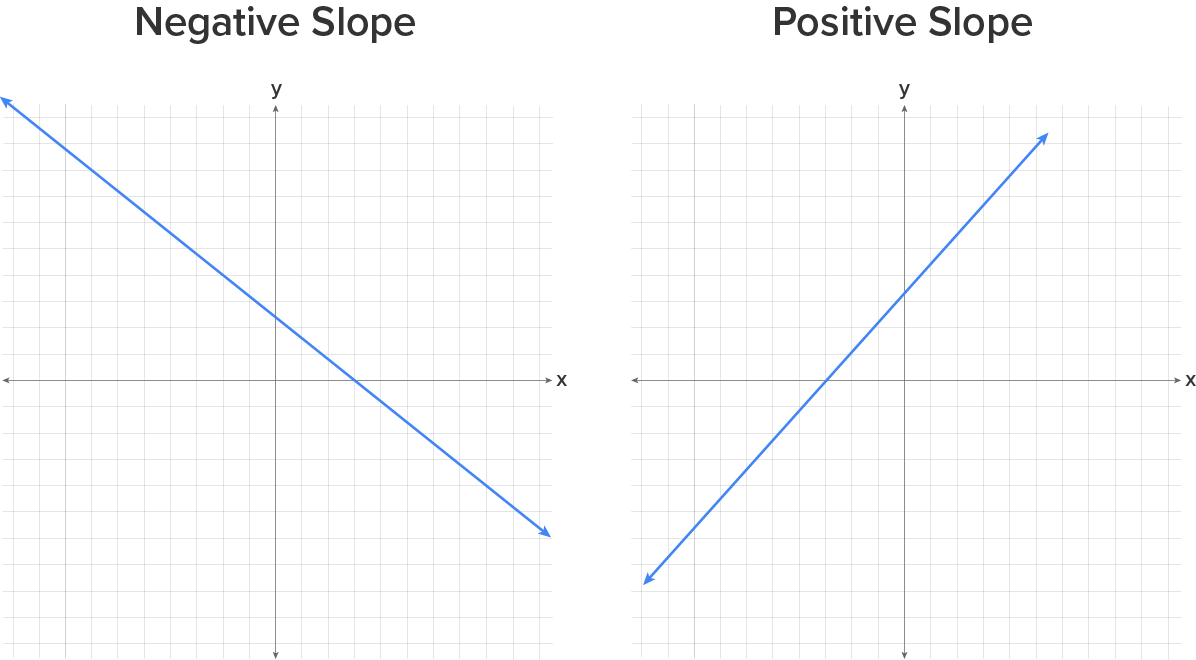
As we graph lines, we will want to be able to identify different properties of the lines we graph. One of the most important properties of a line is its slope. A line with a large slope, such as 25, is very steep. A line with a small slope, such as 0.10, is very flat. We will also use slope to describe the direction of the line. A line that goes up from left to right will have a positive slope and a line that goes down from left to right will have a negative slope.
As we measure steepness, we are interested in how fast the line rises compared to how far the line runs. For this reason we will describe slope as this fraction:

Rise would be a vertical change, or a change in the y values. Run would be a horizontal change, or a change in the x values. Therefore, another way to describe slope would be the fraction:

Another way to describe a positive slope is if, when the change in the x values increase, the change in the y values also increase. The slope is negative if, as the change in the x values increase, the change in the y values decrease. Determining whether a slope is positive or negative shows you the pattern of the data, strengthening your problem solving skill.
It turns out that if we have a graph, we can draw vertical and horizontal lines from one point to another to make what is called a slope triangle. The sides of the slope triangle give us our slope. The following examples show graphs that we find the slope of using this idea.
EXAMPLE
Consider the following graph.


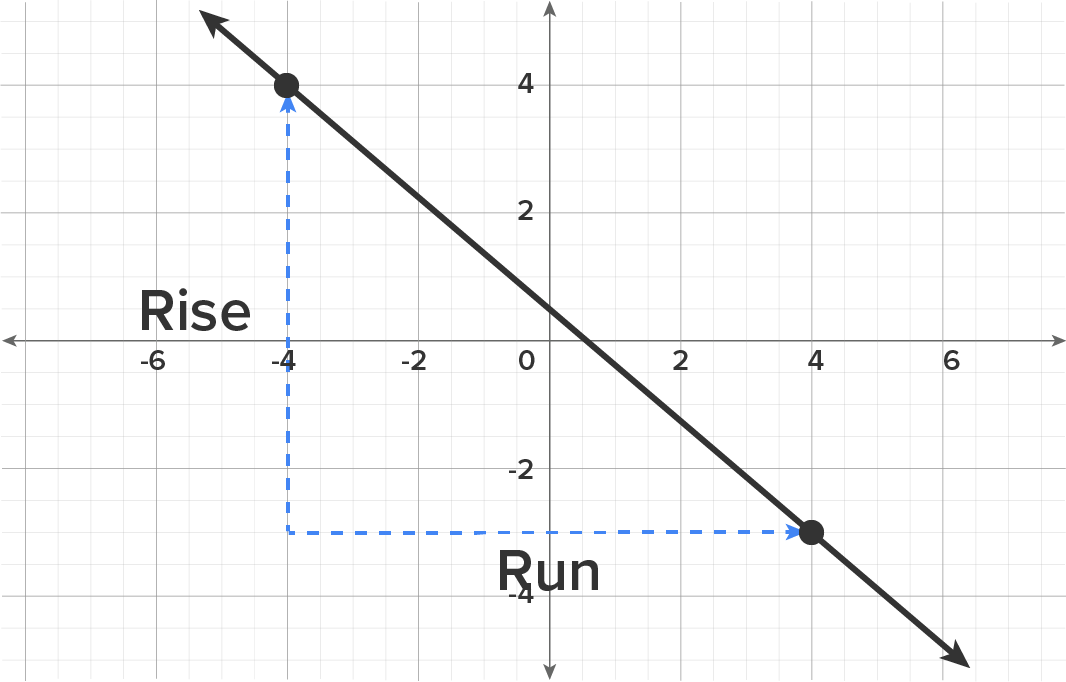
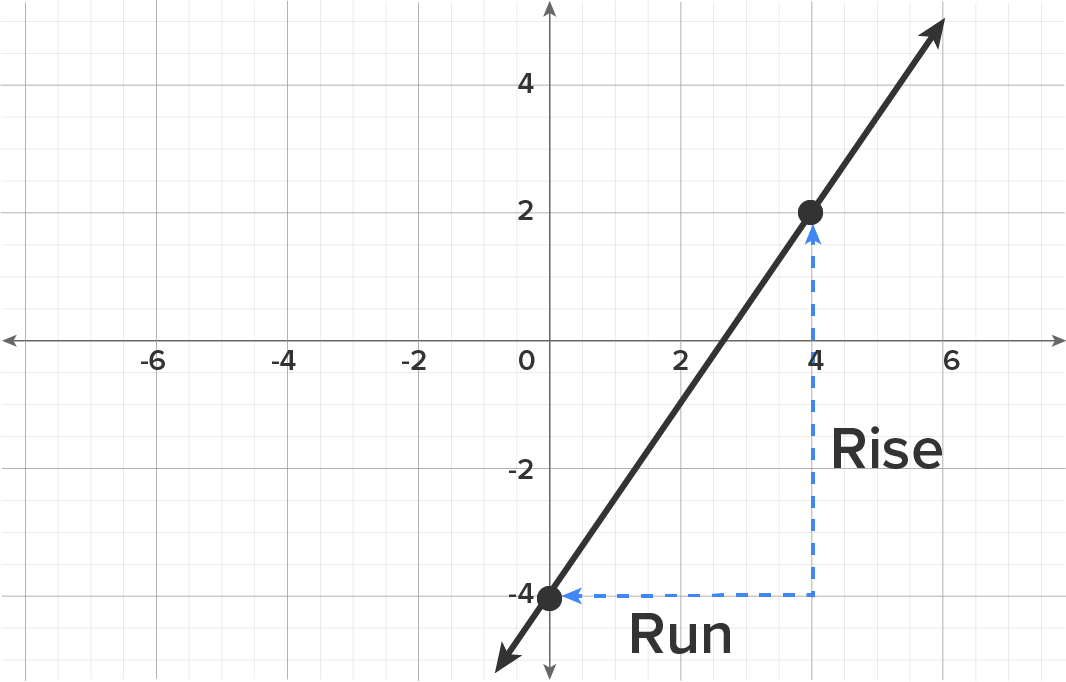
EXAMPLE
Consider the following graph.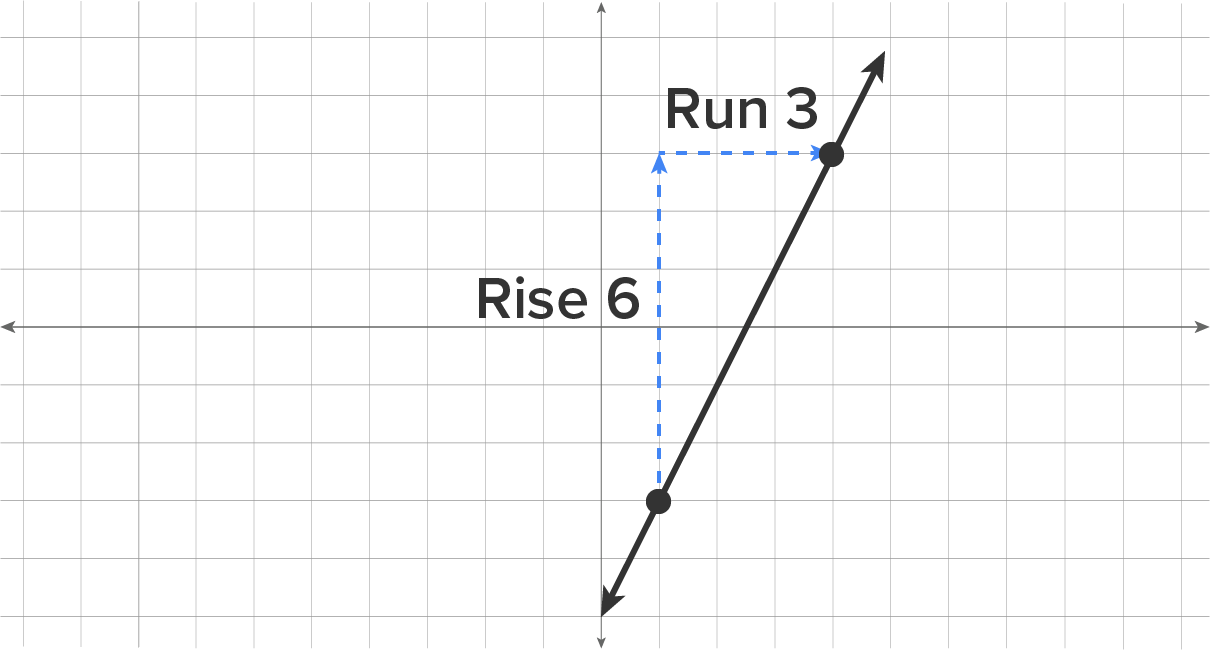

Problem Solving: Apply Your Skill |
We can find the slope of a line through two points without seeing the points on a graph. We can do this using a slope formula. If the rise is the change in y values, we can calculate this by subtracting the y values of a point. Similarly, if run is a change in the x values, we can calculate this by subtracting the x values of a point. In this way we get the following equation for slope:
The slope of a line through  and
and  is
is 
When mathematicians began working with slope, it was called the modular slope. For this reason we often represent the slope with the variable m. Now we have the following for slope:


EXAMPLE
Suppose you have the points (-2, 1) and (5, 4). Determine the slope of the line.
EXAMPLE
Determine the slope of the line that passes through (3, 6) and (7, 1).
EXAMPLE
Given the points (2, 0) and (5, -3), determine the slope of the line that includes these two points.


IN CONTEXT
Calculating slope is useful in many everyday situations, including price and cost, transportation fares, and inclines, such as roof tops, ski slopes, and parking ramps.
For example, suppose you have a landscaping business. The line below represents the relationship between time in hours and the number of lawns mowed.
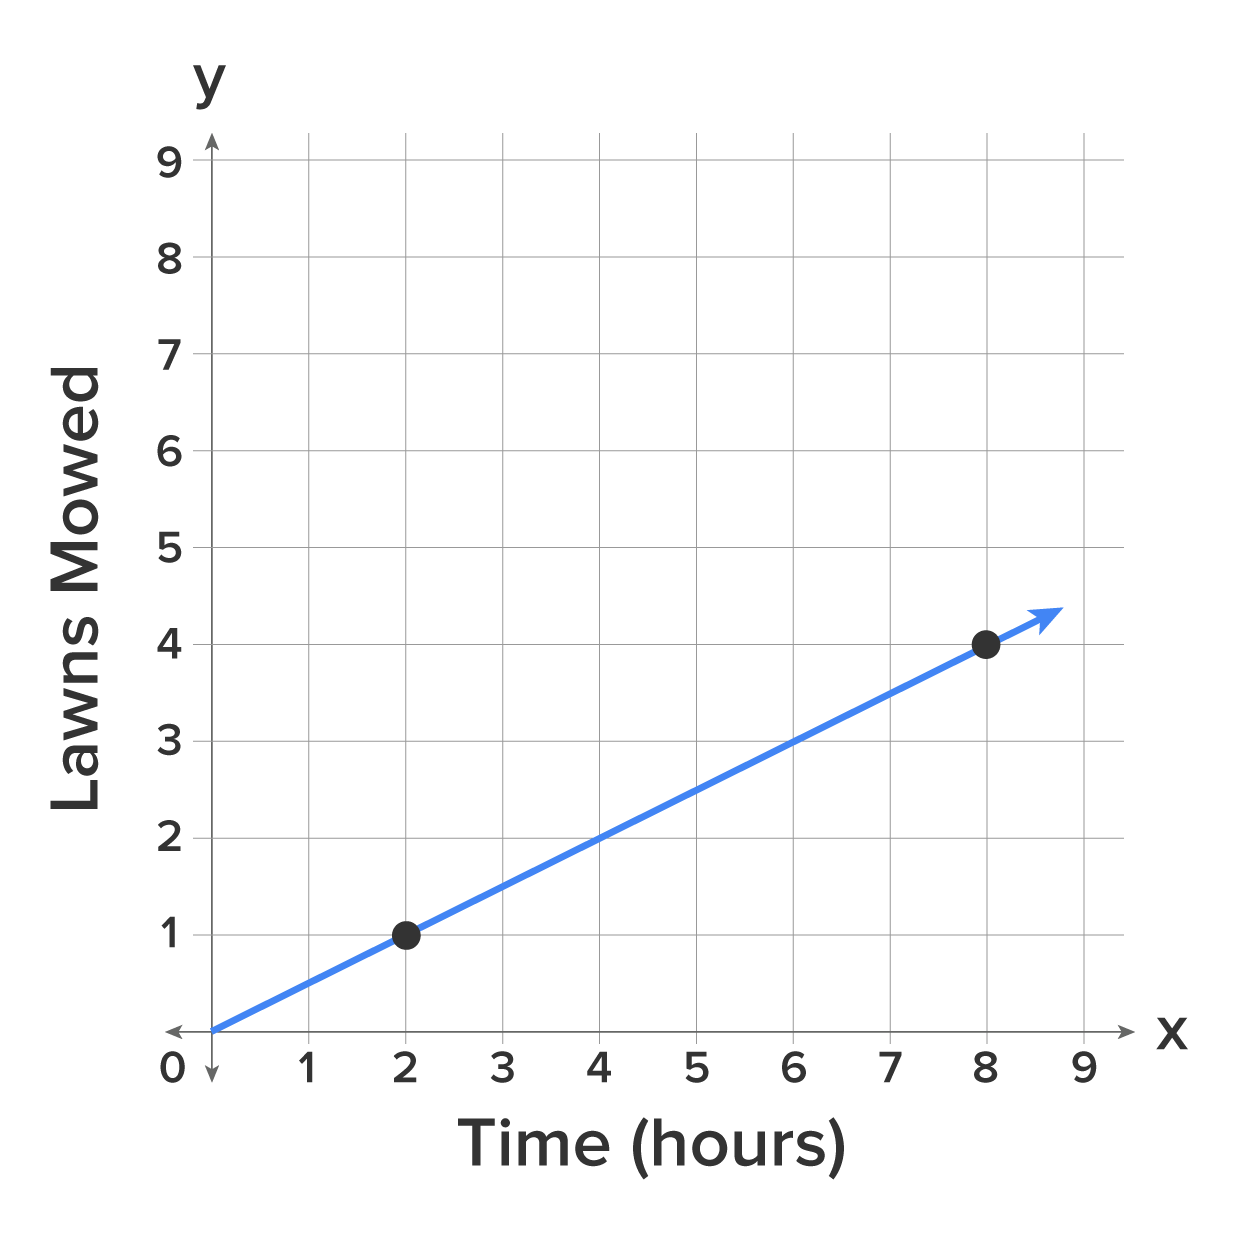
You can pick any two points on the line to calculate the slope, such as (2, 1) and (8, 4). Make sure you label your points as shown below. Substitute these values into the formula, which simplifies to 1/2. Therefore, 1/2 is the slope of the line between any two points on this graph. Remember that the slope is the change in y over the change in x. What this means in our context with a slope of 1/2 that for every one lawn mowed, there is a two hour change in time, or simply saying it takes two hours to mow one lawn.

IN CONTEXT
Suppose the temperature is dropping throughout the day. The line below represents the relationship between time in hours after 8:00 a.m. and the temperature. By looking at the line, you can see that the slope will be negative because the line goes down as you read the graph from left to right. Can you calculate the slope?

To calculate the slope, use the two points (0, 7) and (7, 0) and label them in accordance with the slope formula. Substitute these values into the formula and simplify, which gives you a slope of -1.

Therefore, -1 is the slope of the line between any two points on this graph, which also means that the temperature is decreasing by 1 degree each hour after 8 a.m.
There are two special lines that have unique slopes that we need to be aware of. The line below is a horizontal line.
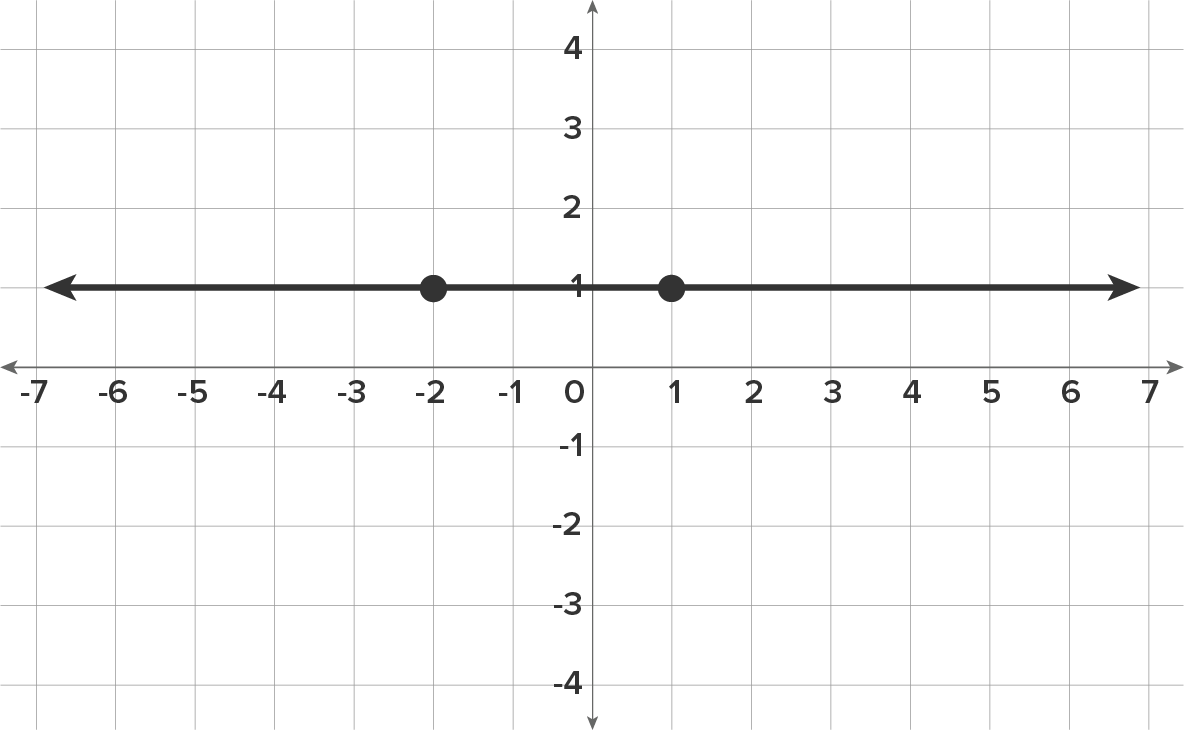
You’ll notice that we cannot draw a slope triangle. For this line, the slope is not steep at all. In fact, it is flat. Therefore it has a zero slope. All horizontal lines have a zero slope. But, let’s verify this using the slope equation. The two points on the graph are (-2, 1) and (1, 1).

IN CONTEXT
The graph below shows the height of a teenager in feet, in relation to his or her age in years after 18. By looking at the line, you can see that the line has a 0 slope, meaning no steepness, because it is a horizontal line. This means there is zero change in the values of the y-coordinates.

To calculate the slope, use the points (2, 6) and (6, 6), and label them accordingly. Substitute these values into the formula and simplify. Note that this simplifies to 0 over 4 or 0 divided by 4, which is 0. Therefore, 0 is the slope of the line between any two points on the graph because there is no change in the y-coordinates between any two points. This also means that the person’s height is not changing over time after age 18.

This next line is a vertical line.
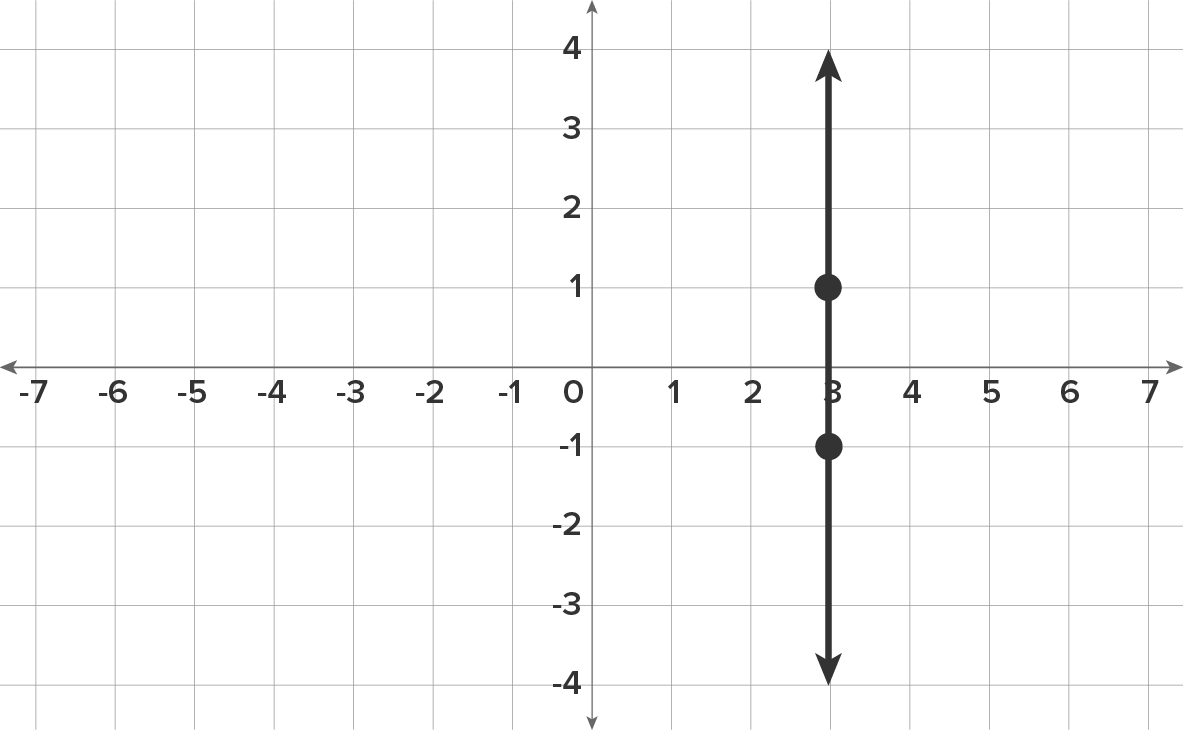
For this line, the slope can’t get any steeper. It is so steep that there is no number large enough to express how steep it is so this is an undefined slope. All vertical lines have an undefined slope. Let’s verify this using the slope equation. The two points on the graph are (3, -2) and (3, 3).

Because we cannot divide a fraction with 0 in the denominator, we say that the slope of the line is undefined.
IN CONTEXT
This last graph represents a very steep part of a cliff, illustrating the vertical movement as it relates to the horizontal movement of a climber. By looking at the line, you can see that the line has an undefined slope, meaning infinite steepness because it is a vertical line. This means that there is zero change in the values of the x-coordinates.
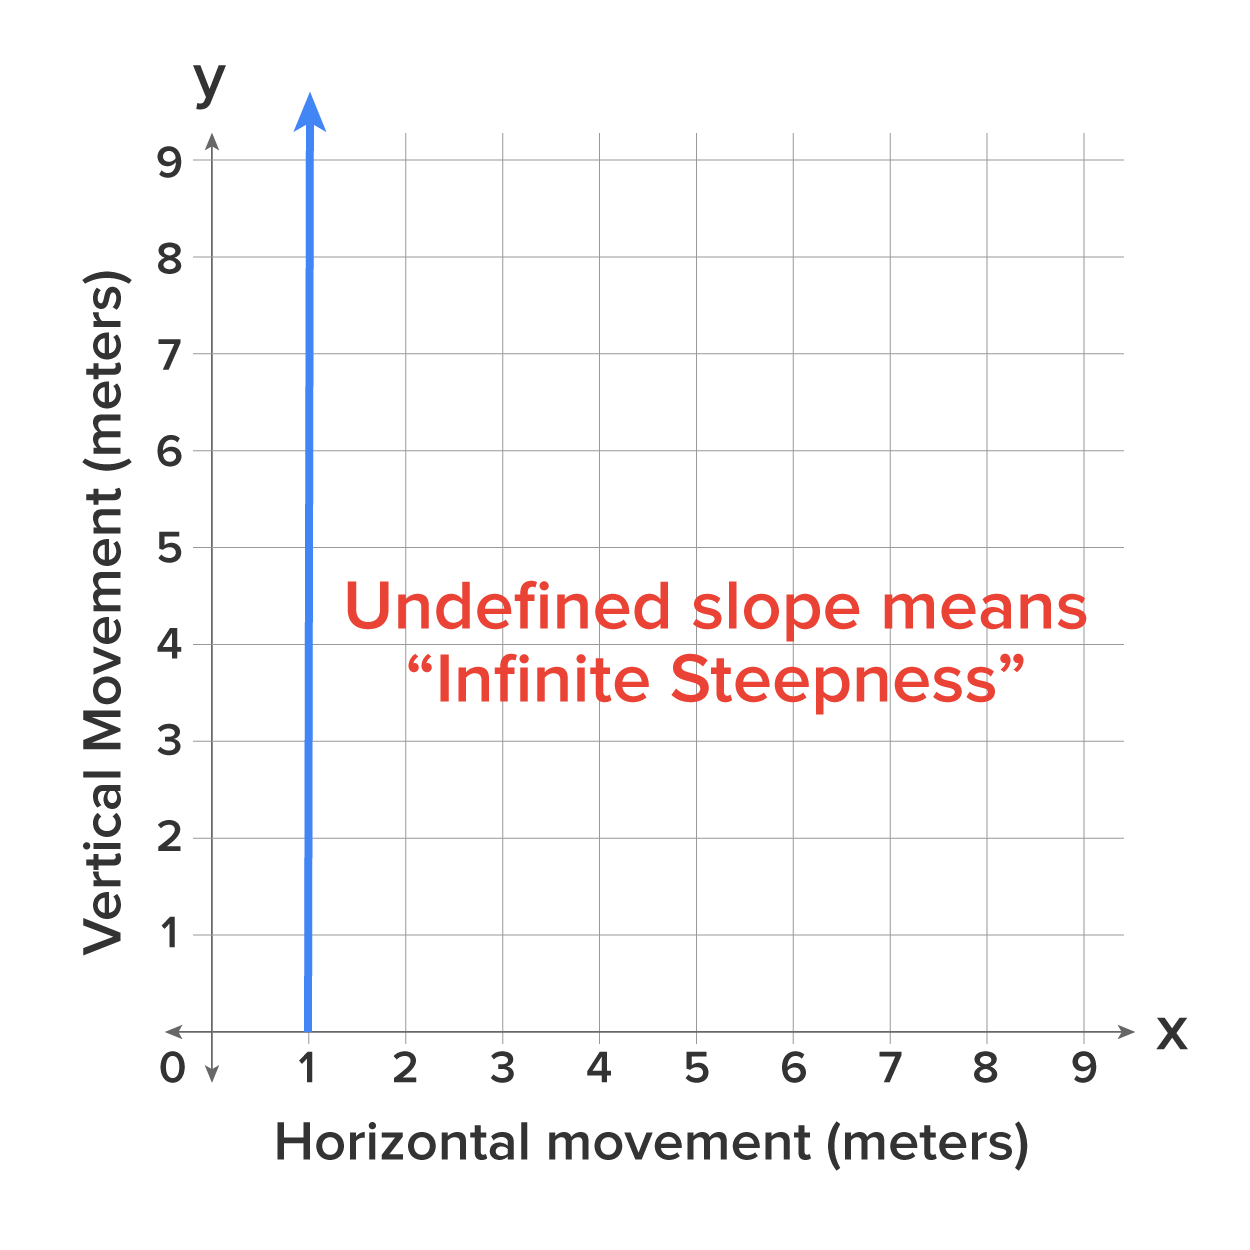
To calculate the slope, use the points (1, 1) and (1, 2), and label them accordingly. Substitute these values into the formula and simplify. This simplifies to 1 over 0, which is undefined because you cannot have 0 in the denominator of a fraction, because we cannot divide by zero. Therefore, the slope is undefined between any two points on the graph, because there is zero or no change in the x-coordinates between any two points.

As you can see, there is a big difference between having a zero slope and having no slope or undefined slope. Remember, slope is a measure of steepness.
Problem Solving: Skill Reflect |
Source: THIS TUTORIAL WAS AUTHORED BY SOPHIA LEARNING. PLEASE SEE OUR TERMS OF USE.
