Table of Contents |
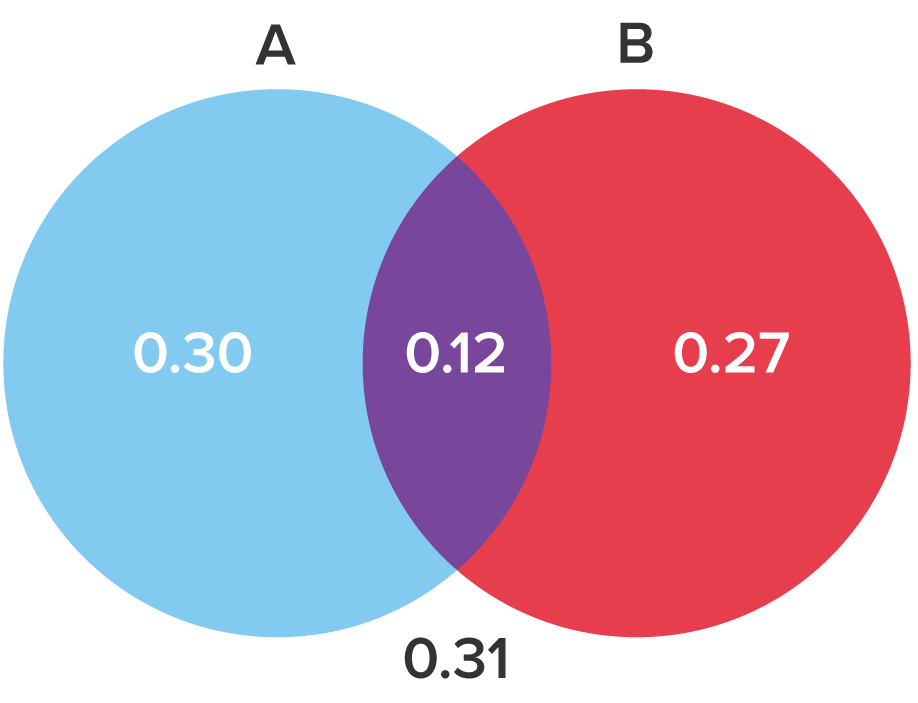
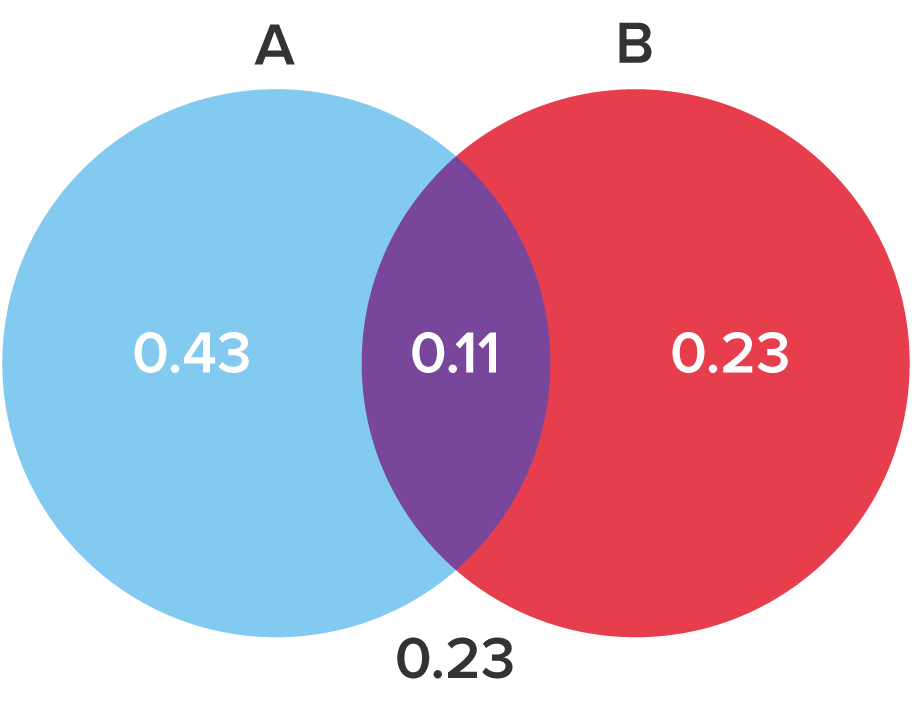
Let's see how we can calculate the “either/or” probability for overlapping events using data from Venn Diagrams.
EXAMPLE


Let's look at another example using a two-way table, shown below. Students in the middle school were asked about their dominant hand. Some are right-handed sixth graders, left-handed sixth graders, etc.
|
|
Dominant Hand |
|
|||
|---|---|---|---|---|---|
| Right | Left | Ambidextrous |
|
||
| Grade | 6th | 99 | 9 | 2 | 110 |
| 7th | 90 | 31 | 0 | 121 | |
| 8th | 93 | 11 | 3 | 107 | |
|
|
|
282 | 51 | 5 | 338 |
What's the probability that a student is either in eighth grade or left-handed?
The probability of being in eighth grade or left-handed is equal to the probability of being an eighth grader plus the probability of being a left-handed student minus the probability of both.

The other way to approach this is by simply adding up the cells that are either left-handed or eighth grade.
|
|
Dominant Hand |
|
|||
|---|---|---|---|---|---|
| Right | Left | Ambidextrous |
|
||
| Grade | 6th | 99 | 9 | 2 | 110 |
| 7th | 90 | 31 | 0 | 121 | |
| 8th | 93 | 11 | 3 | 107 | |
|
|
|
282 | 51 | 5 | 338 |
|
|
Dietary Preference |
|
|||
|---|---|---|---|---|---|
| Meat-Eater | Vegetarian | Vegan |
|
||
| Hair Texture | Curly Hair | 80 | 30 | 10 | 120 |
| Straight Hair | 100 | 50 | 20 | 170 | |
|
|
180 | 80 | 30 | ||
If a student is selected at random, what is the probability that the student is a girl who chose apple as her favorite fruit? Answer choices are rounded to the hundredth place.
Source: THIS TUTORIAL WAS AUTHORED BY JONATHAN OSTERS FOR SOPHIA LEARNING. PLEASE SEE OUR TERMS OF USE.

