Table of Contents |
There are many scenarios in which it is valuable to know the effectiveness of different antibiotics. For example, researchers may want to determine the best uses for a newly developed antibiotic. It may be helpful to determine which antibiotic is most likely to be effective for a particular patient, perhaps because an infection has been resistant to prior treatments or because the patient is prone to adverse effects of medications. Because antimicrobial resistance is so common, it is also important to know the frequency of antimicrobial resistance in particular species of microbes to help provide recommendations to medical professionals about the best treatments to use. There are a variety of tests available and this type of antimicrobial susceptibility testing (AST) is commonly performed at clinical laboratories.
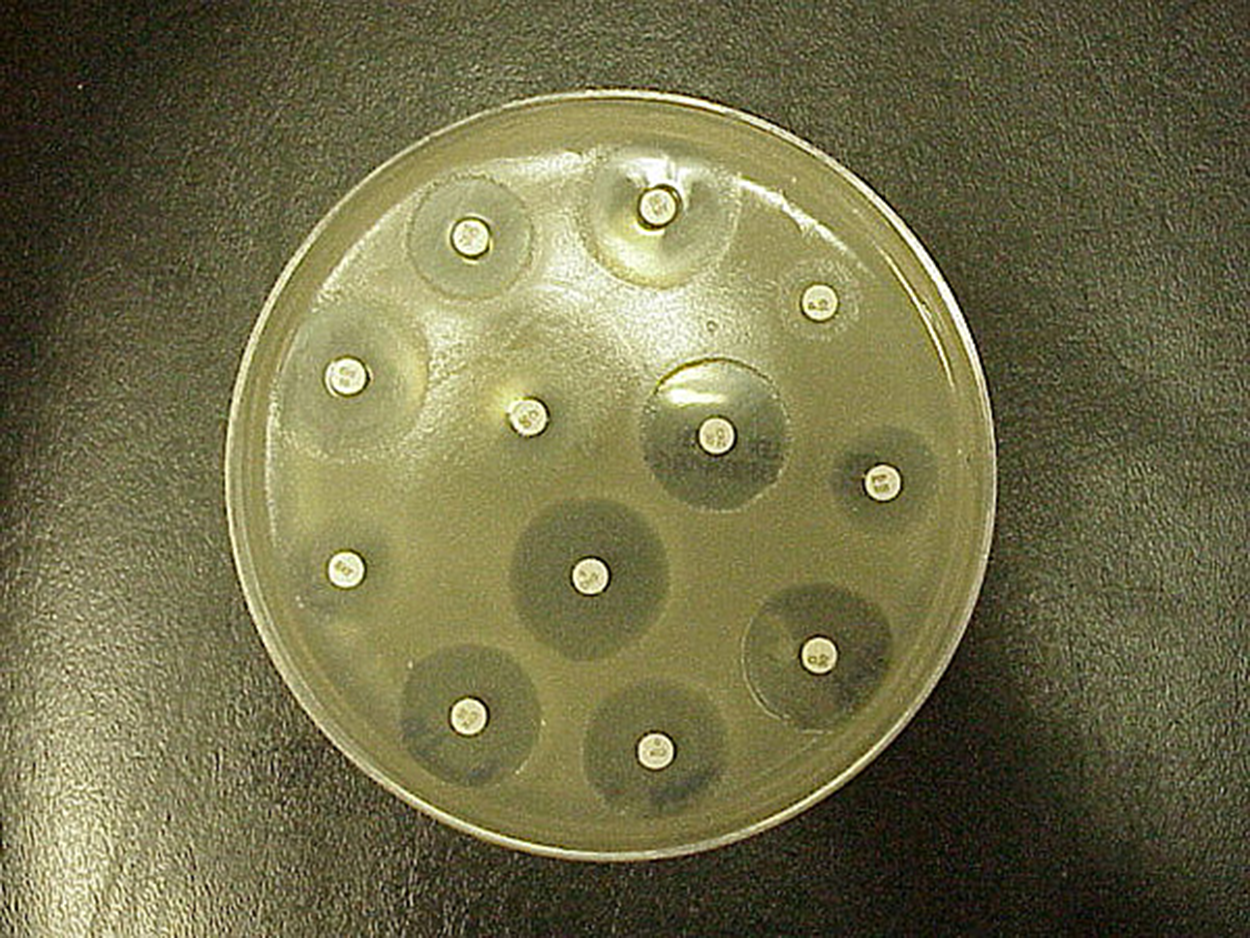
The Kirby–Bauer disk diffusion test is similar to the disk diffusion test that you learned about in another tutorial (in a previous tutorial, it was used to examine the susceptibility of microbes to different chemicals). This test is often used as a starting point to determine which antibiotics are most effective against particular microbes.
Although this test is a valuable starting point, it does not allow direct comparisons of antimicrobial potencies for several reasons. First, drugs differ in their solubility in agar and diffuse at different rates. Agar thickness affects the size of the zone of inhibition. Finally, the drug concentration impregnated onto the disk can vary. Without further testing beyond examining zones of inhibition, it is not possible to distinguish between bacteriostatic and bactericidal activity. Therefore, the zones of inhibition diameters can be compared to standardized tables to determine susceptibility but it is not possible to directly compare drug efficacy by comparing the sizes of the zones of inhibition.
The steps below describe the process for performing this test.

Although Kirby–Bauer disk diffusion tests can be very useful initial tests of susceptibility, they do not allow for a direct comparison of antibacterial potencies. For this type of comparison, antibacterial dilution tests can be used to determine a particular drug’s minimal inhibitory concentration (MIC), which the lowest drug concentration that inhibits visible bacterial growth, and its minimum bactericidal concentration (MBC), which is the lowest drug concentration that kills 99.9% or more of the starting inoculum.
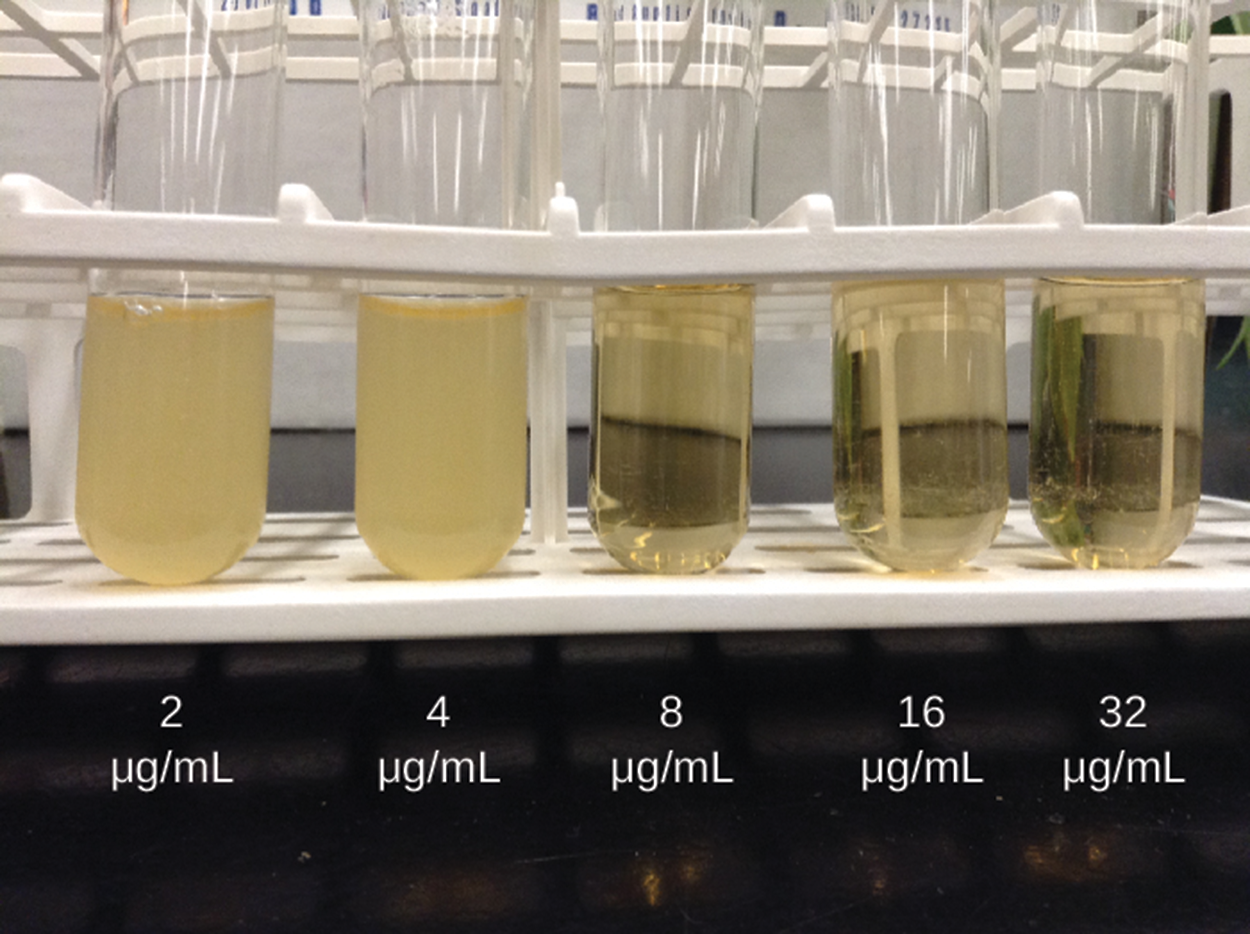
One approach is the macrobroth dilution assay. In this test, a dilution series of the drug in the broth is made in test tubes and the same number of cells of a test bacterial strain is added to each tube. The MIC is determined by examining the tubes to find the lowest drug concentration that inhibits visible growth (in other words, the lowest drug concentration at which the broth is clear instead of turbid). Tubes with no visible growth are inoculated onto agar media without an antibiotic to determine the MBC. Generally, serum levels of an antibacterial should be at least three to five times above the MIC for treatment of an infection.
The image below shows a macrobroth dilution assay. Five tubes are visible and range in concentration from 2 μg per ml on the left to 32 μg per ml on the right. The left two tubes (2 and 4 μg per ml) are turbid (cloudy) and the other three tubes (8, 16, and 32 μg per ml) are clear. The MIC for the example in the image below is 8μg per ml. Tubes are negative when the number of bacteria is too low to sufficiently lower the acidity and cause a color change. The probability of transferring a sufficient number of bacteria for a color change decreases as the initial concentration goes down.

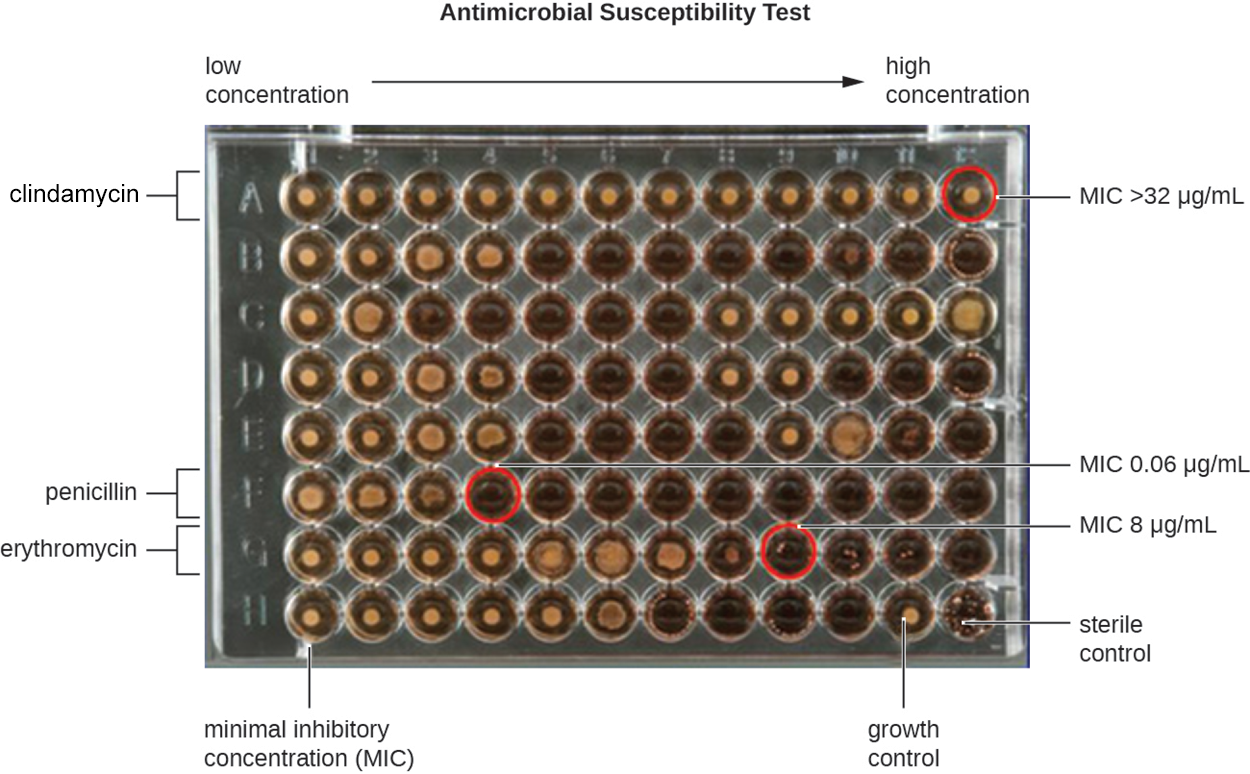
Another approach, shown below, is to use a 96-well microdilution tray. These trays have very small wells, so very small quantities of test antimicrobial can be added to each well and automated dispensing devices can be used. These also allow multiple antimicrobials or pathogens to be tested in a single tray. The tray below shows wells ranging from low concentration on the left to high concentration on the right. Rows are labeled to show that clindamycin, penicillin, and erythromycin are being tested. Wells representing the MIC for each antibiotic are circled and represent the first clear well following wells showing growth to their left. For clindamycin, the right-hand well shows growth and the label indicates that the MIC is above the concentration in this well of 32 μg per ml.

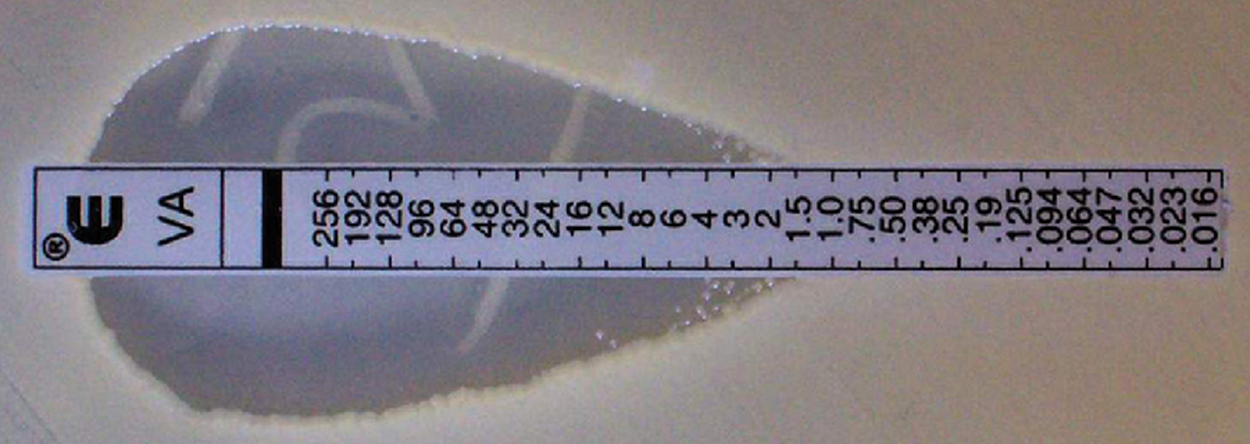
Another option is an E test, shown in the image below. A lawn of bacterial isolate is inoculated onto the surface of an agar plate. A plastic strip, shown horizontally in the figure, is impregnated with a gradient of an antibacterial. The zone of inhibition is elliptical because the concentration of antibacterial increases toward one side. The intersection of the elliptical zone with the gradient on the drug-containing strip indicates the MIC. Multiple strips containing different antibacterials can be used on the same plate. However, a limitation of this test is that it cannot be used alone to determine the MBC. As with the Kirby–Bauer disk diffusion test, antibacterials vary in how quickly they move through agar, their solubility, and other factors, and the absence of growth can represent inhibition of bacterial growth rather than death of bacteria.

Source: THIS TUTORIAL HAS BEEN ADAPTED FROM OPENSTAX “MICROBIOLOGY.” ACCESS FOR FREE AT openstax.org/details/books/microbiology. LICENSE: CC ATTRIBUTION 4.0 INTERNATIONAL.