Table of Contents |
First, recall the definitions of domain and range. The domain of a function is the set of all possible values that can be used as inputs to a function. The range of a function is the set of all possible outputs that can be obtained from a function.
First, we’ll focus on finding the domain of a function when given its equation. This is mostly straightforward for functions having certain forms.
Given an equation of a function, the domain can be determined by a variety of factors.
EXAMPLE
Find the domain of the function
 contains no fraction with a variable denominator. contains no radicals.
  Thus, the domain of is the set of all real numbers. Using interval notation, this is written as

EXAMPLE
Find the domain of the function is undefined when
  Solve this equation to find the specific values of x.
 is undefined when
  or when
 This could be written as
  Using interval notation, the domain is written as
 is undefined for any values of x where the denominator is equal to 0. Setting
  gives
gives  is the set of all real numbers, excluding
  is
is 
Now we’ll look at functions that contain radicals with even roots (square roots, 4th roots, etc.).
EXAMPLE
Find the domain of the function Express the domain using interval notation.


 is written as
  Thus, the domain of the function is
 is a radical function with an even root, the domain is the set of all real numbers for which the radicand is nonnegative.

 or
or  is
is 
Since we just looked at functions that contain radicals with even roots, we’ll now examine functions that contain radicals with odd roots.
EXAMPLE
Find the domain of the function Express the domain using interval notation.
is the set of all real numbers. Using interval notation, this is expressed as
Express the domain using interval notation.
is the set of all real numbers. Using interval notation, this is expressed as
 is a radical function with an odd root, and the radicand,
  is never undefined, the domain of is the set of all real numbers. Using interval notation, this is expressed as
Here is an example that combines a few ideas.
EXAMPLE
Determine the domain of the function


 and More simply stated, the domain is

It is not always convenient to find the domain of a function given only its equation. The graph of the function can be very useful in determining both the domain and the range of a function.
Recall that the graph of a function is a visual representation of all solutions to an equation. Recall also that the domain is the set of all possible inputs of a function. On a graph, these are represented as values on the x-axis. Likewise, the range is the set of all output values of a function, which are shown as values on the y-axis.
For instance, consider the graph shown below.
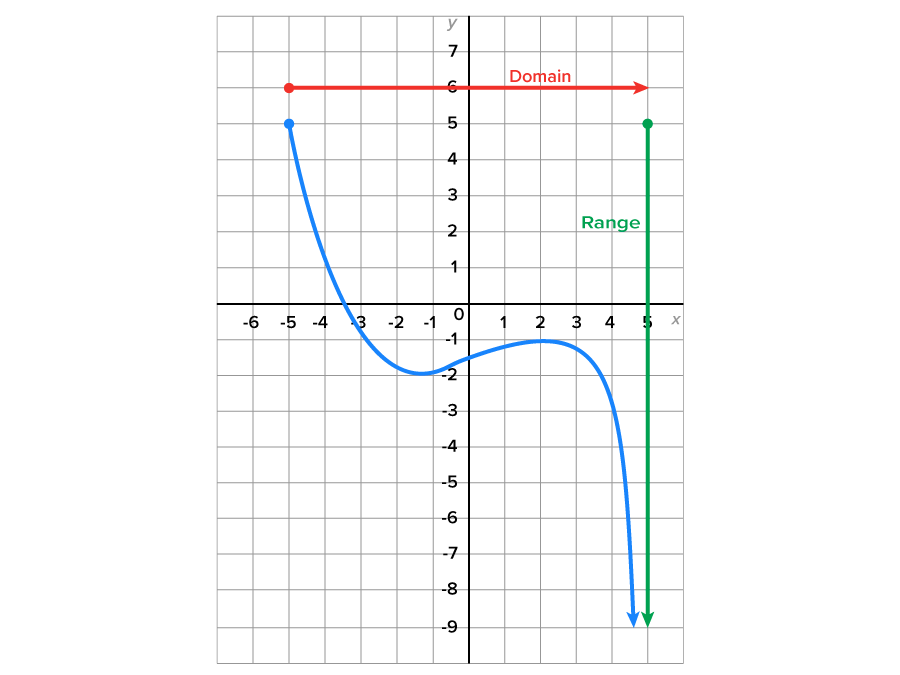

 Looking at the graph vertically, all y-values that are lower than 5 are also represented on this graph. Thus, the range of the function is
EXAMPLE
Determine the domain and range of the function whose graph is shown below.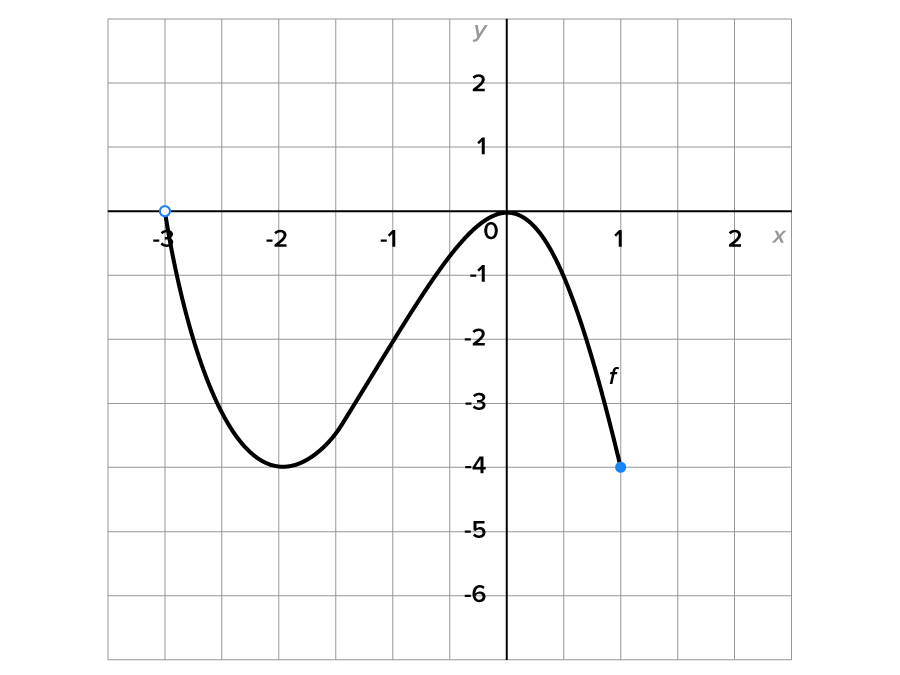
 is an open circle. This means that
  is not included. The rightmost point on the graph is
  which is solid, meaning it is included. The domain of this function is
 and
and  ), while the highest y-value is 0 (located at
  ). The range of this function is
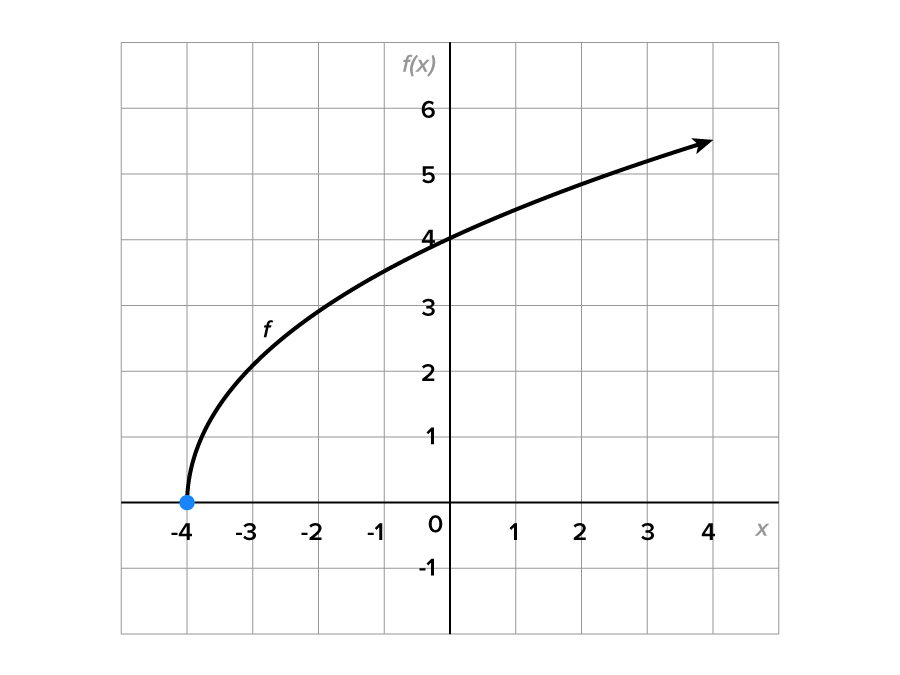
 From what we know about the domain already, it should be the set of all real numbers. However, in this situation, it makes no sense for x to be a negative number, since x is the number of pounds. Therefore, a more sensible domain is
SOURCE: THIS TUTORIAL HAS BEEN ADAPTED FROM 1) CHAPTER 0 OF "CONTEMPORARY CALCULUS" BY DALE HOFFMAN. ACCESS FOR FREE AT WWW.CONTEMPORARYCALCULUS.COM. LICENSE: CREATIVE COMMONS ATTRIBUTION 3.0 UNITED STATES. 2) OPENSTAX "PRECALCULUS” BY JAY ABRAMSON. ACCESS FOR FREE AT OPENSTAX.ORG/DETAILS/BOOKS/PRECALCULUS-2E. LICENSE: CREATIVE COMMONS ATTRIBUTION 4.0 INTERNATIONAL.


