Use Sophia to knock out your gen-ed requirements quickly and affordably. Learn more
×

Distributions

Author: Sophia

what's covered
This tutorial will cover the topic of distributions. Our discussion breaks down as follows:

Table of Contents

1. Distributions

A data set is not just a random list of numbers or values; there is some context associated with it, usually the units, or what type of measurement is used, or perhaps some kind of descriptor. Usually, multiple variables comprise the data set.

A variable is any single characteristic of the individual members of the population that can be measured. A variable of interest can take on different values for each member of the population.

EXAMPLE

For example, suppose we are interested in the variable of height for a group of people. This could vary from person to person because people have different heights.

A distribution is a way to visually show how many times a variable takes a certain value; it is the values the variable takes and how often they show up. There are many kinds of distributions:

Types of Distributions Description Examples
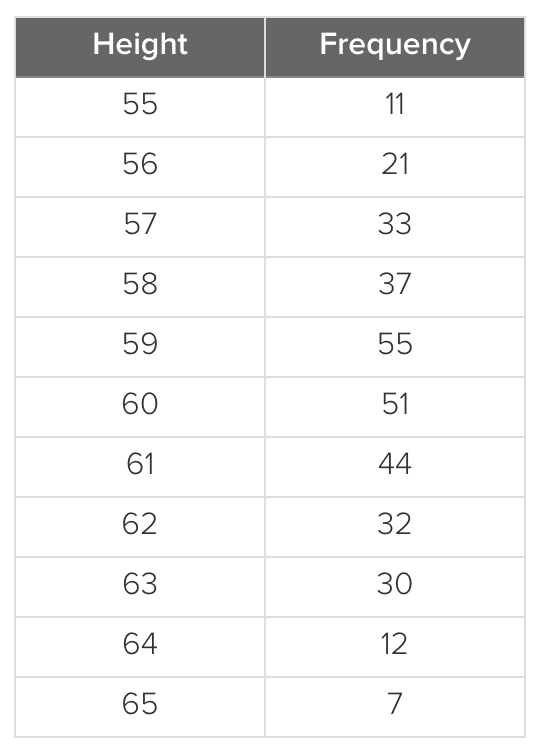
Frequency Tables These can visually show how often a variable takes on a certain value. A table with two columns labeled 'Height' and 'Frequency.' The rows are as follows: height 55, frequency 11; height 56, frequency 21; height 57, frequency 33; height 58, frequency 37; height 59, frequency 55; height 60, frequency 51; height 61, frequency 44; height 62, frequency 32; height 63, frequency 30; height 64, frequency 12; height 65, frequency 7.
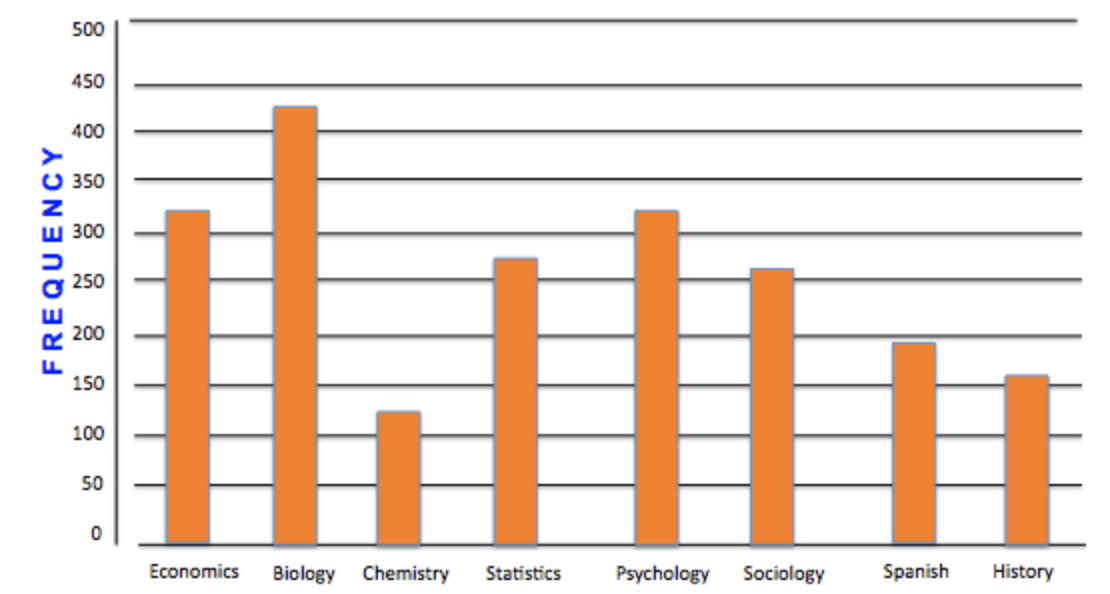
Qualitative Data The variables in these distributions are categories. A bar chart in which the vertical axis is labeled ‘FREQUENCY’ and has values ranging from 0 to 500 in increments of 50 and the horizontal axis has these labels: Economics, Biology, Chemistry, Statistics, Psychology, Sociology, Spanish, and History. A single bar rises from each of these points. The height of the bars is listed here—Economics: 320, Biology: 435, Chemistry: 120, Statistics: 270, Psychology: 320, Sociology: 260, Spanish: 190, and History: 160.
Bar Graphs
Pie Charts
Dot Plots
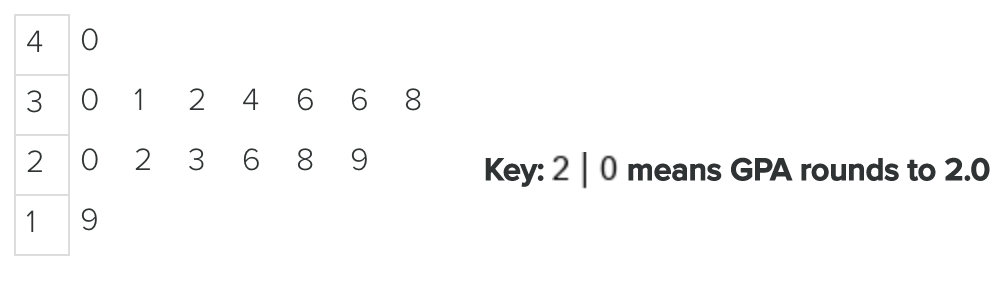
Quantitative Data The variables in these distributions are measures of values or counts. A stem-and-leaf plot showing GPAs, with the stems on the left labeled 4, 3, 2, and 1 and listed vertically. To the right of each stem are the values as follows—stem 4: 0; stem 3: 0, 1, 2, 4, 6, 6, and 8; stem 2: 0, 2, 3, 6, 8, and 9; and stem 1: 9. The statement ‘Key: 2
Stem-and-Leaf Plots
Dot Plots
Histograms
Line Charts
Time-Series Diagrams
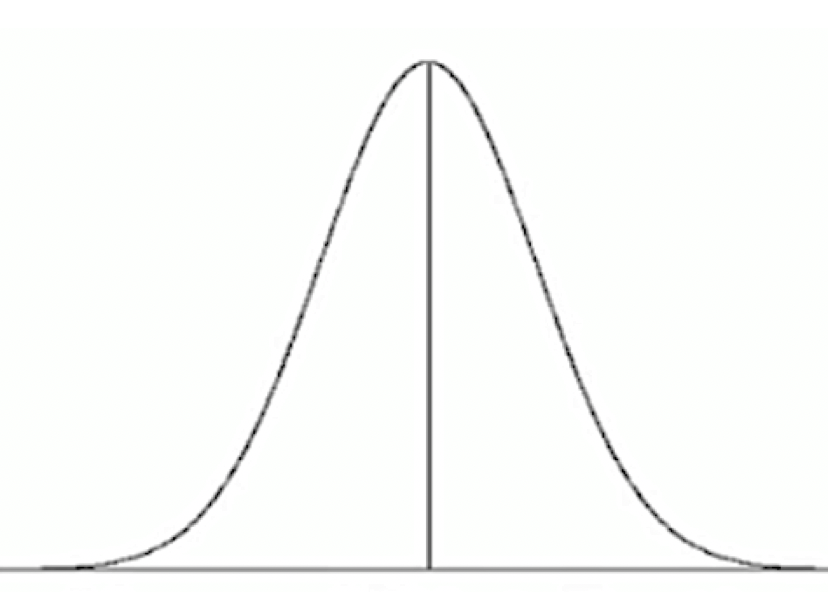
Mathematical Rules These can visually show variables through a certain pattern and are not strictly data driven. A bell curve with normal distribution. A vertical line is drawn at the center of the curve from the peak of the curve down to the horizontal axis.
Normal Distribution
Poisson Distribution

terms to know
Data Set
A collection of responses or observations associated with a particular context and collected from a sample or population.
Variable
A measurable factor, characteristic, or attribute of an individual or a system.
Distribution
A way to visually display the values a variable takes and how often it takes each value.

2. Matching Distribution Types to Data Sets

Why are there so many different kinds of distributions? The point of a distribution is to make the data—possibly a large data set that is unwieldy—simpler to understand. You want to make it easy for yourself and your readers to understand. Therefore, different kinds of distributions will lend themselves better to different types of data sets.

EXAMPLE

A dot plot is better for data that is close together and doesn't have a lot of values, whereas certain other distributions are better for larger data sets. A histogram is better than a dot plot when the data is very spread out.

You can determine which kind of distribution to use based on the kind of data you have.

big idea
Each distribution has its own situation for which it is ideal. The data will determine which distribution is best to use.

summary
There are many types of distributions. The point of all of them is to visually display your data so the reader can take a large data set and succinctly understand what is going on with it. Some distributions contain every observation or data point, and some only contain summaries; you can match your distribution types to the data set. Each type of distribution discussed here can be explored further in its own tutorial.

Good luck!

Source: THIS TUTORIAL WAS AUTHORED BY SOPHIA LEARNING. PLEASE SEE OUR TERMS OF USE.

Terms to Know
Data Set

A collection of responses or observations associated with a particular context and collected from a sample or population.

Distribution

A way to visually display the values a variable takes and how often it takes each value.

Variable

A measurable factor, characteristic, or attribute of an individual or a system.