In this lesson, you will learn about the two different types of uniform distributions and how they can be applied in business data analytics applications. Specifically, this lesson will cover:
1. Uniform Distributions
Uniform distributions are a type of probability distribution where all outcomes are equally likely. This means that every possible outcome has the same chance of occurring.
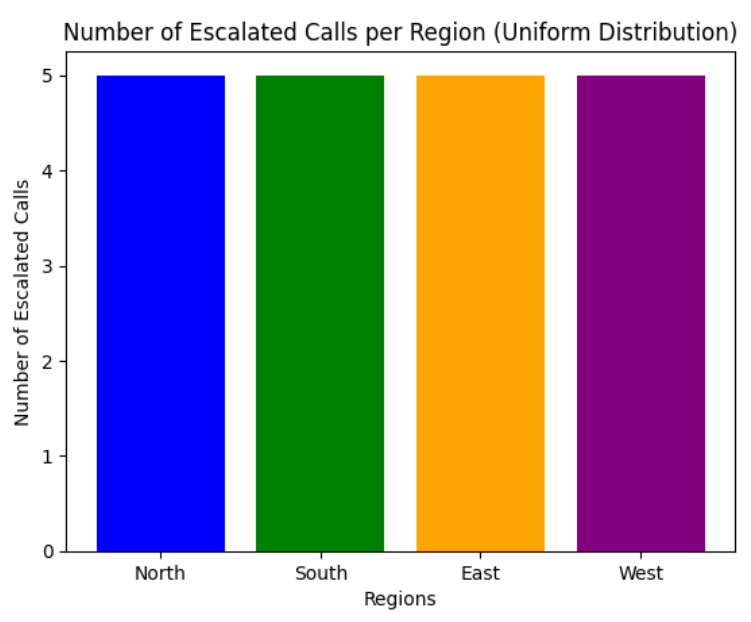
Consider an example of a call center where customer service calls are escalated from different regions of the country, and each region has an equal likelihood of having an escalated call. Assume there are four regions: North, South, East, and West.
In a uniform distribution, all outcomes are equally likely, meaning each region should have the same number of escalated calls over a large number of customer calls. The bar chart below shows 20 calls that were escalated and are equally distributed (5 calls per region) across the four regions. The bar chart reflects the uniform distribution where each outcome (escalated call in a region) is equally likely.
There are several applications in which uniform distributions can be applied in business data analytics, such as:
-
Random Selection of Employees. Consider a company that wants to randomly select one of its employees for a special training program. If the company has 100 employees and each one has an equal chance of being selected, this scenario follows a uniform distribution. This ensures fairness and equal opportunity for all employees.
-
Transaction Distribution Analysis. A retail company wants to analyze the distribution of customer transactions across its three main product categories: Electronics, Clothing, and Groceries. For simplicity, presume that each transaction is equally likely to fall into any of these three categories. Since there are three product categories and each category is equally likely to be chosen, the type of transaction distribution is uniform.
Uniform distributions can be continuous or discrete.
-
- Uniform Distribution
- Type of probability distribution in which all outcomes are equally likely.
1a. Discrete Uniform Probability Distribution
When the possible probabilities of a discrete probability distribution are all the same, then the probability distribution is known as a discrete uniform probability distribution.
The probability for a discrete uniform probability distribution is  where n is the number of unique values that the discrete random variable can take on.
-
EXAMPLE
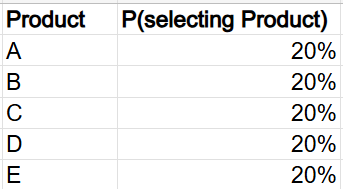
Suppose you are a data analyst for a retail store that sells five different types of products: A, B, C, D, and E. The store wants to ensure that each product has an equal chance of being selected for a special promotional display.
The store decides to randomly select one product for the promotional display each week. Since the selection is random and each product has an equal chance of being chosen, the discrete probability distribution is uniform. The probability that any one specific product is chosen is

The discrete probability distribution is shown below.
This analysis allows you to ensure that the promotional display is fair and unbiased, giving each product an equal opportunity to be featured. Over time, you can track the sales performance of each product when it is featured in the promotional display. This can help you understand the impact of promotions on different products.
If you notice that product C consistently performs better in sales when featured in the promotional display, you might decide to feature it more frequently or investigate what makes it more appealing to customers.
How could you use Excel to assist you with this product selection scenario? Let’s look!
-
EXAMPLE
In the Excel file named
product_selection.xlsx, the discrete probability distribution has been created for you in columns A and B.
You can use Excel to assist you in randomly selecting a product for the promotional display for any given week. You are going to generate 100 weeks of random product selections.
When you complete your analysis, your counts will be different than those shown in the screenshot below, because the numbers are randomly generated.
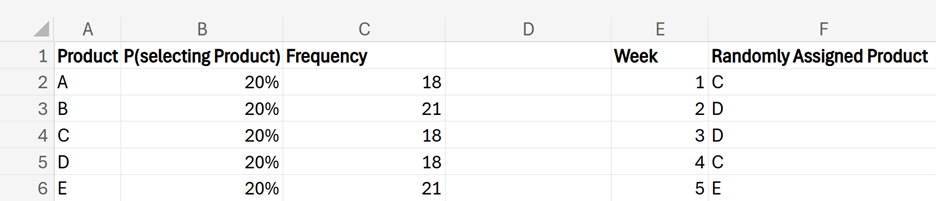
1. Create a new column named
Week in cell E1. In cell E2, enter the number 1. Then, in cell E3, enter the following formula:
=E2+1
Drag this formula down to cell E101 to create a numerical identifier for each week.
You are now going to use the INDEX() and RANDBETWEEN() Excel functions to generate the random products.
2. Create a new column named
Randomly Assigned Product in cell F1. In cell F2, enter the following formula:
=INDEX(A2:A6, RANDBETWEEN(1,5))
The RANDBETWEEN(1,5) part of the formula generates a random integer from 1 to 5, inclusive.
The INDEX() function returns the value of an element in a table or array, selected by the row and column number indexes. In this case, A2:A6 is the range from which we want to retrieve a value (a value in the
Products column).
The two functions work together by the RANDBETWEEN(1,5) function, generating a random number between 1 and 5. This random number is then used as the row index for the INDEX() function. The INDEX() function looks at the range A2:A6 (the
Products column) and returns the value from the row corresponding to the random number generated. That is, the two functions return a randomly selected product.
By using the INDEX() and RANDBETWEEN() functions, each product has an equal chance of being selected. This simulates a discrete uniform probability distribution where each product is equally likely to be chosen.
3. If you want to simulate multiple selections, you can drag the formula in cell F2 down to as many rows as you need. For example, since you are simulating products for 100 weeks, drag the formula down to F101.
Make sure to change the formula to use an absolute reference for the products in rows 2 through 6 in column A. The $ signs create the absolute row and column reference to lock the formula, so you are always selecting products in the range of A2 through A6 when you copy the formula across multiple cells.
=INDEX($A$2:$A$6, RANDBETWEEN(1,5))
4. You can use the COUNTIF() function to count how many times each product was selected. Create a new column named
Frequency in cell C1.
5. In cell C2, enter the following formula:
=COUNTIF(F2:F101,A2)
This formula counts the number of randomly selected A products.
6. In cells C3 through C6, count the number of randomly selected products for products B through E.
- cell C3: =COUNTIF(F2:F101,A3) counts number of randomly selected B products
- cell C4: =COUNTIF(F2:F101,A4) counts number of randomly selected C products
- cell C5: =COUNTIF(F2:F101,A5) counts number of randomly selected D products
- cell C6: =COUNTIF(F2:F101,A6) counts number of randomly selected E products
Notice that in the
Frequency column, you will not obtain the exact number of counts for each category after using INDEX() and RANDBETWEEN() because these functions generate random selections, which can lead to slight variations in the counts.
The Excel formulas used in the worksheet are shown below.
To manage the randomness of the RANDBETWEEN() function in Excel, once you generate the random numbers, you can copy and paste the random numbers as values. This way, the numbers will not change every time the worksheet recalculates. Copy the column of random numbers. Then, right-click on the selected cell where you want to paste the values, select
Paste Special, and select
Values.
This type of copy and paste will replace the formulas with the actual numbers, ensuring they remain constant and do not change with each recalculation.
-
Suppose you are a data analyst for a marketing firm. You need to randomly allocate different marketing campaigns to various regions.
Using the
marketing_campaign_allocation.xlsx file, apply the INDEX() and RANDBETWEEN() functions to randomly assign each region a marketing campaign.
How many times was each marketing campaign assigned to each region?
Answer: The answers will be different because of the random component of the RANDBETWEEN() function.
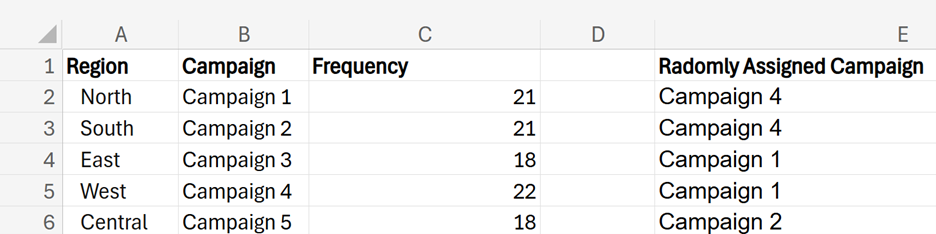
The image below shows the Excel formulas used.
1. Create a new column named
Randomly Assigned Campaign in cell E1.
2. In cell E2, enter the following formula:
=INDEX($B$2:$B$6, RANDBETWEEN(1,5))
RANDBETWEEN() generates each campaign number with equal probability, so each campaign has an equal chance of being assigned to any region.
3. Drag the formula down to cell E101.
4. Count the number of times each campaign was assigned to a different region. Create a new column named
Frequency in cell C1.
5. Use the COUNTIF() function to find the number of times each marketing campaign was assigned to each region. Due to the random nature of the RANDBETWEEN() function, your numbers will be different than those shown in the screenshot below.

This problem illustrates the discrete uniform probability distribution because each campaign has an approximately equal chance of being assigned to any one of the 100 regions. Due to the random nature of the Excel functions, the probabilities will be approximately equal to 20%. For example:
Probability that Campaign 1 is assigned to a particular region is

Probability that Campaign 2 is assigned to a particular region is
…
Probability that Campaign 5 is assigned to a particular region is

-
- Discrete Uniform Probability Distribution
- Type of probability distribution where a finite number of outcomes are equally likely.
1b. Continuous Uniform Probability Distribution
Continuous probability distributions display all values of a continuous random variable with their associated probabilities. A continuous uniform probability distribution is a type of probability distribution where all outcomes are equally likely within a certain range. Continuous distributions deal with continuous variables that can take on values within an interval or over a range of values.
The key characteristics of a continuous uniform probability distribution are:
-
Equal Probability: Every value within the specified range has an equal chance of occurring.
-
Defined Range: The distribution is defined by a minimum value (a) and a maximum value (b). The probability of any value outside this range is zero.
-
Probability Distribution Function: The distribution of a continuous uniform distribution is a constant value, indicating that the probability is uniformly spread across the range.
Imagine you have a perfectly flat and even field. If you were to spread seeds evenly across this field, every part of the field would receive the same number of seeds. This is like how a continuous uniform distribution works: every value within a certain range is equally likely.
Now, to describe how evenly the seeds (or probabilities) are spread, we use a simple formula. This formula tells us the density or how much probability is packed into each part of the range.
For a continuous uniform distribution, the density, which is denoted as  , is given by the formula:

where

and
b are the endpoints of the range and
is the density, which is the same everywhere within the range. So, just like spreading seeds evenly across a field, this formula shows that the probability is spread evenly across the range from
to
b. Let’s visualize this concept.
A way to visualize the continuous uniform distribution is provided in the figure below.
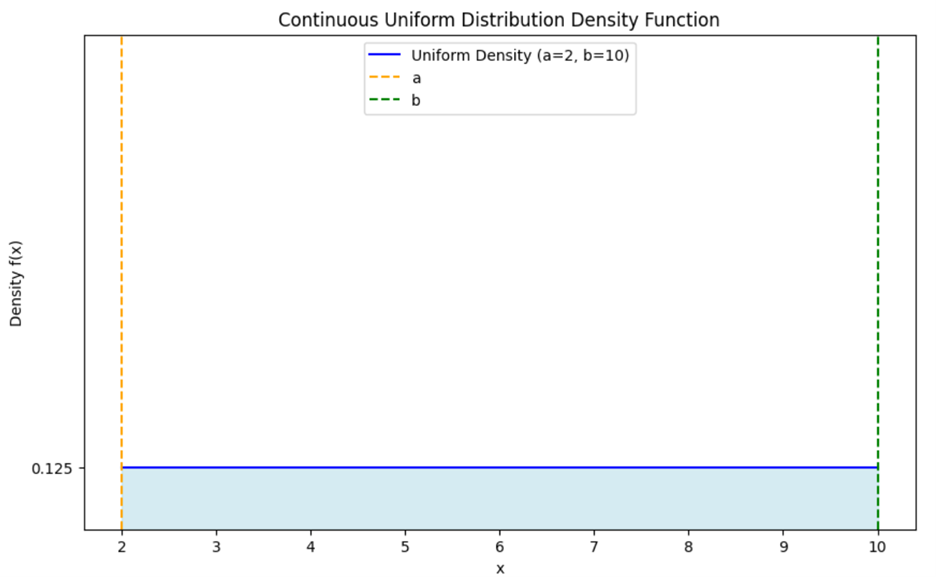
In this case,  and
and  so the width of an interval is
  The density is:

The value

represents the height of the
density function across the interval

. This height indicates that the probability is uniformly spread across the interval, with each small segment of the interval having an equal chance of being selected.
The light blue shaded area under the line,  represents the probability of the continuous uniform distribution over the interval
  which in this case is
  The total area under the line represents the total probability, which is always 1 for a probability distribution.
Since the density is constant at 0.125 and the interval length is 8, the total area is:

IN CONTEXT

You have a garden that needs to be watered evenly. You have a hose that sprays water uniformly across the garden. The garden is a rectangular plot, and you want to ensure that every part of the garden gets the same amount of water.
-
Garden as the Interval
Think of your garden as the interval  in a continuous uniform distribution. The garden has a starting point
  and an ending point (b).
-
Water Spray as the Density
The water spray from the hose represents the density function. If the hose sprays water uniformly, it means that every part of the garden receives water at the same rate. This is like how, in a continuous uniform distribution, every value within the interval has an equal likelihood (or density).
-
Equal Distribution
Just as the water is spread evenly across the garden, in a continuous uniform distribution, the density is spread evenly across the interval. This means that any small section of the garden (or interval) gets the same amount of water (or probability).
-
- Continuous Probability Distribution
- A listing of the possible values of a continuous random variable and the associated probabilities.
- Continuous Uniform Probability Distribution
- Type of probability distribution in which all outcomes in a specified range are equally likely.
- Density Function
- A function that describes the probability of a continuous random variable taking on values in a specific range.
1c. Finding Probabilities for Continuous Uniform Probability Distributions
Imagine you have a garden that needs to be watered evenly. The garden is a rectangular plot that spans from  to
to  You want to ensure that every part of the garden gets the same amount of water. The water density is uniform across the garden and is represented by the horizontal line

To find the probability of a continuous random variable falling within the interval, follow these steps.
1. Identify the Interval:
- Determine the specific range
 within the interval for which you want to find the probability.
2.
Calculate the Length of the Interval:
- Find the length of the interval by subtracting c from d:

3.
Use the Density:
- The density value
 is constant across the interval
4.
Calculate the Probability:
- Multiply the length of the interval by the density


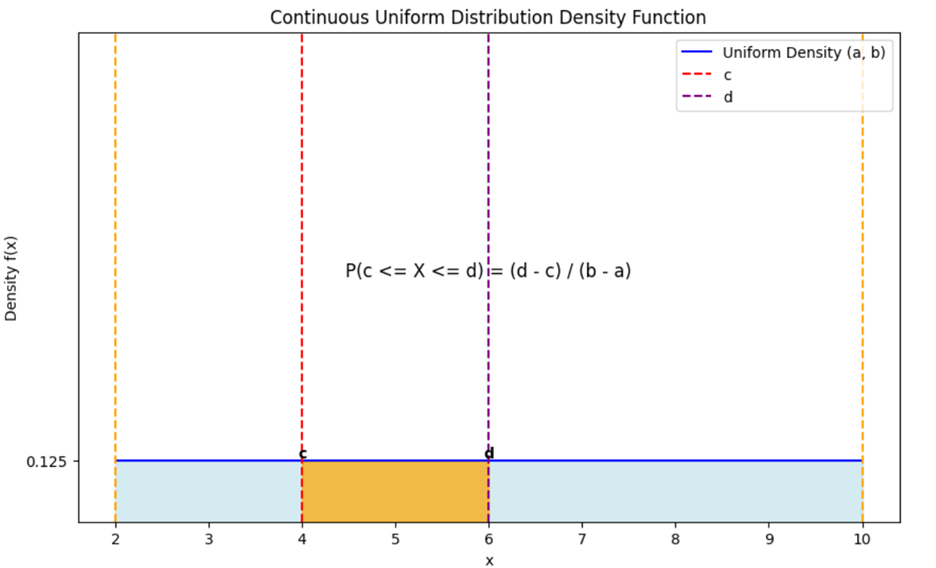
Let’s look at an example of how you can apply these steps.
-
EXAMPLE
Let’s say you want to find the probability that a randomly chosen point in the garden lies between 4 and 6.
1.
Identify the Interval:
- The interval is

2.
Calculate the Length of the Interval:
3.
Use the Density:
- The density value is
4.
Calculate the Probability:
So, the probability that a point falls between 4 and 6 in the garden is 0.25, or 25%.
If you think about this probability from a visual perspective, you can use the graph above to determine:
- The interval
 would be a segment along the x-axis.
- The area under the curve (which is a rectangle in this case) from
 to
to  represents the probability.
- The height of the rectangle is
 and the width is 2.
- The area of this rectangle is
 which gives the probability.
Let’s apply the continuous uniform distribution to a real-world business data analytics scenario.
-
EXAMPLE
You are a data analyst at a food delivery company called QuickEats. Your manager has asked you to analyze the delivery times to ensure that the service meets customer expectations. The company promises that deliveries will take between 30 and 60 minutes. You can assume that all delivery times within this range are equally likely. You need to determine the probability that a delivery will take between 35 and 40 minutes to help the marketing team create accurate promotional materials.
The distribution of delivery times for the example is shown below, and the area shaded in orange is the probability you need to find.
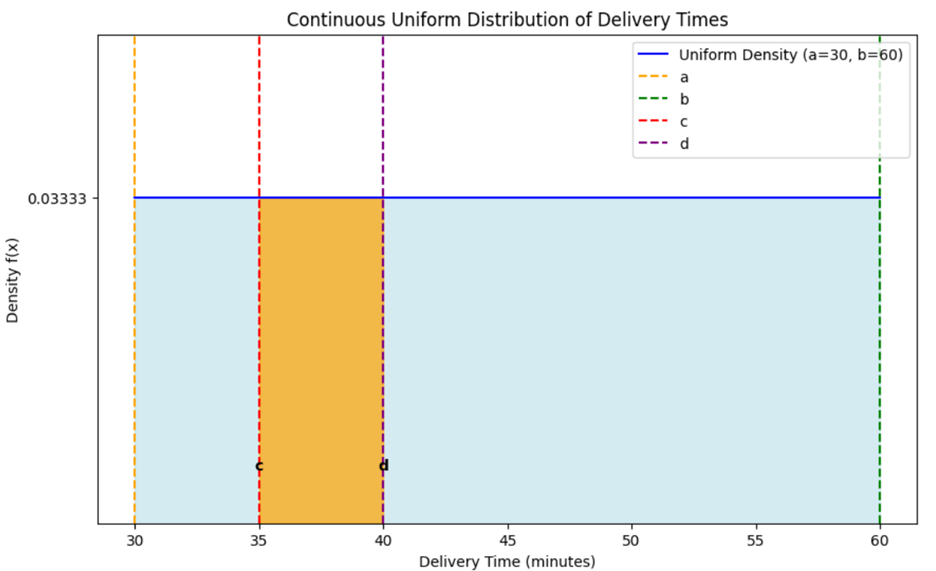 X
X is a continuous random variable that denotes the delivery time.
To find the probability that a delivery time will take between 35 and 40 minutes, perform the following using the graph:
1.
Identify the Interval:
- The interval is

2.
Calculate the Length of the Interval:
3.
Use the Density:
- The density value is

- The minimum delivery time is
 which is 30 minutes.
- The maximum deliver time is b, which is 60 minutes.
4.
Calculate the Probability:
-

-

- The probability that a delivery takes between 35 and 40 minutes is 17%.
As an analyst at QuickEats, you have determined that the probability of a delivery taking between 35 and 40 minutes is 17%. This information can now be used by the marketing team to set realistic expectations for customers and improve overall satisfaction.
-
You are a data analyst at a customer service call center called HelpDesk Solutions. Your manager has asked you to analyze the wait times for customers calling into the center. The company aims to keep wait times between 2 and 10 minutes. You can presume that wait times are uniformly distributed between 2 and 10 minutes.
-
Follow along with this video to calculate the probability of a uniform probability distribution.
1d. Compare and Contrast Discrete and Continuous Uniform Probability Distributions
The way the probabilities are calculated differs based on whether you have a discrete or continuous uniform probability distribution scenario. Choosing the correct distribution ensures that the probabilities you provide to others in an organization are accurate. For example, using a discrete uniform distribution for customer counts and a continuous uniform distribution for time measurements. Below is a table that summarizes the similarities and differences between discrete and continuous uniform probability distributions.
|
Aspect
|
Discrete Uniform Probability Distribution
|
Continuous Uniform Probability Distribution
|
|
Nature of outcomes
|
Finite and countable (number of customers to participate in survey, number of products for quality control testing)
|
Infinite and uncountable within a specified range (time intervals, measurements)
|
|
Uniformity
|
All outcomes are equally likely.
|
All values within a range or interval are equally likely.
|
|
Probability calculation
|
Each outcome has a fixed probability of where n is the total number of outcomes.
|
Density formula is used to find probability within a certain interval or range.
|
|
Applications in business
|
Assigning customers to marketing campaigns, random product inspections
|
Estimating time intervals for processes, specifications for parts like diameter ranges of rods for an airplane
|
In this lesson you explored two types of uniform distributions: discrete uniform probability distributions and continuous uniform probability distributions. A discrete uniform probability distribution applies to scenarios where a finite number of outcomes are equally likely. Ensuring that products receive an equal chance of a marketing promotion or the allocation of marketing campaigns to regions of the country are both applications of discrete uniform probability distributions. In contrast, a continuous uniform probability distribution applies to scenarios where outcomes are continuous and equally likely within a specified range, such as time intervals. Determining probabilities for how long a customer will have to wait for a delivery or how long a customer will wait on hold when they call a call center are both applications of continuous uniform probability distributions.


