 . Specifically, this lesson will cover:
Table of Contents |
When you see the title of this challenge, it might sound familiar. That is because we explored how to estimate the slope of a tangent line in a previous challenge! In this challenge though, we will review those skills as well as introduce new notation and definitions to help go further into calculus.
Recall the following formula for slope:

 .
.
EXAMPLE
Consider the function whose graph is shown below.

 . By the sketch, it passes through the points (0, 0) and (1, -1). Using the slope formula , the approximate slope is
  .
.
 . Since this line appears to be horizontal,
  .
.
In the previous example, note how the slope of the tangent line changes as x changes. This tells us that the slope of the tangent line itself is a function of x. Instead of saying “the slope of a tangent line function,” we have a more elegant name for this important aspect of a function.
Now, let’s look at a more familiar function and the slopes of tangent lines at certain points.
EXAMPLE
Consider the function . Let’s graphically estimate the derivative (slope of the tangent line) of
  when
when  .
.
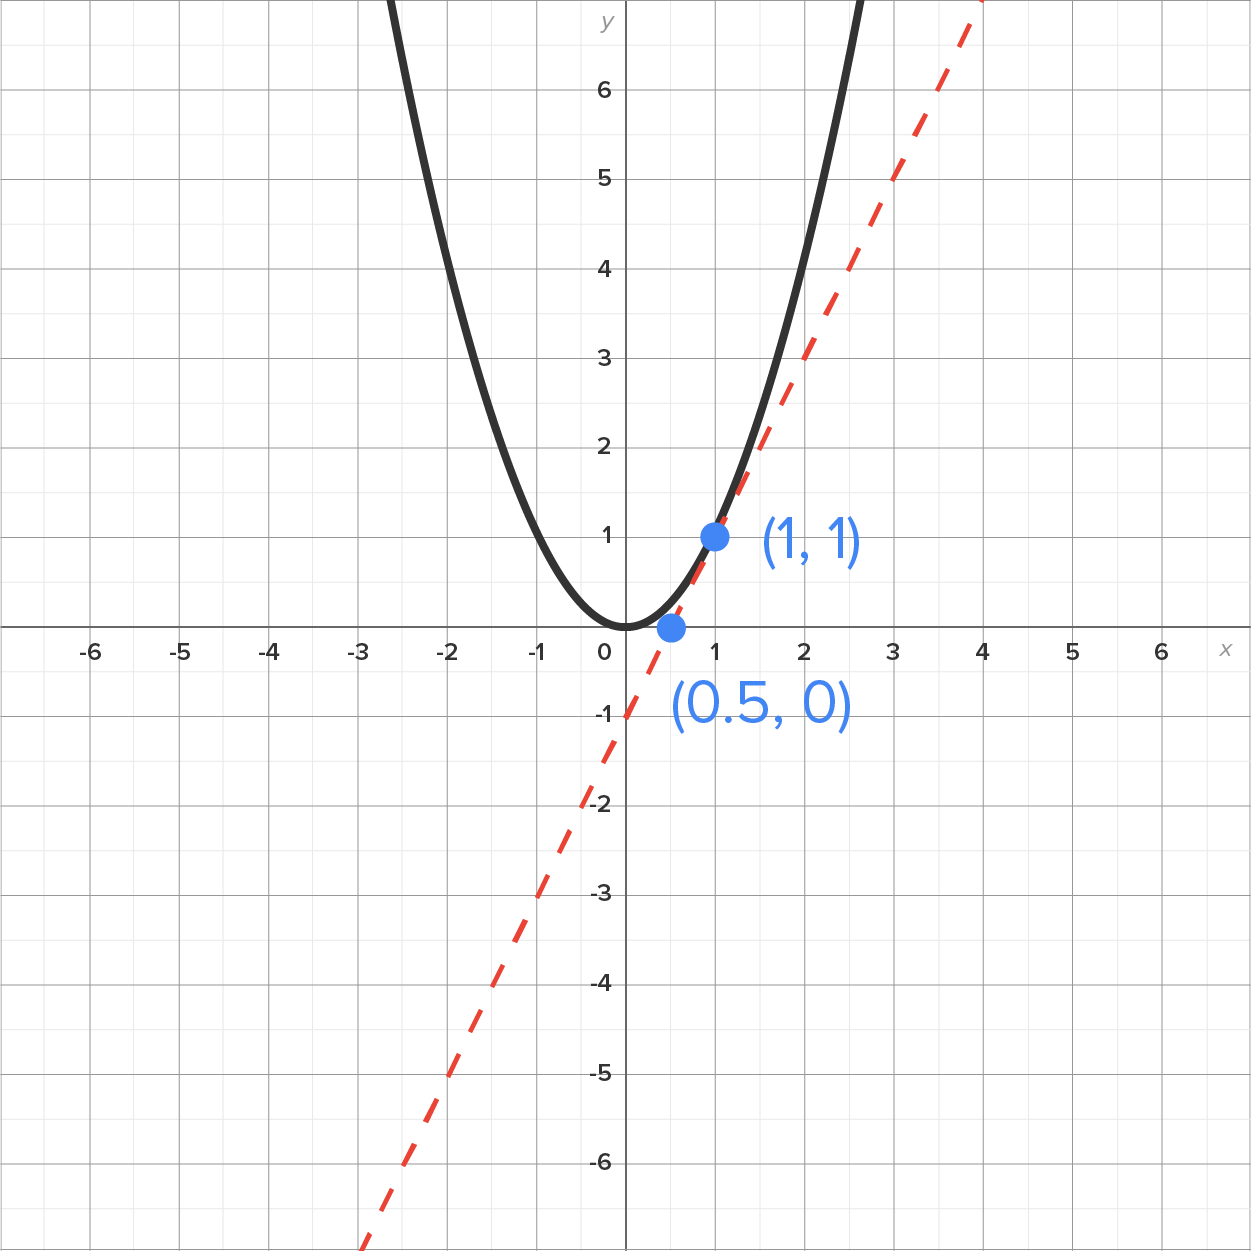 (solid) and the tangent line (dashed) when , which touches the graph at the point (1, 1).
also passes through (0.5, 0). This means the slope of this line is 2.
when is 2. Another way to say this is “the derivative of when is 2.”
from the previous example, estimate the derivative of when
(solid) and the tangent line (dashed) when , which touches the graph at the point (1, 1).
also passes through (0.5, 0). This means the slope of this line is 2.
when is 2. Another way to say this is “the derivative of when is 2.”
from the previous example, estimate the derivative of when  .
. You learned how to estimate the slope of a tangent line (derivative) graphically by drawing a tangent line at a given point, determining another point on the tangent line, then computing the slope using the formula, .
.
. You learned how to estimate the slope of a tangent line (derivative) graphically by drawing a tangent line at a given point, determining another point on the tangent line, then computing the slope using the formula, .
Source: THIS TUTORIAL HAS BEEN ADAPTED FROM CHAPTER 2 OF "CONTEMPORARY CALCULUS" BY DALE HOFFMAN. ACCESS FOR FREE AT WWW.CONTEMPORARYCALCULUS.COM. LICENSE: CREATIVE COMMONS ATTRIBUTION 3.0 UNITED STATES.
