Table of Contents |
Up until now, we only integrated functions that were above the x-axis on  We’ll use this example to see what happens when that is not the case.
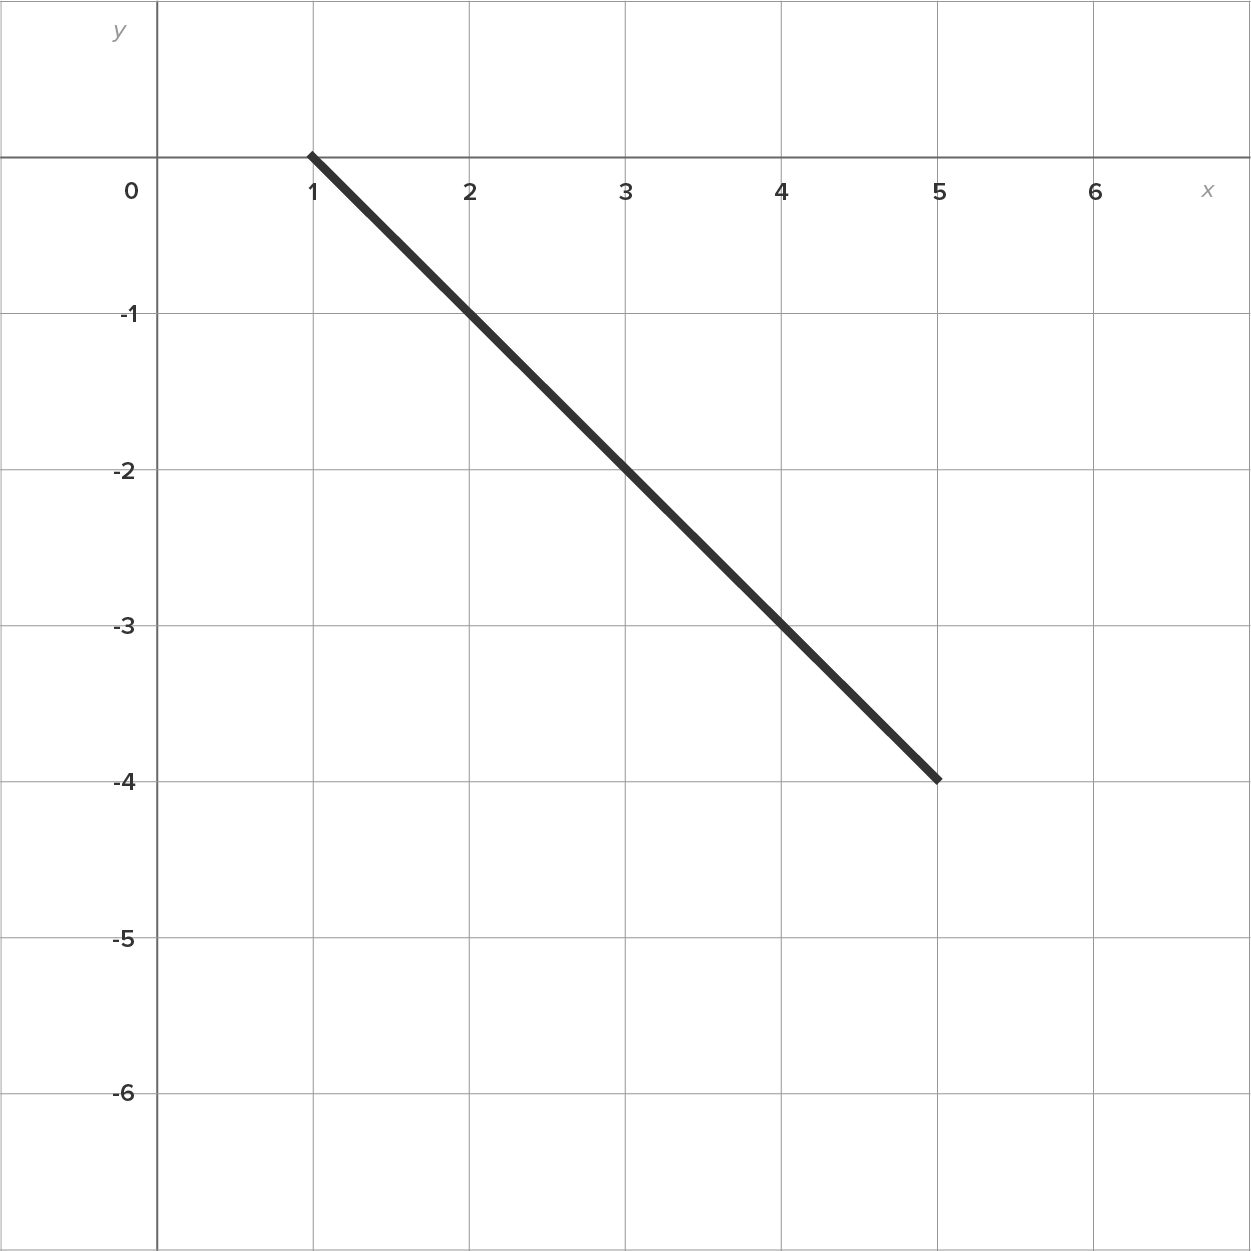
Consider the function  on the interval
The graph on the left is  on the interval
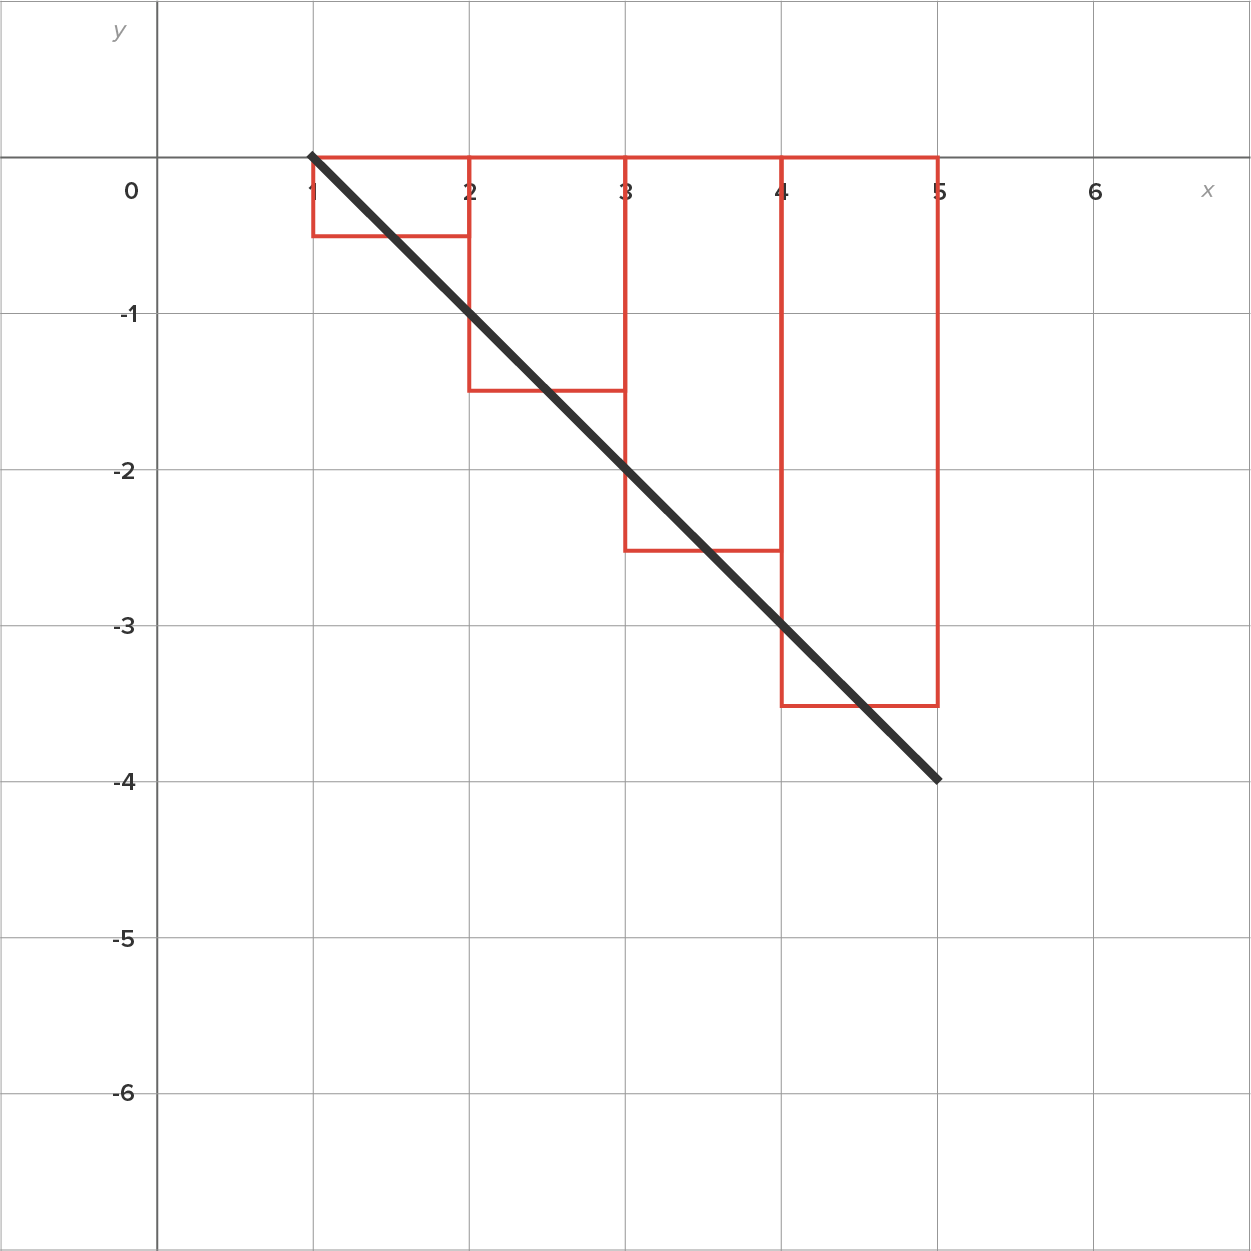
  and the graph on the right shows the rectangles that could be used in a Riemann sum. Remember, the rectangles have a base on the x-axis and extend out to the graph of .
|
|
Now consider a Riemann sum, 
 is positive, we know the quantity
  is the area of one rectangle. is negative, the quantity is the negative of the area of that one rectangle.
 Now, consider the definite integral of this function on the interval written 
We know the value of this integral is the limit of the Riemann sums as the number of rectangles gets larger and larger 
Note that the area of the region between and the x-axis is 
Then,  the negative of the area of the region.
is below the x-axis on  then
then  is the negative of the area of the region between and the x-axis on
EXAMPLE
Evaluate is shown on the left and the region is shown on the right.
|
|
is below the x-axis on the interval  The region itself is not a standard shape, so let’s split the region at
 the region is a trapezoid with parallel (vertical) bases 1 and 5, and (horizontal) height 4. The area is
 the region is a trapezoid with parallel (vertical) bases 5 and 3, and (horizontal) height 2. The area is


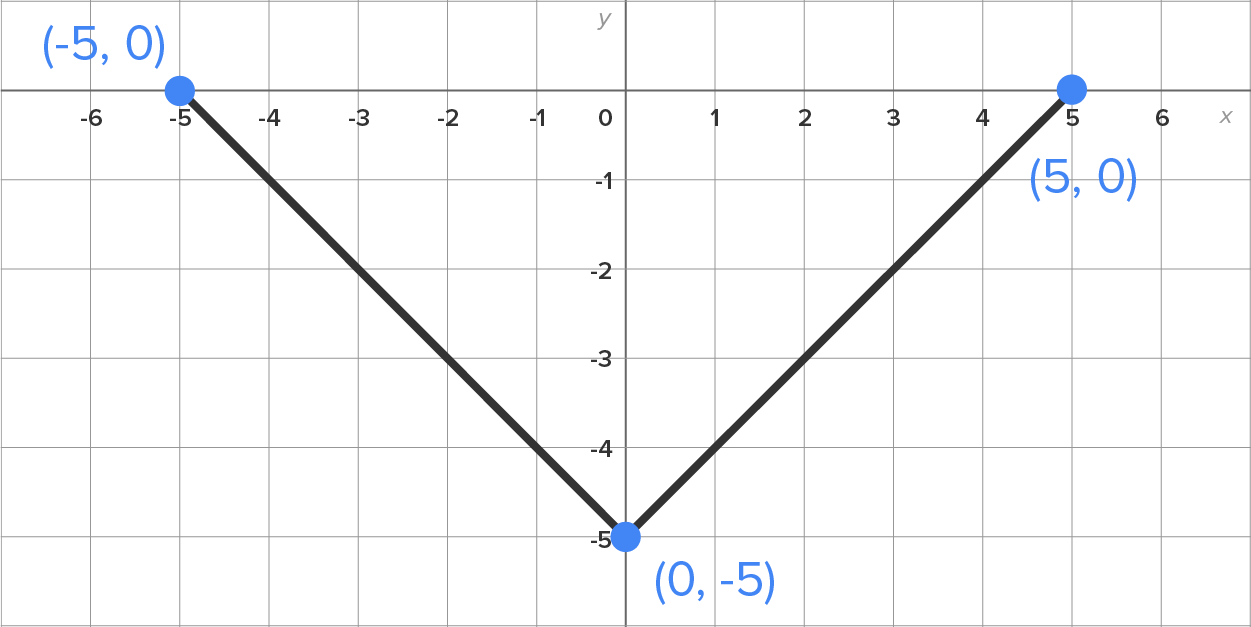
Suppose we wish to evaluate for the function whose graph is shown in the figure.
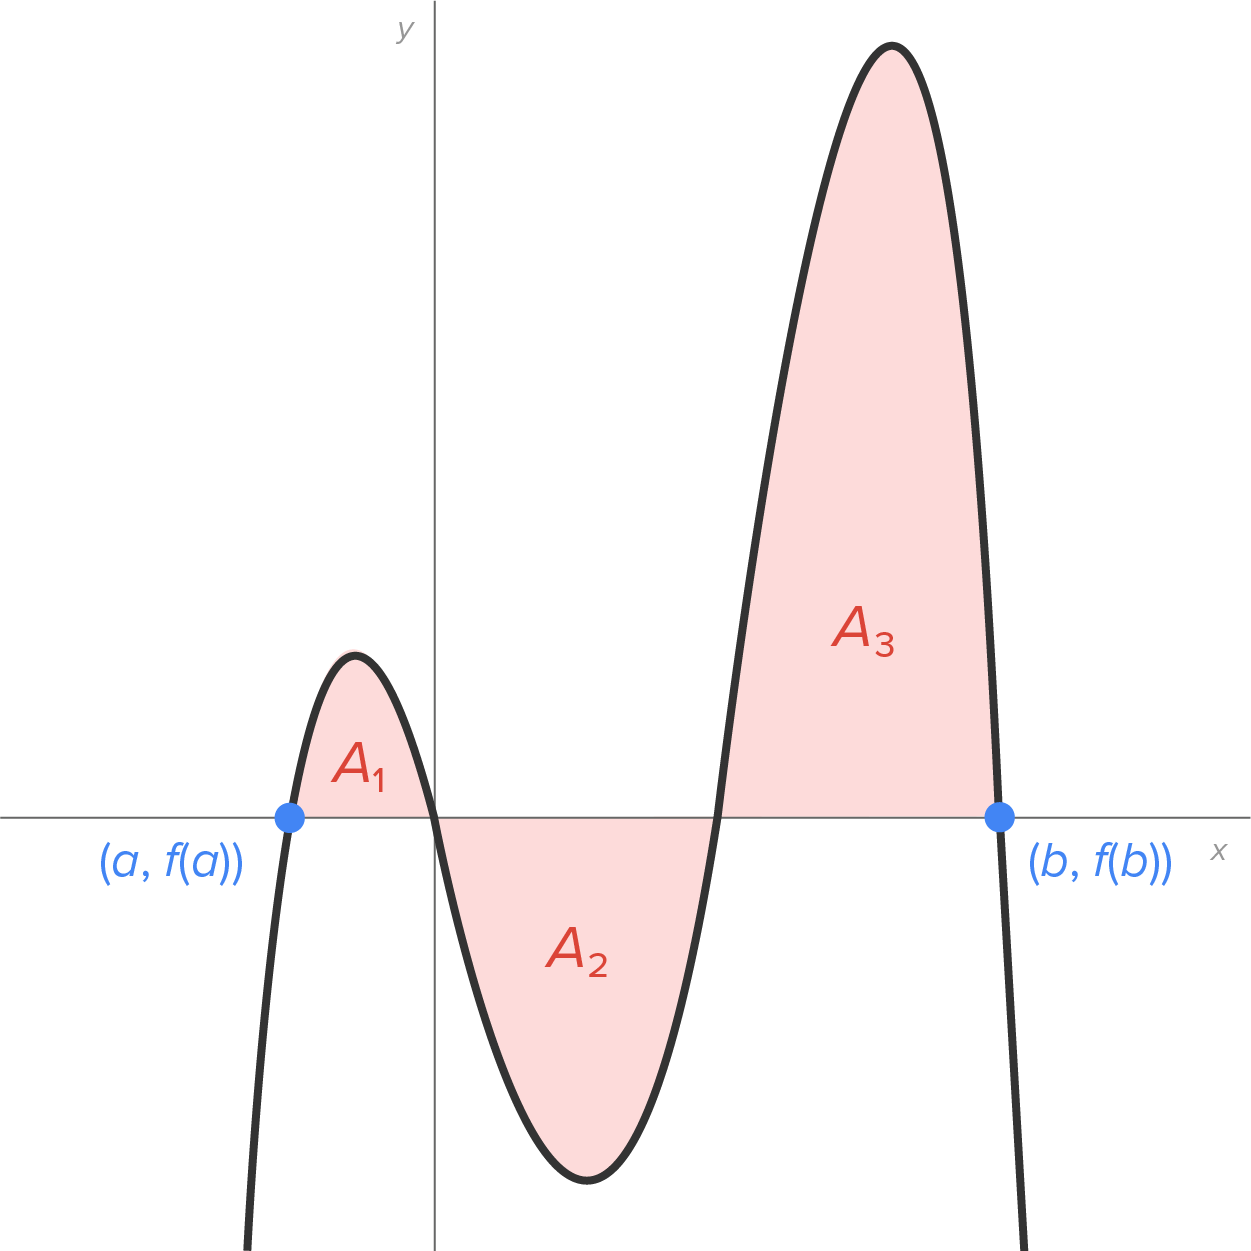
Notice how this region is broken into 3 smaller regions with areas 
 and
and 
Now, consider the definite integral on
the definite integral is equal to  since the region is above the x-axis. the definite integral is equal to
  since the region is below the x-axis.
  the definite integral is equal to
  since the region is above the x-axis.
  is equal to the sum of the three definite integrals, or
  In general, we would add any area above the x-axis and subtract any area below the x-axis.
 takes on both positive and negative values on then:
  (sum of all areas above the x-axis) - (sum of all areas below the x-axis)
Let’s look at an example.
EXAMPLE
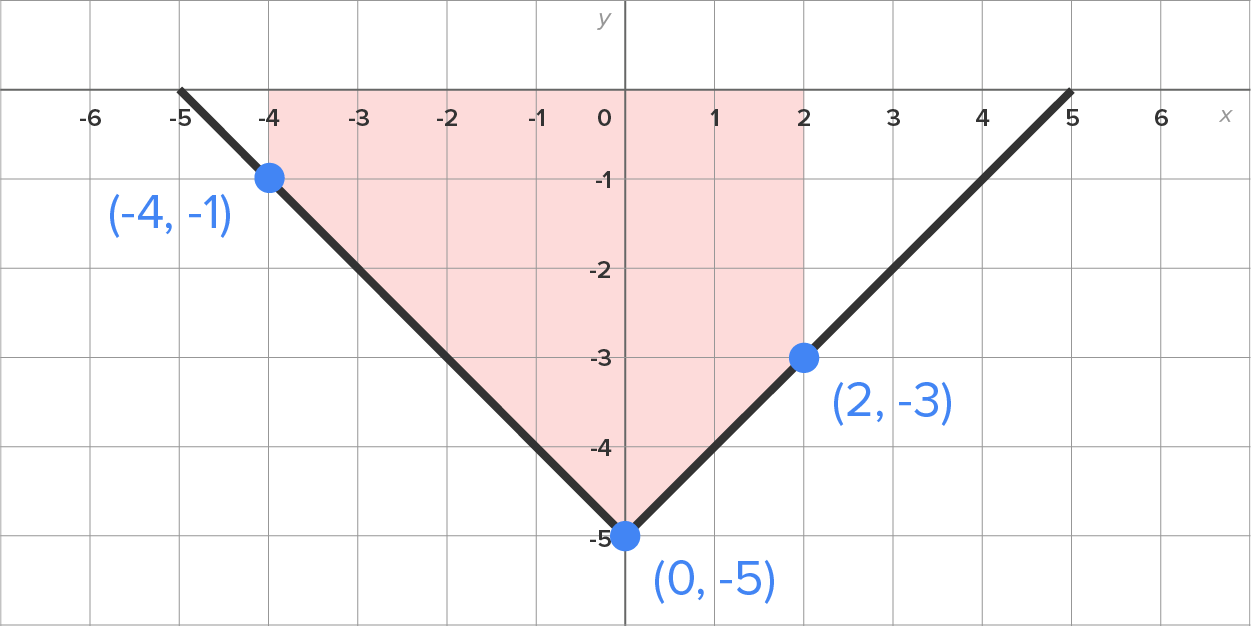
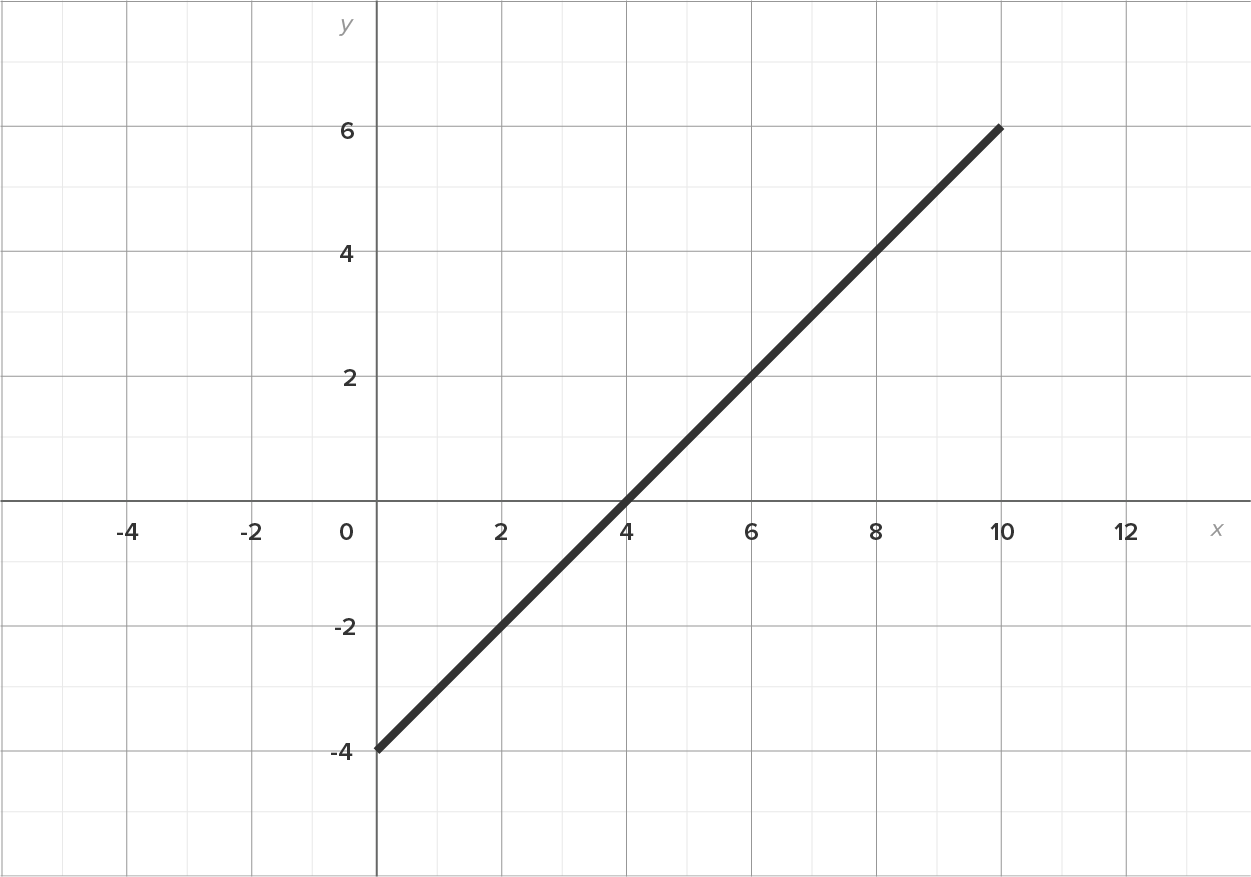
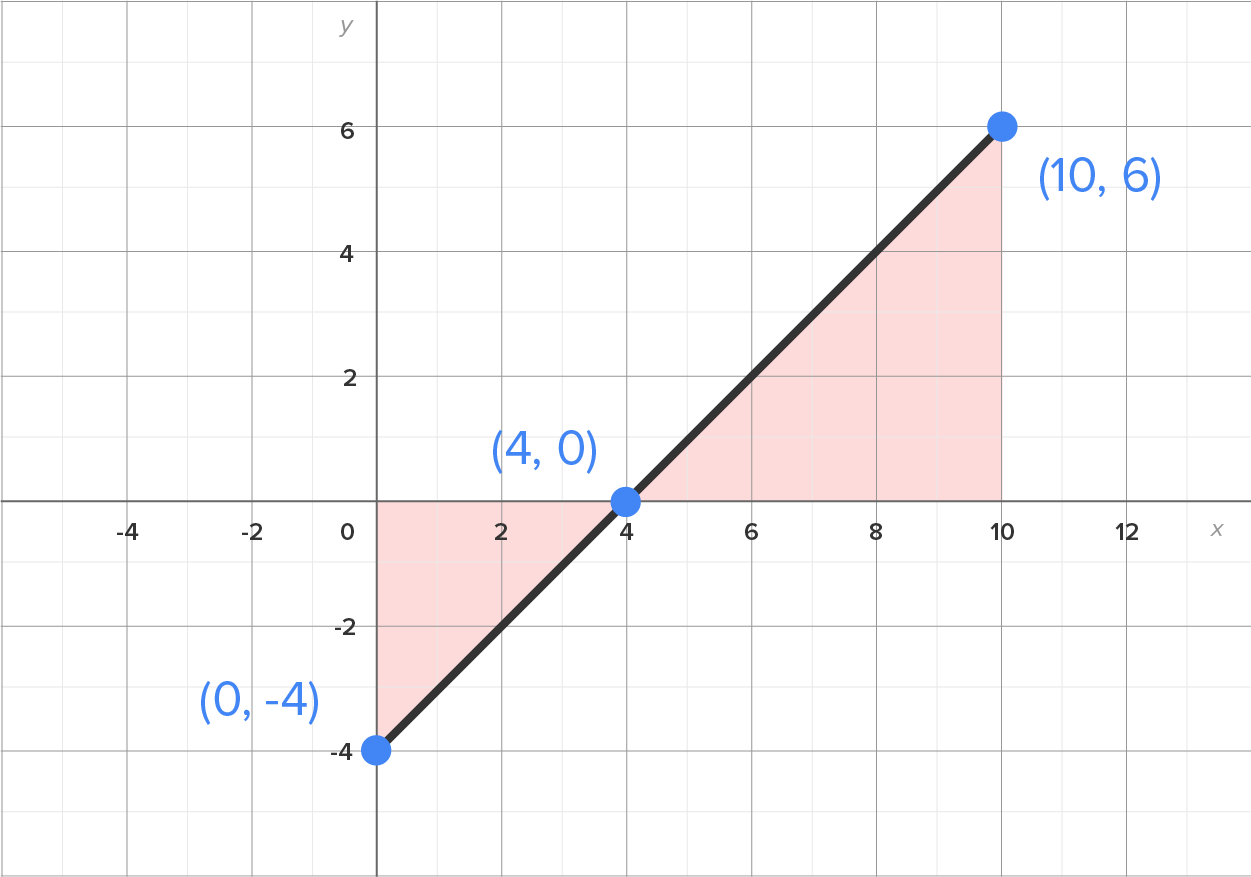
Evaluate
 on the interval
  as shown in the figure on the left. The figure on the right shows the graph with the relevant regions.
|
|
 and
and  has area
  and is below the x-axis.
and
and is below the x-axis.
and  has area
  and is above the x-axis.

 we’ll find
 there is more area above the x-axis than below the x-axis on
 there is more area below the x-axis than above the x-axis on
 there is as much area above the x-axis as there is below the x-axis on
as shown in the figure below that can be used to evaluate
there is as much area above the x-axis as there is below the x-axis on
as shown in the figure below that can be used to evaluate 
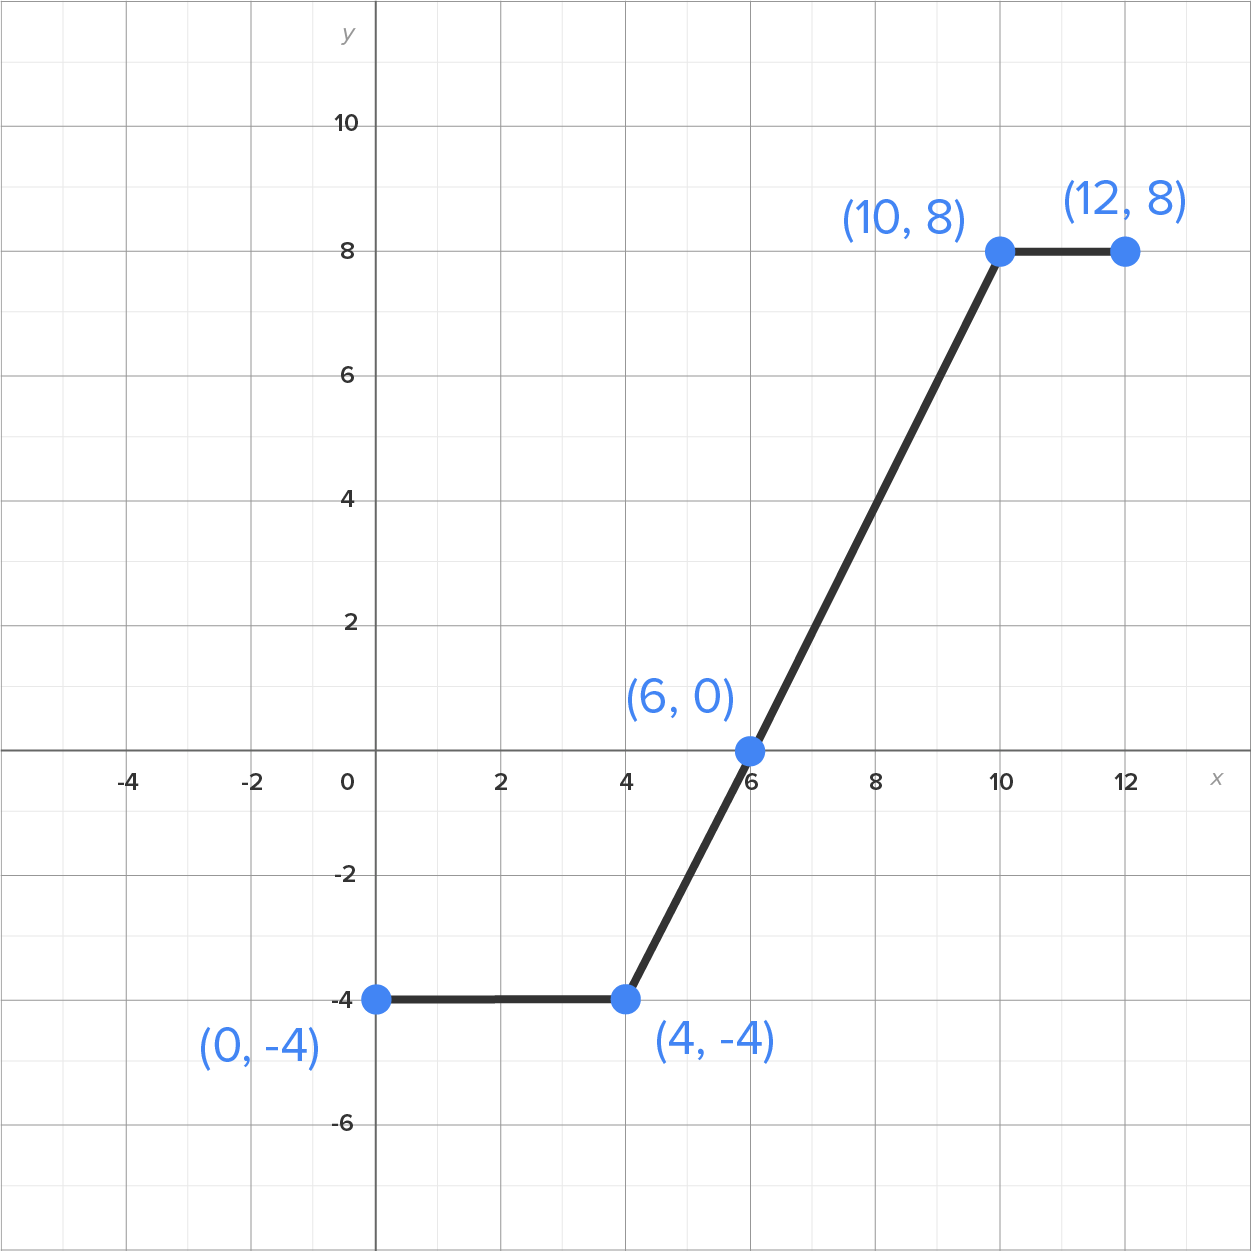
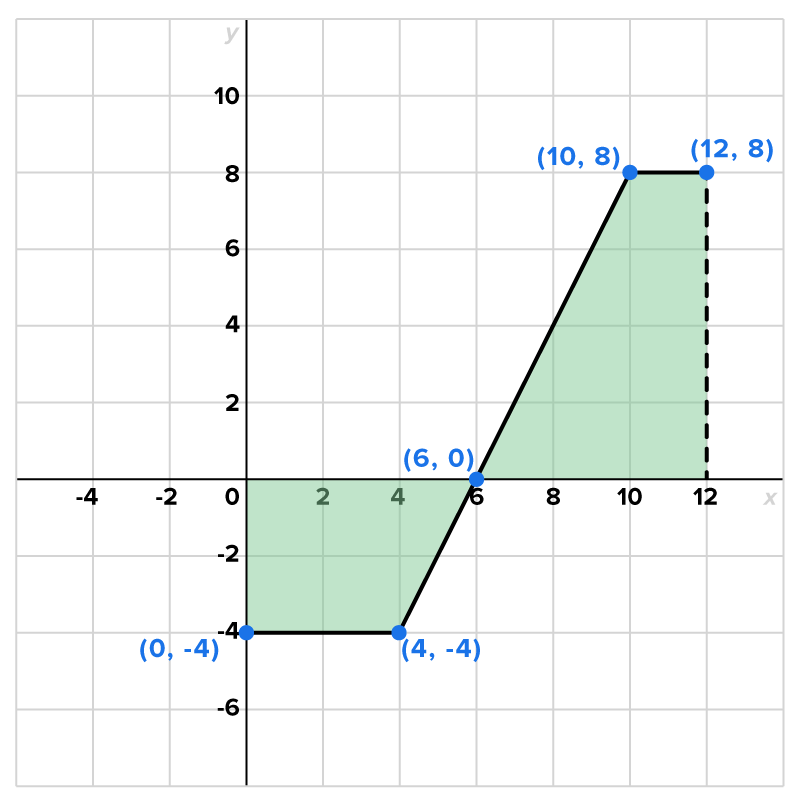 and
and  This region is in the shape of a trapezoid with bases 4 and 6 and height 4. Its area is
 and
and  This is also a trapezoid, but with bases 2 and 6, and with height 8. Its area is
 when the graph of f(x) is below the x-axis. You applied this knowledge in evaluating definite integrals when f (x) ≤ 0 on [a, b]. Lastly, you learned that when evaluating definite integrals when f (x) is both negative and positive on [a, b], you can interpret the value of the definite integral as “net area,” considering regions that are above and below the x-axis. This will be very useful when investigating applications in the next tutorial.
Source: THIS TUTORIAL HAS BEEN ADAPTED FROM CHAPTER 4 OF "CONTEMPORARY CALCULUS" BY DALE HOFFMAN. ACCESS FOR FREE AT WWW.CONTEMPORARYCALCULUS.COM. LICENSE: CREATIVE COMMONS ATTRIBUTION 3.0 UNITED STATES.
