Table of Contents |
In a previous lesson, we discussed and practiced debugging techniques. We learned that the difference between testing and debugging is that testing identifies if there are bugs or issues, whereas debugging is going through the process of fixing those issues.
Conditional statements can create a number of potential issues with coding that require debugging. With large chained and nested statements, syntax and other errors can happen unexpectedly. One common issue is the use of whitespace errors, such as spaces or tabs. Whitespace errors can be tricky because spaces and tabs are invisible and we're used to ignoring them.
EXAMPLE
For example, look at the following code.
x = 5
 y = 6
When run, this gives us an error.
  File "/home/main.py", line 2
    y = 6
IndentationError: unexpected indent
In this example, the problem is that the second line is indented by one space. But the error message points to y, which is misleading. In general, error messages indicate where the problem was discovered, but the actual error might be earlier in the code, sometimes on a previous line.
In general, error messages tell you where the problem was discovered, but that is often not where it was caused. The best way to avoid these problems is to use spaces exclusively (no tabs). Tabs and spaces are usually invisible, which makes them hard to debug, so try to find a text editor that manages indentation for you. Most text editors that know about Python do this by default, but some don’t.
Online GDB is a perfect example of an IDE and text editor. A text editor is a program that allows you to edit plain text without the added formatting features. Notepad on Windows is a very common text editor. An IDE has other features and functionalities that allow a programmer to interact with the code directly in the program. For example, GDB allows you to create and run code in a number of popular programming languages, including Python. Have you noticed that when you write an if statement in GDB and hit enter to move to the next line, it automatically indents the block line?
Maybe up to this point you have only copied and pasted code into the IDE. Let’s take a step back and write some code. We'll need it for the next topic anyway.
Directions: Open the IDE and add the following code line by line and notice how GDB's text editor automatically indents conditional statements.
grade = 85
if grade > 90:
  print("You got an A")
elif grade > 80:
  print("You got a B")
elif grade > 70:
  print("You got a C")
elif grade > 60:
  print("You got a D")
elif grade <= 60:
  print("You got a F")
print("We are done!")
Notice the auto indentations? You can write a lot of code in this IDE and other text editors using the return and backspace keys. Pretty nice, huh?
To help with debugging conditional statements, we need to know what path the code is taking. That way we will be able to step through the code and see what it is doing. When we run the program you just typed in, we simply get the result at the end of the program once everything has been processed:
EXAMPLE
You got a B
We are done!
Although we have an idea of what happens, we’re not quite sure if our assumptions are correct or not. In order to help with this, we need to use the Debug feature in Online GBD, which is the button just right of the "Run" button. If you click on it, the right-hand area and the bottom area will be changed to debugging features.
Note: If this is the first time you are using the debugger, a popup window may appear and ask if you wish to review some help documentation.
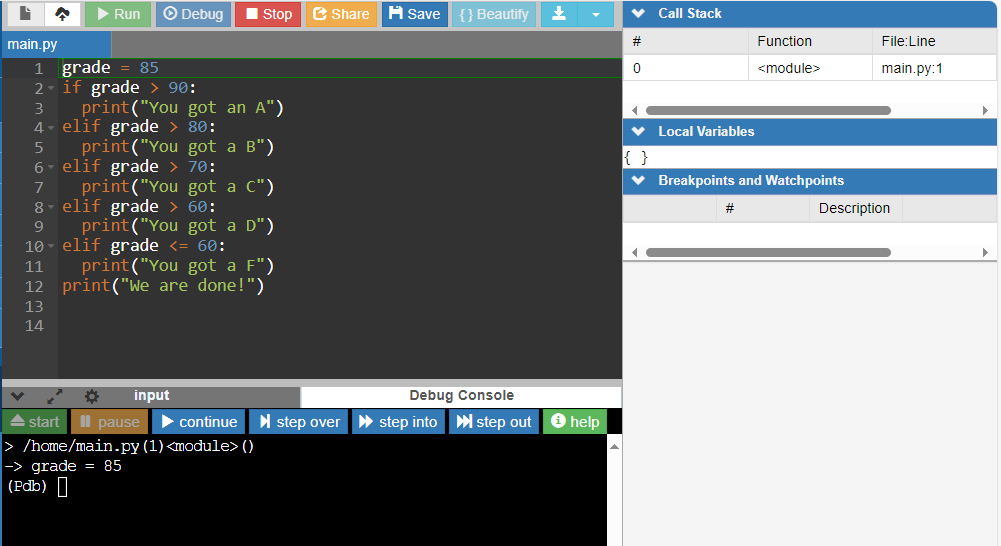
Let's review this new setup:
The Code Editor pane has not changed. You still have the main.py file open with the coded program.
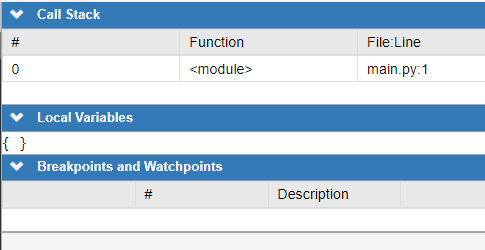
On the right-hand side is a status pane now, it displays the call stack, any local variables, and breakpoints/watchpoints that have been set. More on breakpoints in the next section.
On the bottom is the debug console with some additional functionality via buttons.
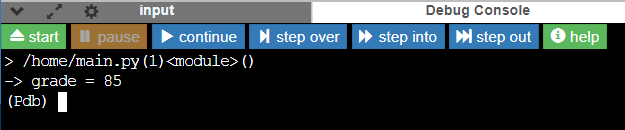
Let's discuss what each button does.
| Button | Description |
|---|---|
| Start | If debugging has concluded, will start another debug cycle. |
| Pause | Will pause the program execution at any point. |
| Continue | Resume program execution until next breakpoint is reached. |
| Step Over | Execute program line by line stepping into function. |
| Step Into | Execute program line by line but don’t go inside function call. |
| Step Out | Resume program execution until current function is finished. |
| Help | Will bring up some debug help documentation. |
We can add interactive breakpoints in the code on the code editor pane to allow us to skip or stop at specific points in the code. This will allow us to step through the code one breakpoint at a time.
In order to establish a breakpoint, we click to the left of a line number. This will then allow us to step through from that point.
Directions: Add a breakpoint on the code you previously entered.
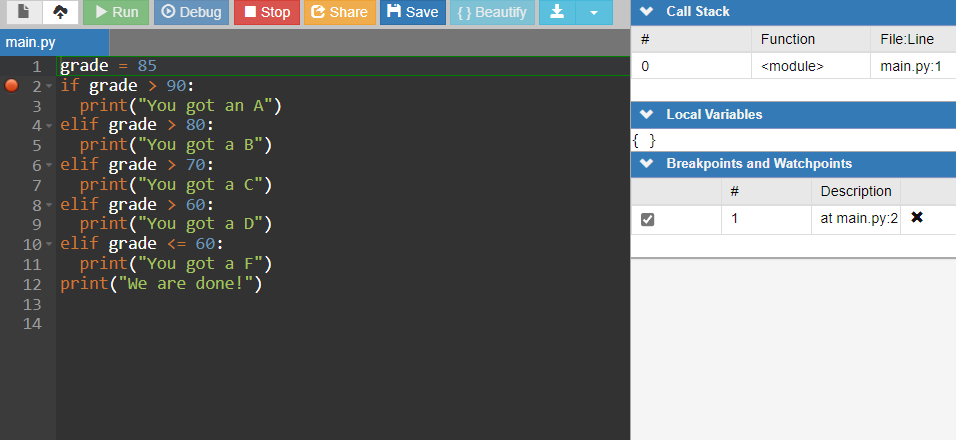
Let’s click to the left of line 2 to add a breakpoint to that conditional statement. We should see a dot appear beside line 2, and see it listed under the Breakpoints and Watchpoints on the right.
Directions: Continue the process to run the IDE debugger function.
To start the debugging process, we will click on the "continue" button in the Debug Console. The program will start executing and stop on line 2, because that is where we set our breakpoint.
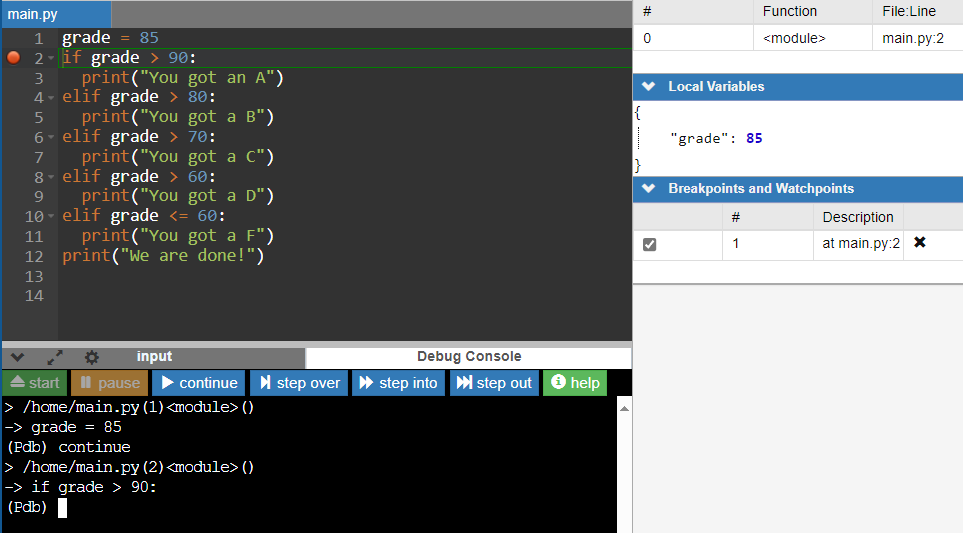
We should see that line 2 is highlighted in the Code Editor. There isn’t any output yet, so Debug Console at the bottom is still empty. In the local variables of the right-hand area, we see the variables that are currently declared in the code and the value that they are set to. In this case, we have the variable grade that is set to 85, which was executed and set in line 1. We also see that the program is currently stopped.
Since the program is stopped at the breakpoint at line 2, there are two options:
Directions: Click on the "continue" button. Since we do not have any additional breakpoints indicated what do you think will happen?
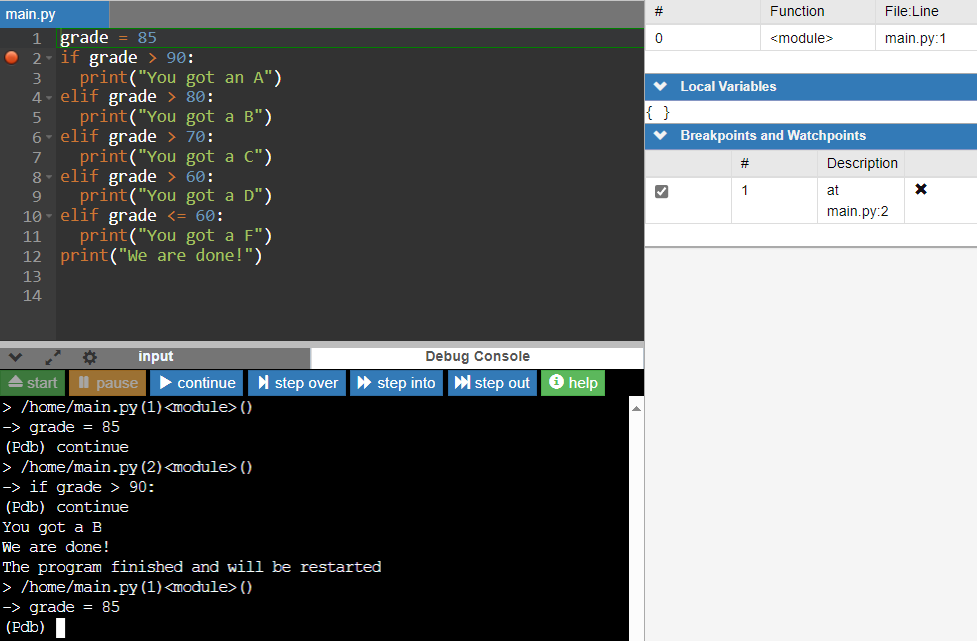
That is expected... since we do not have any additional breakpoints in the code, the program completely executed, and we see the output in the Debug Console. The highlighted code in the Code Editor is now back on line 1.
But what if we wanted to see what happens line by line in the execution?
Let's start the debugging process again.
Directions: Click on the "continue" button again in the Debug Console. The program will start executing again and stop on line 2, because that is where we set our first and only breakpoint.
This time click on the "step over" button.
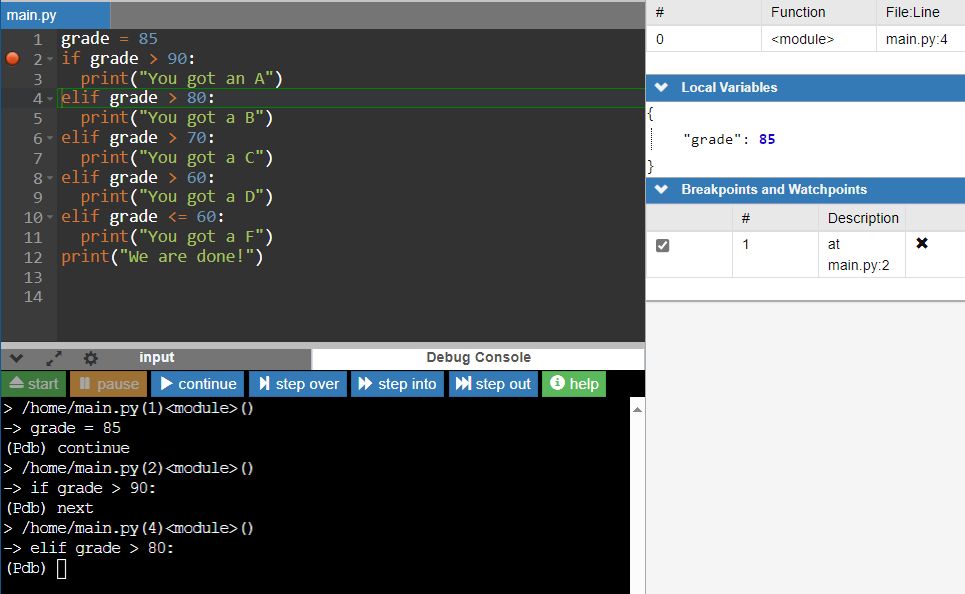
Notice now that line 4 is highlighted since that is the next condition to be checked. In the Call Stack area in the right-hand side states it is currently on line 4.
Directions: Press the "step over" button again.
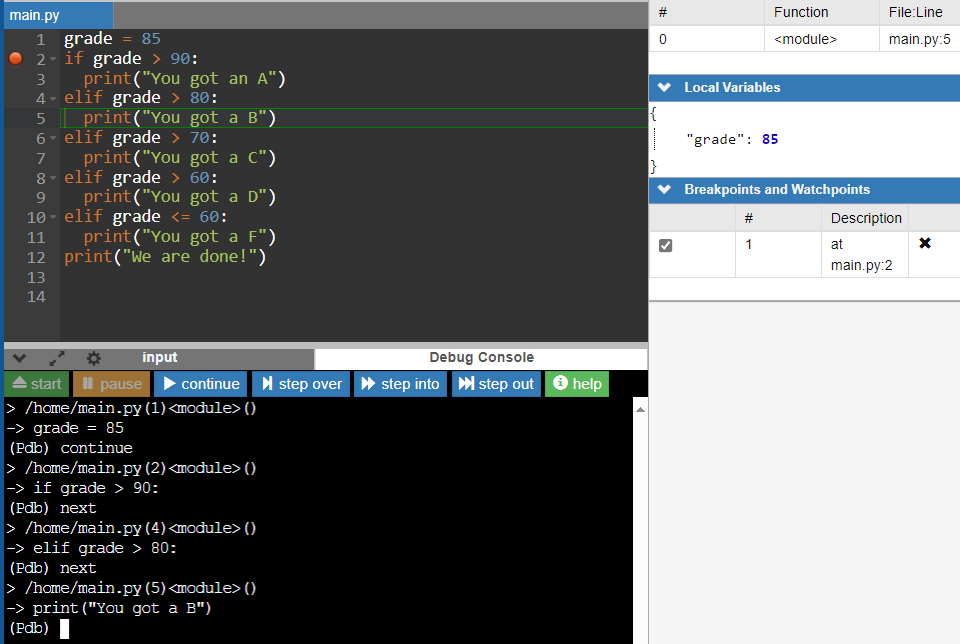
We can see now that line 5 is highlighted, as the condition was entered (since 85 is greater than 80). Call Stack also indicates line 5.
Directions: Let’s press the "step over" button again.
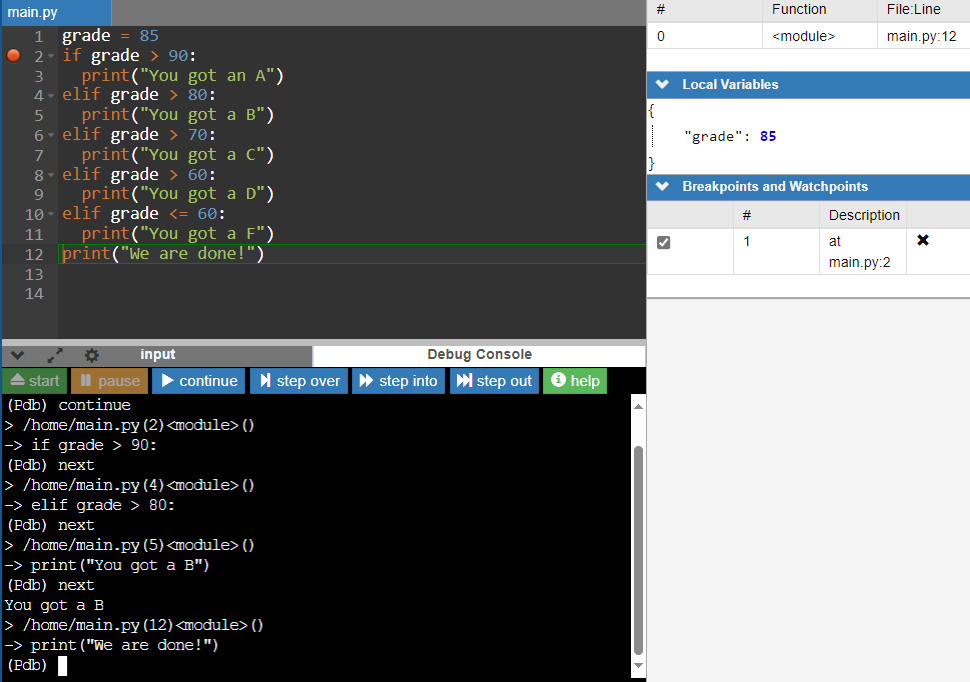
We now see that the “You got a B” displays in the Debug Console and line 12 is now highlighted. This is because all of the other elif statements are skipped since the condition on line 4 satisfied the overall condition. Call Stack shows line 12.
Directions: Let’s press the "step over" button again.
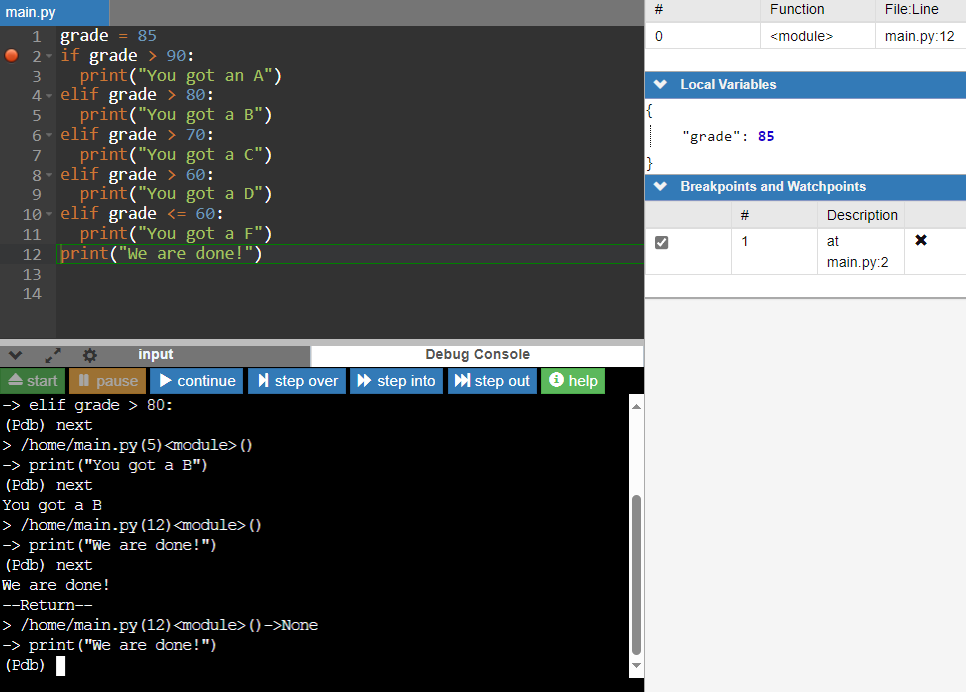
The last line “We are done!” is now added to the Debug Console.
Directions: Let’s press the "step over" button one more time.
You should see that the Call Stack has been reset and there is no highlighting in the Code Editor pane. If you chose to run the debugger again, you would use the "start" button in the Debug Console.
Using the "step over" functionality works well with simple programs but the more intricate a program becomes the use of breakpoints to step through the execution of a program really allows us to quickly spot what path the code takes.
Now let’s try a situation where we may have multiple breakpoints to help track the path of each condition.
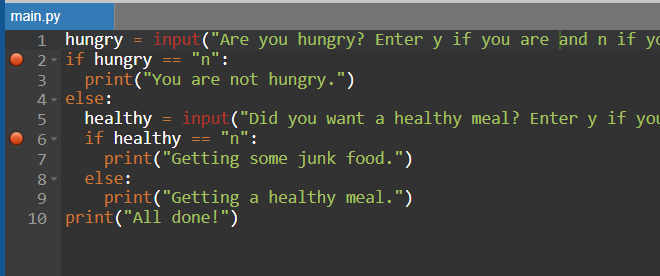
Directions: Enter the following code into the IDE.
hungry = input("Are you hungry? Enter y if you are and n if you are not: ")
if hungry == "n":
  print("You are not hungry.")
else:
  healthy = input("Did you want a healthy meal? Enter y if you do and n if you do not: ")
  if healthy == "n":
    print("Getting some junk food.")
  else:
    print("Getting a healthy meal.")
print("All done!")
Directions: Enter the debug function. Let’s place some breakpoints on each condition on lines 2 and 6. That way we can skip over a breakpoint to fast forward to the next breakpoint if needed.
Directions: Continue debugging by clicking on the "continue" button. It should ask you the input question in line 1 and await your input. Enter the first input using a “y” for now, then enter.
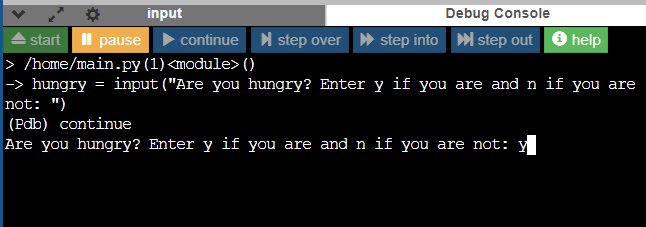
It should now stop on line 2 to await the next step. Perhaps we may have finished testing the first condition. One option is to remove the breakpoint by clicking on the dot beside the line. The other option is to still include that breakpoint but skip over it by clicking on the "continue" button.
This will allow you to step over the other breakpoint on line 6 and the commands that would normally be stopped after that point.
Directions: Select the "continue" button. It will first ask you whether or not you want a healthy meal question. Make sure to answer that.
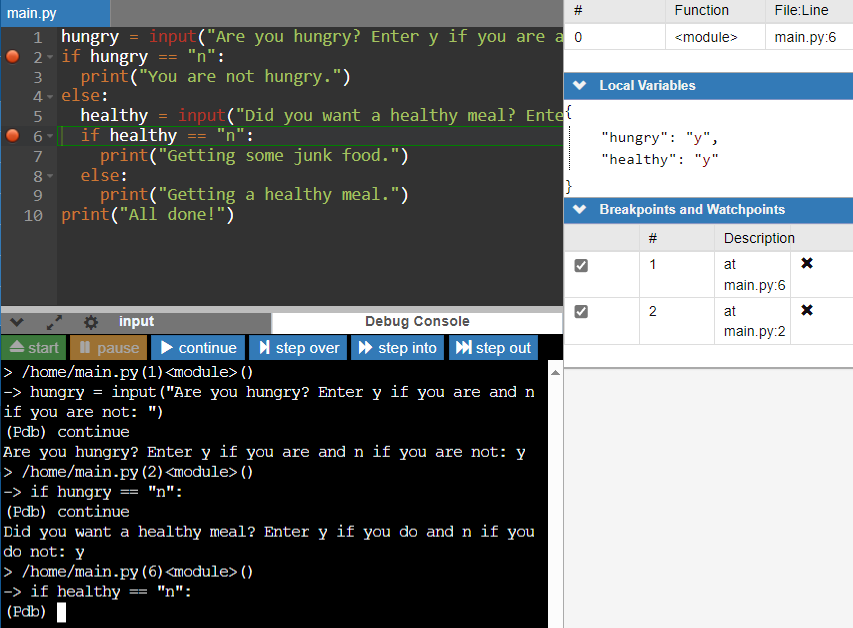
In our demo, we answered “y” to a healthy meal. Therefore, we skipped down to our second breakpoint on line 6. If we were to continue in debug mode:
Directions: Using the code we just debugged, or any other code of your choice with conditional statements included, try setting up your own breakpoints and executing the code through the debugger feature. The more you use this feature, the easier it will become.
Source: THIS CONTENT AND SUPPLEMENTAL MATERIAL HAS BEEN ADAPTED FROM “PYTHON FOR EVERYBODY” BY DR. CHARLES R. SEVERANCE ACCESS FOR FREE AT www.py4e.com/html3/ LICENSE: CREATIVE COMMONS ATTRIBUTION 3.0 UNPORTED.