In this lesson, you will learn about the difference between population and sample data and how they relate to business data analytics concepts and applications. Specifically, this lesson will cover:
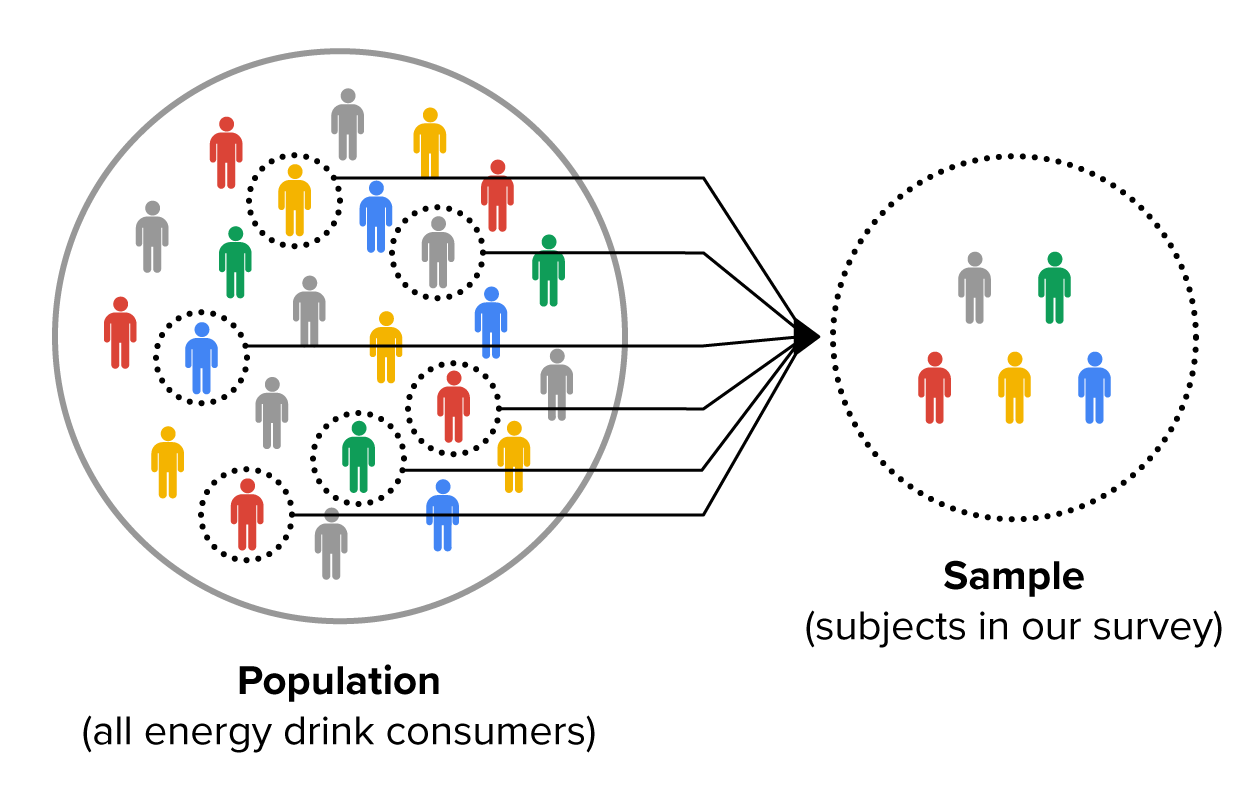
The foundation of the statistical analyses used in business data analytics revolves around population and sample data. Population refers to the entire group of individuals, customers, suppliers, employees, inventory, etc. Examples of a population would be all employees working at a company, all retail business customers, or all warehouse inventory. Any value calculated or computed from a population is known as a parameter.
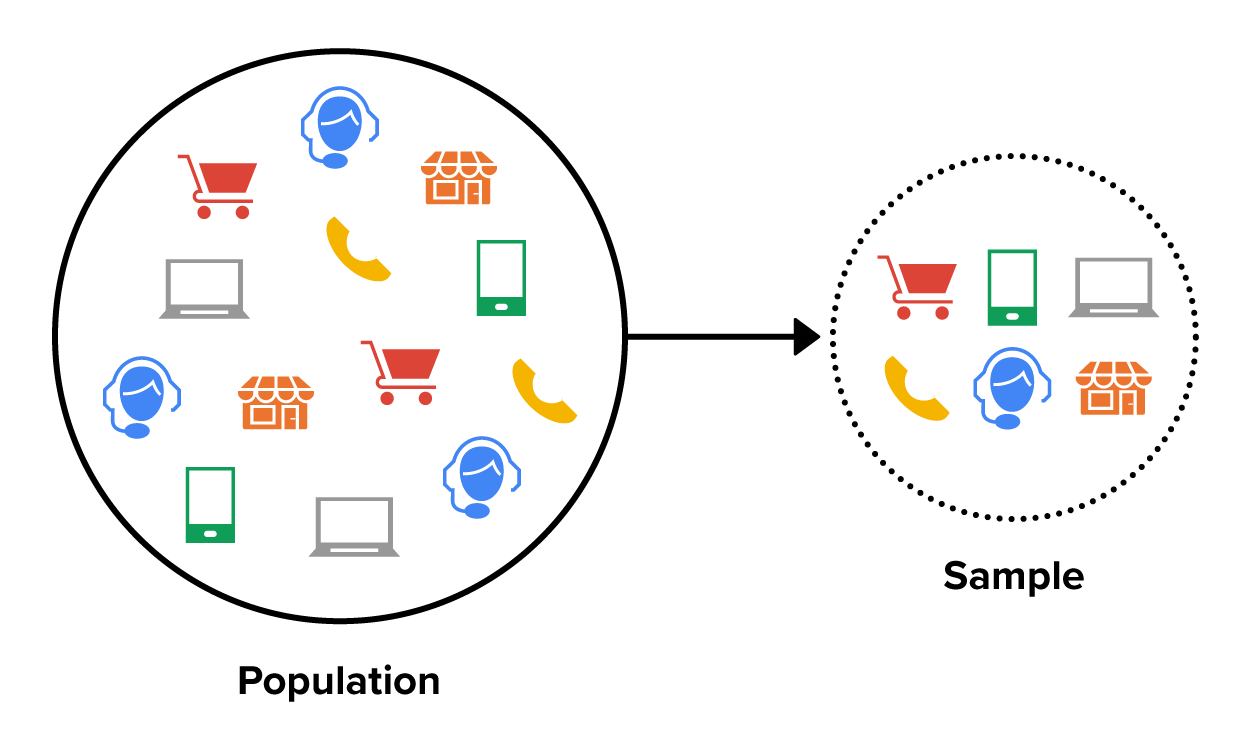
A sample is a subset of a population. The sample should be representative of the items and individuals in the population. The sample's purpose is to take the results of the data analytical method (hypothesis test, model, etc.) and generalize or apply the results to all items and individuals in the population. Any value calculated or computed from the sample is known as a statistic.
IN CONTEXT
Imagine a company that sells a new type of energy drink and wants to understand how all its potential customers feel about the product. The population in this case would be all potential customers who might buy the energy drink. This population would include all customers within a certain age range, living in a particular region or country, who might be interested in purchasing energy drinks.
The sample might consist of 1,000 randomly selected adults from the target demographic. These individuals are surveyed about their preferences and opinions on energy drinks.
By analyzing the responses from the sample, the company can infer the preferences and opinions of the entire population without needing to survey every potential customer.
Sample data is much more common because it is easier to gather and, as long as the sample is representative of the larger population, is generally an efficient and reliable way to uncover insights.
terms to know
Population
All elements of interest.
Parameter
A value calculated from a population.
Sample
A portion of the population.
Statistic
A value calculated from a sample.
2. Importance of Sample Data in Business
If a business wants the most accurate answer to a question, population data would be the best. This is because the population contains all objects and all units. Because all the data is used to compute a parameter, parameters provide the most comprehensive view of the data. However, collecting and gathering population data is prohibitively expensive, if not impossible, and ultimately not necessary. Instead of performing the analysis on the entire population, businesses sample the population and use the results to infer something about the population. This process of using sample data to draw conclusions about a population is known as inferential statistics.
Sample data is important because the business will analyze sample data to learn something about the population. That is, all customers, all employees, all inventory in the warehouse, etc. Hence, the sample data becomes vital for a variety of reasons. Let’s explore a few of the reasons businesses use sample data.
Practicality: Many times, the population is just too large to reasonably use for the analysis. For example, major cellular carriers like Verizon have over 100 million customers, and credit card processors like Visa process thousands of transactions each second.
Cost Effectiveness: Collecting data for an analysis using population data can be expensive. It takes much longer to run analyses on population data rather than sample data. For example, population datasets could have several billion rows of data.
Error Reduction: If errors are found during the data cleaning process (missing values, outliers, etc...), identifying and rectifying them is less costly and takes less time than if population data was used.
Speed: Cleaning and preparing a population dataset for analysis takes more time. Some of these datasets may be so large that even running the analyses could use unnecessary time and resources.
IN CONTEXT Disney’s Data Deluge
Disney’s data analytics framework is a prime example of how businesses can leverage data to optimize operations and enhance customer experience. However, the sheer volume of data generated can be overwhelming and often prohibitive for analysis.
Disney’s Data Generation
Disney World resorts attracted over 142 million visitors in 2023 (TEA/AECOM, 2023). Each visitor’s interaction, from the rides they enjoy to the merchandise they purchase, generates data. This data generation is further amplified by the Magic Bands introduced in 2013. These RFID chip-enabled wristbands, which serve as a key for hotel rooms, a ticket for attractions, and a tool for purchases, allow Disney to track guest activity with extreme precision (Barnes, 2013).
The introduction of the Magic Bands coincided with Disney’s investment in a new analytics ecosystem, capable of capturing, processing, storing, and applying this wealth of customer data. The result is a massive data and analytics framework that tracks everything from visitor behavior to park operations.
Disney's wearable MagicPass. The latest version, MagicPass+, was released in 2022. The Challenge of Big Data
The scale of data generated by Disney is immense. Consider this: if each of 10 million visitors generates even a modest 100 data points per visit, that’s 1 billion data points annually! Analyzing such a vast amount of data is not just challenging but can be prohibitive both in terms of computational resources and time.
The Need for Sample Data
Given the prohibitive nature of analyzing all the data, businesses often resort to using sample data. In the context of Disney, instead of analyzing data from all 20 million visitors, a representative sample might be used. For instance, data from a few thousand visitors could be analyzed to draw conclusions about visitor behavior, preferences, and spending patterns. This approach significantly reduces the computational resources and time required for analysis while still providing valuable insights.
think about it
Many major industries collect vast amounts of data and must make smart decisions about the way they sample those data.
Telecommunications: A major telecommunications company like AT&T collects data on every call, text message, and data packet sent over its network. This data includes information on call durations, locations, data usage, and network performance.
Social Media: Platforms like Facebook or X generate vast amounts of data daily, including posts, likes, shares, comments, and messages from billions of users.
Financial Services: Large banks and financial institutions process millions of transactions daily, including deposits, withdrawals, credit card purchases, and fund transfers.
E-commerce: Online marketplaces like eBay or Alibaba receive millions of customer reviews and feedback entries for various products.
Healthcare: Large healthcare networks and hospitals collect extensive data on patient visits, treatments, diagnoses, and outcomes.
Smart Cities: Smart cities deploy numerous sensors to monitor traffic, air quality, energy usage, and public safety. The data generated by these sensors is vast and continuous.
term to know
Inferential Statistics
Branch of statistics that uses analytical tools to draw conclusions about a population using a representative sample.
3. Building an Appropriate Sample
For a business to use data analytical results from a sample and generalize to all customers, employees, and inventory in the population, the key is to ensure that the sample is a random sample. A random sample is a sample in which each element or object (customer, employee, bank record, etc.) in the population has an equal chance of being selected in the sample. A random sample is the best method for creating a representative sample. That is, a random sample ensures that the data in the sample is representative, or mirrors the same traits and characteristics of the data in the population. A representative sample is necessary in order to draw accurate conclusions about the population. If the sample isn’t representative, the insights gleaned from the data analytical results may not apply generally to the population.
IN CONTEXT Scenario: Rollercoasters and Dairy-Free Ice Cream
Imagine you are working as a data analyst at an amusement park. You have been tasked with understanding more about visitor preferences for dairy-free ice cream. Instead of randomly sampling visitors, you decide to survey only those visitors who visit specific locations. For example, you only survey visitors who visit stands at the new Plant-Based Picnic Zone.
The Problem: Visitors who actively seek dairy-free options, perhaps due to dietary restrictions or a desire to avoid animal products, are more likely to be included in your survey. You might miss visitors who prefer regular ice cream.
Consequences: If the sample overrepresents dairy-free enthusiasts, you might mistakenly conclude that most visitors prefer dairy-free options. The results from the analysis will not accurately represent all visitors’ preferences.
Solution: Ideally, you would like to use a random sample to get a representative view of all amusement park visitors’ preferences. If a random sample is not feasible, you should acknowledge the limitation and interpret the results cautiously.
key concept
Non-random samples can lead to biased conclusions, affecting your understanding of the entire population.
Remember, a representative sample is essential for accurate insights and generalizing the data analytical results to the entire population.
terms to know
Random Sample
A sample where each member of the population has an equal chance of being selected in the sample.
Representative Sample
A sample that reflects the characteristics of the population.
4. Random Sampling Applications in Business Data Analytics
Below are two examples where creating samples plays a key role in business data analytics.
EXAMPLE
Website Usability:
The website HowStuffWorks, which makes simple topics in health, science, nature, and more, wants to improve its website. They randomly select users to participate in usability testing sessions. In these sessions, users are asked to complete tasks using the website. These tasks might include things like trying to find a specific topic on the website or answering a question using one of their articles. By observing how this sample interacts with the site, they uncover pain points and see how changing or modifying their website navigation would be useful to users. The changes to the website, based on the results from the analysis of the sample, will be rolled out to all users of the HowStuffWorks website.
EXAMPLE
Quality Control:
A manufacturing company wants to assess the quality of its products. Instead of inspecting every item produced, they randomly select a sample of products from each production run. By analyzing this sample, they can identify defects, improve processes, and maintain quality standards. If there are no defects found in the sample, the company has assurance that all the products produced will not have defects so the production process can continue with no delays.
summary
This lesson focuses on inferential statistics, highlighting the essential difference between population data, which includes all members of a group, and sample data, a subset used to make inferences about the population. Sample data is particularly important in business because it allows for cost-effective and timely decision-making without the need to survey an entire population. For example, Disney utilizes sample data from Magic Bands to analyze visitor behavior, including spending habits.
Creating a representative sample involves random sampling to ensure each member of the population has an equal chance of being selected, reducing bias, and mirroring the same traits and characteristics of the population. Random sampling helps businesses make informed decisions based on representative data, enhancing the reliability of their analyses. Instead of gaining only a single parameter, a more usable statistic can be calculated.
Source: THIS TUTORIAL WAS AUTHORED BY SOPHIA LEARNING. PLEASE SEE OUR TERMS OF USE.
DePaolo, C. A., & Jacobs, A. (2021, December 15). Teaching Case: Analyzing Disney World Wait Time Data: A Lesson in Visualization Using Tableau.jise.org/Volume32/n4/JISE2021v32n4pp249-252.html
TEA/AECOM, Robinett, J., TEA, & AECOM Economics & Advisory. (2024). GLOBAL ATTRACTIONS ATTENDANCE REPORT (By Storyland Studios, Themed Entertainment Association (TEA), & AECOM Economics + Advisory; M. Palicki, Ed.) [Report]. Themed Entertainment Association (TEA). aecom.com/wp-content/uploads/documents/reports/AECOM-Theme-Index-2023.pdf
Attributions
Disney Magicband | Author: Doug Butchy | License: Creative Commons
 Quality Control: