In this lesson, you will learn how to analyze data in a crosstabulation and perform a chi-square test of association for variables that can be represented in a crosstabulation. Specifically, this lesson will cover:
-
This lesson assumes familiarity with several key introductory statistics concepts. Reviewing the following content from Sophia’s
Introduction to Statistics is advised:
- Hypothesis Testing
- ANOVA and Chi-Square Tests focusing on Chi-Square Test of Association and Independence
1. Crosstabulation
Crosstabulation, also known as a contingency table, is a tabular form used to analyze the relationship between two or more categorical variables. The steps below outline how the procedure works.
1. Tabulate Frequencies
Create a two-dimensional table that records the number (frequency) of respondents with specific characteristics.
Each cell in the table represents a combination of categories from the variables being analyzed.
2. Interpreting Relationships
By examining the intersections of categories, you can understand how the variables relate to each other.
For example, you might compare the city of residence with the type of government services used to determine if these two variables are independent or related.
The relationship is determined using a statistical test known as the chi-square test of association.
3. Insights and Patterns
Crosstabulation helps reveal patterns, dependencies, and associations that might not be apparent when looking at the total frequencies of categorical variables. Examining the frequencies of categorical variable categories together allows for deeper insights.
-
- Crosstabulation
- A table that displays the frequencies or counts of observations that fall into different categories of categorical variables.
- Contingency Table
- A synonym for crosstabulation.
1a. Interpreting a Crosstabulation
Before any formal analysis is performed on a crosstabulation, it is important to understand the components that make up the crosstabulation and interpret the values in the crosstabulation.
Let’s look at an example to demonstrate the interpretation and understanding of a crosstabulation.
-
EXAMPLE
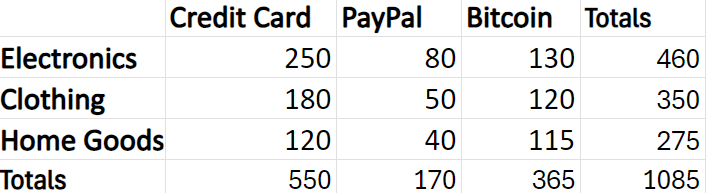
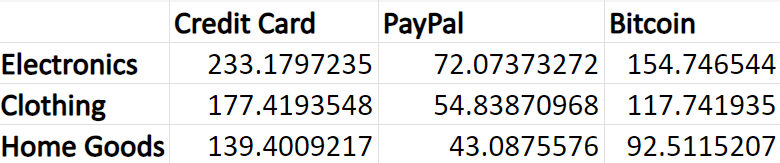
Suppose you are assisting an e-commerce manager who is analyzing customer purchasing behaviors. You want to segment your customers based on their preferences and payment methods. You construct the contingency table below.

The rows are the categories of products the company sells. The columns are the payment methods used by the customers. The intersection of the cells contains a frequency count representing a unique combination of the two categorical variables being analyzed. Using the contingency table for this scenario, the company has 250 customers who purchased electronics and paid with a credit card, 50 customers who purchased clothing and paid with PayPal, and so on.
The contingency table also presents row and column totals. The row totals are listed in the Totals column. The row total represents the sum of frequencies (counts) for each category within a specific row. For example, 460 electronic products have been ordered. A column total represents the sum of frequencies (counts) for each category within a specific column. For example, 170 customers have paid using PayPal.
-
Using the contingency table provided in the previous example, answer the following questions:
Just knowing how to interpret the values in the contingency table and what the frequencies represent can provide you with insight into the data. For example, by examining the intersections in the table, you can uncover insights such as:
- Which product categories are most popular for each payment method? Payment by credit card is the most popular for electronics.
- Are there any unexpected patterns (for example, high credit card usage for specific products)?
- Do certain payment methods dominate specific product categories? Credit card payment dominates all the categories.
Armed with your insights from the analysis, the e-commerce manager can tailor marketing strategies such as:
- Offer discounts when the customer uses credit card payments.
- Optimize checkout experiences based on preferred payment methods.
- Customize product recommendations for different segments.
For further analysis, you can also calculate percentages from a contingency table. Let’s return to the previous example to determine how you can calculate certain percentages.
-
EXAMPLE
Returning to the previous example where you are assisting an e-commerce manager who is analyzing customer purchasing behaviors, you have the following contingency table.

There are three types of percentages you can calculate from a contingency table, and they are listed below.
Overall percentages: An overall percentage in a contingency table represents the proportion of the value in a specific cell relative to the grand total of all values in the table. This percentage helps understand the cell's contribution to the overall total number of observations.
To calculate an overall percentage, divide the individual cell frequency by the grand total. The grand total is the number of observations in the bottom right of the table. For example, if you wanted to know what percentage of customers purchased electronics and paid by credit card, then you would divide the number of transactions in that specific cell by the grand total and multiply by 100%.
Percentage of customers who purchased electronics and paid with a credit card:

This means that 23% of all transactions were credit card transactions for electronics.
Row percentages: A row percentage in a contingency table represents the proportion of a specific cell’s value relative to the total of its row. Row percentages help in comparing the distribution of different categories within the same row.
To calculate a row percentage, divide the individual cell frequency by the row total and multiply by 100%.
Row percentage of credit card transactions for electronics:

This means that 54% of the electronics transactions were made using credit cards.
Column percentages: A column percentage in a contingency table represents the proportion of a specific cell’s value relative to the total of its column. Column percentages help in comparing the distribution of different categories within the same column.
To calculate a column percentage, divide the individual cell frequency by the column total and multiply by 100%.
Column percentage of credit card transactions for electronics:

This means that 45% of the credit card transactions were for electronics.
-
- Overall Percentage
- Percentage of observations in a specific cell relative to the total number of observations in a contingency table.
- Row Percentage
- Percentage of each cell’s value relative to the total of its row in a contingency table.
- Column Percentage
- Percentage of each cell’s value relative to the total of its column in a contingency table.
2. Chi-Square Test of Association
A contingency table is a useful tool for summarizing the relationship between two categorical variables. A contingency table provides a descriptive summary of the data via counts and percentages in the contingency table, but does not provide any information related to how the variables are related to each other. A chi-square test of association is needed to validate whether a relationship exists between categorical variables in a contingency table.
The method used to determine if there is an association between two categorical variables in a contingency table is a chi-square test of association. This test determines if two categorical variables are related, that is, if there is an association between the two variables.
When a chi-square test assesses the association between two variables, it examines whether there is a statistically significant relationship between them. Specifically:
-
Null Hypothesis (
 ): The two variables are independent (that is, no association).
-
Alternative Hypothesis (
 ): The two variables are dependent (that is, there is an association).
The chi-square test calculates an expected frequency distribution based on the assumption of independence. It then compares this expected distribution with the observed frequencies in the data. If the observed frequencies significantly deviate from what would be expected under independence, you reject the null hypothesis and conclude that an association exists.
In practical terms, this test helps you understand whether changes in one variable are related to changes in another. For example, you might investigate whether customer satisfaction scores (one variable) are associated with the type of customer support channel used (another variable). If there’s a significant association, businesses can tailor their support strategies accordingly.
Another application of using the chi-square test is to determine whether product preferences are related to customer demographics (age groups, regions, or income levels). If yes, businesses can use this information to tailor marketing strategies, optimize inventory management, or personalize recommendations.
Let’s illustrate the chi-square test of association using an example.
-
EXAMPLE
You are still assisting an e-commerce manager with understanding the purchasing behaviors of customers. You now want to determine whether there is a relationship between the payment method and the product categories using the contingency table from the previous example, which is shown below.
You perform a chi-square test of association between the two variables and find that the hypothesis test is significant. You can report to the manager that the payment method and product category are associated. Further, you can provide the following practical implications to the manager that might assist in business decisions.
-
Inventory Management: Adjust inventory levels based on payment trends. If Bitcoin is popular for specific products, ensure sufficient stock for those items. Avoid overstocking products associated with less common payment methods.
-
Partnerships and Agreements: Collaborate with payment providers based on usage patterns. Negotiate favorable terms with providers preferred by customers. Explore partnerships with popular payment gateways.
-
Pricing and Discounts: Consider differential pricing or discounts based on payment methods. Encourage customers to choose methods that benefit the business (lower transaction fees). Offer exclusive deals for specific payment channels.
-
Perform the chi-square test of association using the payment method and product category data discussed in the previous example.
1. Open the
payment_method_product_categories.xlsx file.
2. The first task that needs to be completed is to calculate the expected frequencies if the null hypothesis is true. That is, if the payment method and product categories were independent, not related to each other, what would the expected frequencies in the contingency table be?
To calculate the expected frequencies for each of the cells, you use the following formula:

where

is the expected frequency if the null hypothesis is true.
Create a blank table right beside the contingency table that contains the observed counts in the Excel workbook.
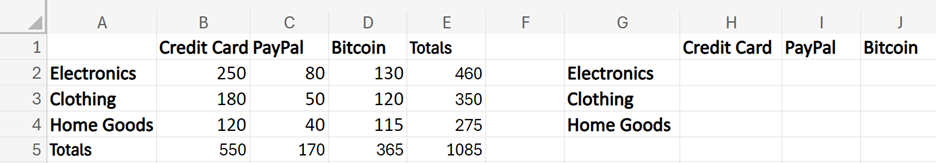
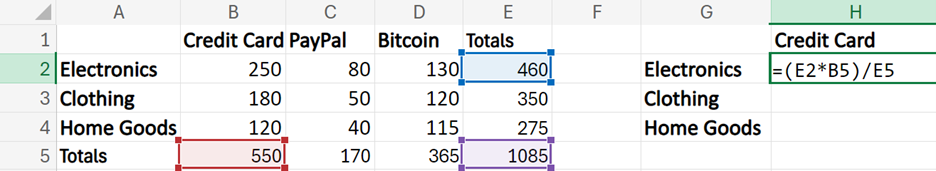
3. Calculate the first expected frequency for the Electronics/Credit Card cell. In cell H2, enter the following formula:
=(E2*B5)/E5
4. Repeat this process to calculate the expected frequencies for all the cells of the contingency table. The formulas are shown below.
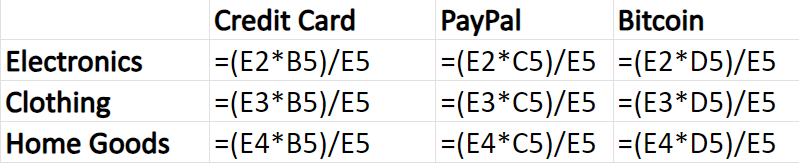
The expected frequencies are shown below.
5. Use the CHISQ.TEST() function to find the p-value from the Chi-square test. The CHISQ.TEST() has two arguments. The first argument is the range of data for the observed frequencies. The second argument is the range of data for the expected frequencies.
Select an empty cell, type the following formula, and select
ENTER.
=CHISQ.TEST(B2:D4,H2:J4)
The p-value should populate the cell as 0.004831106.
6. Make a decision. Since the p-value is less than the standard level of significance value of 0.05, you can reject the null hypothesis and accept the alternative hypothesis. You conclude that there is a relationship between payment method and product category.
7. Check your work by comparing the results of your chi-square test to the one in the example.
-
Follow along with this video on performing a chi-square test with Excel.
-
It is important to remember from the
Introduction to Statistics class that there are just two possible conclusions when it comes to hypothesis testing:
- Reject the null hypothesis: If the p-value is less than the chosen significance level (commonly 0.05), you reject the null hypothesis. This suggests that there is enough evidence to support the alternative hypothesis.
- Fail to reject the null hypothesis: If the p-value is greater than the significance level, you fail to reject the null hypothesis. This means there is not enough evidence to support the alternative hypothesis, but it does not prove that the null hypothesis is true. In fact, you should never conclude that the null hypothesis is true.
Recall that from the previous example, the chi-square test of association is testing the following:
-
 no association between payment method and product categories
-
 association exists between payment method and product categories
Suppose that the p-value had been greater than 0.05, then you would have failed to reject the null hypothesis.
When you fail to reject the null hypothesis, interpreting the results of the test can be tricky because of the ambiguity involved. Failing to reject the null hypothesis does not confirm that the null hypothesis is true. It simply means there is not enough evidence to support the alternative hypothesis.
The way you could interpret the results of this test, if you failed to reject the null hypothesis, would be:
There is not enough evidence to conclude that a significant association exists between payment method and product type.
Interpreting what it means to reject or fail to reject the null hypothesis in a way that is relevant to the business context helps ensure that the findings are actionable. For instance, if you fail to reject the null hypothesis, you might explain that the choice of payment method does not appear to influence the type of product purchased. This means that marketing strategies or payment options do not need to be adjusted based on product type, allowing the business to focus resources on other areas that might have a more significant impact.
-
- Chi-Square Test of Association
- A statistical method used to determine if an association exists between two categorical variables.
In this lesson, you were introduced to how categorical data can be represented in crosstabulations. An example was provided illustrating how to read data from a crosstabulation and what business implications can be gleaned from it. A chi-square test of association was presented that provides a statistical method for determining if a relationship exists between two categorical variables.