Table of Contents |
Data are values that are collected about some phenomena. In business data analytics, this phenomenon is a business process that occurs. A variable is something of interest being measured or observed. An observation is the value that the variable takes on. A data set is the collection of variables with corresponding observations. Variables are the columns in a data set and observations are the rows.
The figure below shows a snapshot of a typical data set. This data is product data related to baby and child health products that are sold at Walgreens, a national retail pharmacy. The table shown has five observations (rows) and eight variables (columns). Each row is an observation and represents a baby and child healthcare product that was sold at a Walgreens store in a certain region of the country. The format of the data shown in the figure below is known as structured data. Structured data is data that is stored in a column and row format like that shown in the figure below.
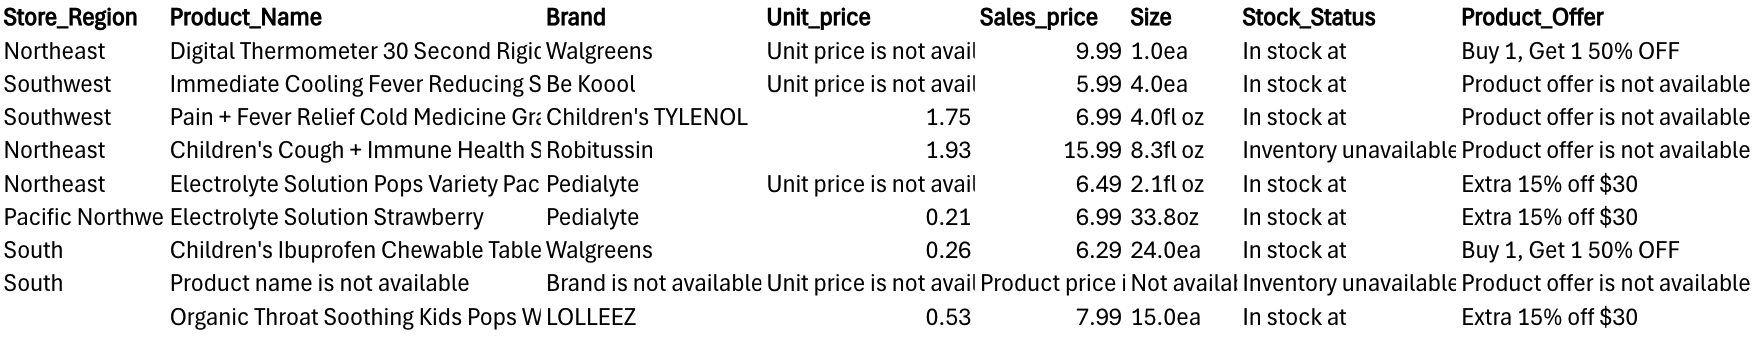
Cross-sectional data is data collected at one point in time. For example, if you were told that the baby and children's product data from Walgreens were products sold at Walgreens stores on June 24th, then this data would be cross-sectional data.

Businesses like Walgreens could use this cross-sectional data in a variety of ways.
| Number of Stores in Southwestern Region In/Out-of-Stock for Children’s Medicines | ||
|---|---|---|
| Brand | In-Stock | Out-of-Stock |
| Children’s Tylenol | 5 | 10 |
| Little Remedies | 11 | 4 |
| Children’s Delsym | 8 | 7 |
The table constructed can be used to assist stores in stocking the correct number of brands of cough syrup. A data analyst could produce this table daily or weekly to provide visibility of the stock for the product. This visibility enables quicker restocking decisions and efficient merchandise replenishment.
 Time series data are collected at regular intervals and over time. Time series data can be used to discover what has happened in the past, identify trends and patterns over time, and help projections for the future.
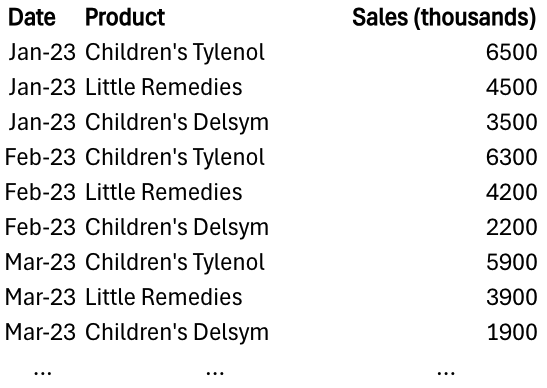
The structure of time series data looks different from cross-sectional data. Continuing with the Walgreens example, the table at right is an example of time series data for children’s cough syrup. Unlike the cross-sectional data table shown in the previous section, there are multiple rows for the same product. Each row contains sales information related to a certain children's cough product for a different time (each month in this case).
The way you use time series data is different from cross-sectional data. Time series data can track products over time so Walgreens could use the data in the table to forecast and understand how the sales of the products change over time.
Using the data in the table above, a time series graph like the one shown below could be constructed. The time series graph shows the sales of the three cough syrup products for each month in 2023. This graph could be used for trend analysis. For example, if Walgreens sees that most sales occur during December and January, store inventory can be adjusted accordingly. Walgreens can clearly see which product has sold the most in the past (Children’s Tylenol) and ensure there is plenty of that product in stock. Children’s Tylenol is clearly the market leader for children’s cough medicine. If Walgreens wanted to measure the effectiveness of an advertising campaign in August, they would want to be sure they were considering the regular seasonal trends.
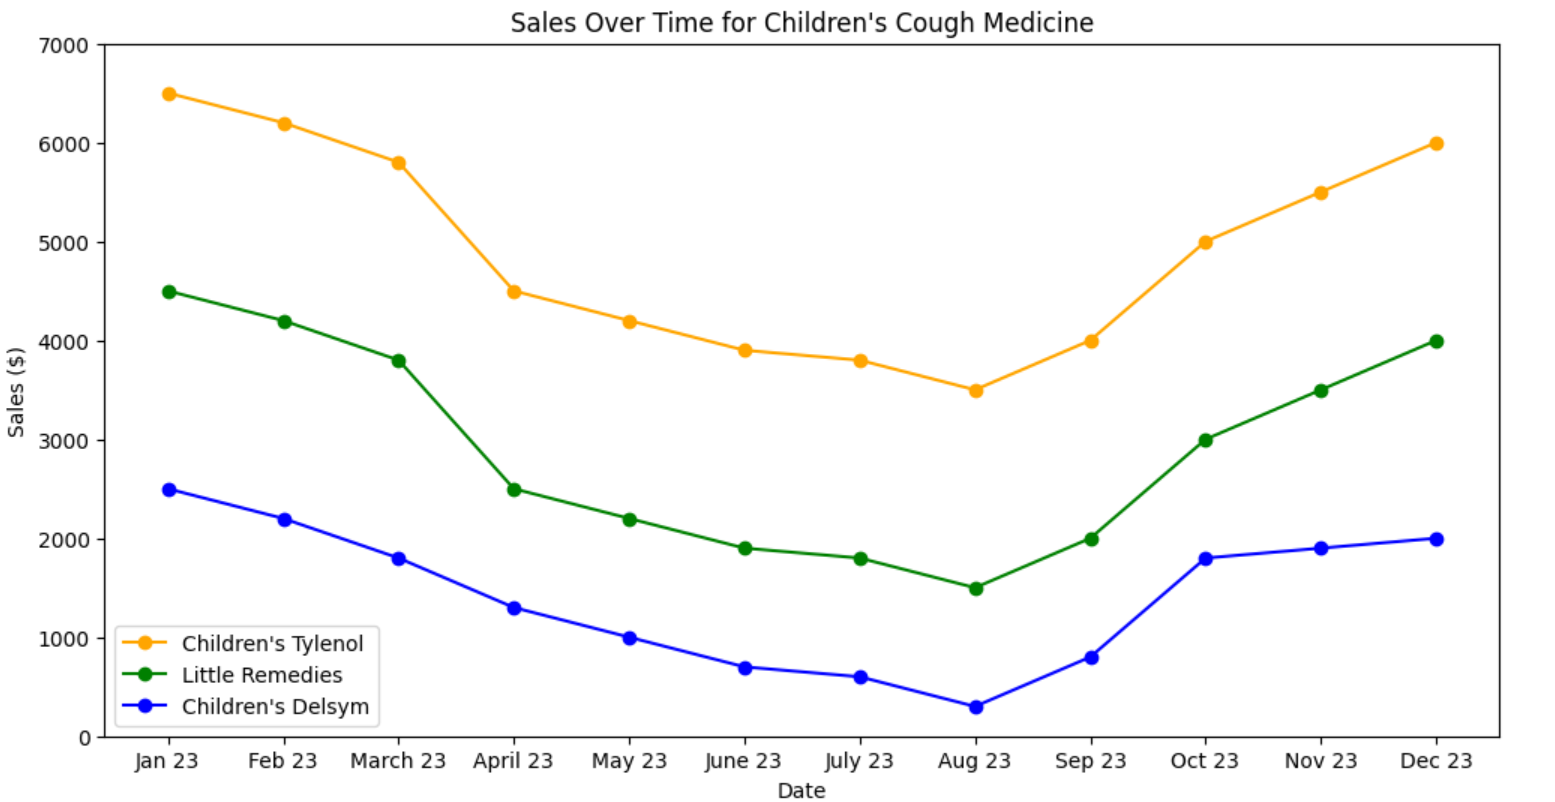
The seasonality of cough medicine sales can inform effective marketing strategies for ancillary products like cough drops. The marketing team at Walgreens can align their campaigns with these time periods to maximize visibility and sales. For example, care packages could be created that contain cough syrup and cough drops. These care packages could be set up using an eye-catching display that is strategically located in the pharmacy aisles. Walgreens could create flu prevention tips on social media or in-store signage. Cough drops could be positioned as part of a proactive health strategy.
Cross-sectional data captures a view of the data at a specific point in time. Whereas, time series data tracks a variable’s values over a continuous sequence of time intervals (e.g., days, months, years).
| Cross-Sectional | Time Series | |
|---|---|---|
| Collection | One point in time | Regular intervals of time |
| Purpose | Characterize the data at one moment in time | Identifying trends, patterns, and cycles |
Source: THIS TUTORIAL WAS AUTHORED BY SOPHIA LEARNING. PLEASE SEE OUR TERMS OF USE.
REFERENCES
Product data from Walgreens - dataset by Data-Hut. (2024, July 8). data.world. www.data.world/data-hut/product-data-from-walgreens