Table of Contents |
Firms produce and sell goods and services to households in a variety of product markets. A market is any place where resources, goods, and services are bought and sold. A market can be referred to as an industry. An industry is a collection of firms engaged in producing and selling similar goods or services, and competing against one another in the same market. In the U.S. soap and detergent market, buyers have a wide array of choices sold by about 670 firms. Dish soaps come in a variety of colors, brands, and formulas: standard, degreasers, powder, tablets, and eco-friendly brands with natural ingredients. In other markets, buyer choice is more limited. For example, there are only 85 firms in the U.S. breakfast cereal industry.
There are various ways to measure, classify, and compare industries, such as highest in sales, largest in employment, and highest risk. In the U.S. the largest industry is real estate, based on sales revenue. Healthcare is the largest industry in terms of employment, accounting for 13.8% of employment. Sawmills and lumber production are one of the riskiest industries in the U.S.
Concentration is one measure of the level of competition or lack thereof in an industry. Higher market concentration implies a lower intensity of competition among firms. Market concentration measures the extent to which market shares are concentrated between a small number of firms. If a market has only two firms producing similar products, then two firms share 100% of the market. The market share held by the firms need not be equal. One firm could have 80% of total sales, while the other firm has the remaining 20% of sales.
Market share refers to a firm’s percentage of total market sales. In 2022, the top producers in the U.S. ready-to-eat breakfast cereal market were General Mills (43%), Kellogg’s (27%), Quaker (15%), and Post Holdings (10%). The search engine market is highly concentrated with Google the dominant player.
A concentration ratio represents the portion of the market held up by the largest firms. A concentration ratio is the percentage of market share taken up by the largest firms. The ratio can range from 0 to 100, and markets are examined as the top three or top four firms in an industry. The concentration ratio of the top four firms in the ready-to-eat breakfast cereal industry is 95%, which is the sum of the market share of each of the top four firms.
Concentration ratios provide information about the degree of competition in a market. Every market experiences some degree of pressure between firms attempting to monopolize or dominate the market. This is not unlike a sporting event between two teams competing to seize the ball. In a market, firms compete against one another to gain greater leverage in setting product prices.
Most firms seek to influence their products’ price. Market power is the ability of a firm to influence the price of their product or service. In some markets, competitive forces outweigh monopolistic forces. A fragmenting of a market into many, many small firms with low market shares will, typically, result in lower market prices, as firms compete more vigorously for market shares. In other markets monopolistic forces outweigh competitive forces. A market with rising concentration ratios is an indicator of a fall in competitive pressure. Dominance by a few large players in the market can lead to higher consumer prices.
EXAMPLE
Market concentration ratios are a helpful measure for classifying markets. Market structure refers to how different industries are differentiated, based on attributes that influence the behavior of sellers and buyers.
The structure of a market is affected by the number of sellers. When the number of sellers is quite large, and each seller’s share of the market is small, then an individual seller has little to no ability to influence the market price of its product.
The structure of a market is affected by the extent to which those who buy the goods and services prefer some products over other similar products. In some industries, the products are regarded as identical by their buyers: for example, basic green bell peppers or baby carrots. Products that are identical to products from other suppliers are referred to as homogeneous products. In other markets, buyers discern slight differences among the products, so different buyers prefer different products: all breakfast cereals are breakfast cereals, but Cheerios are not the same as Frosted Flakes. Buyers see a difference. Products that are differentiated from other suppliers' products are referred to as heterogeneous products.
The structure of a market is affected by the ease with which new sellers can enter. If there are obstacles that make it difficult to gain entry into the market, then the established sellers can earn profits without attracting new competitors.
Markets can be classified by their market structure. The following graphic shows the four types of market structures arranged along a continuum, from most competitive and no influence over prices, to least competitive and most influence over prices.
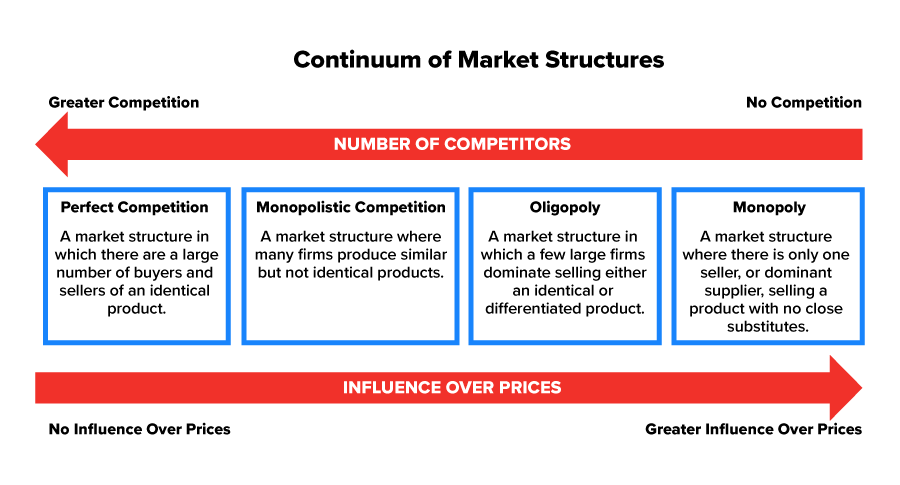
In the continuum of market structures graphic above, the market structures are arranged from left to right according to the amount of competition and influence over prices.
| Characteristic | Perfect Competition | Monopoly | Monopolistic Competition | Oligopoly |
|---|---|---|---|---|
| Number of Sellers | Large | One | Many | Few |
| Barriers to Entry | None | Significant | Few | Significant |
| Nature of Product | Identical | No Close Substitutes | Similar but Not Identical | Identical or Differentiated |
| Information | Perfect (Symmetric) Information | Imperfect (Asymmetric) Information | Imperfect (Asymmetric) Information | Imperfect (Asymmetric) Information |
| Market Power | None | Significant | Low | Significant |
| Pricing Power | Price Taker | Price Setter | Price Setter | Price Setter |
| Demand Curve | Horizontal | Downward Sloping | Downward Sloping | Downward Sloping |
| Example | Green Bell Pepper Sellers at Farmer's Market | Local Utility Companies | Local Retail Gasoline | Microchip Industry |
Source: THIS TUTORIAL HAS BEEN ADAPTED FROM OPENSTAX “PRINCIPLES OF ECONOMICS 2E”. ACCESS FOR FREE AT https://openstax.org/books/principles-economics-2e/pages/1-introduction. LICENSE: CC ATTRIBUTION 4.0 INTERNATIONAL.
REFERENCES
Industry market research, reports, and statistics. IBISWorld. (n.d.). Retrieved July 24, 2022, from www.ibisworld.com/united-states/industry-trends/riskiest-industries/
Dkim. (2022, April 6). Inflation shakes up cereal market share. Earnest Research. Retrieved July 24, 2022, from www.earnestresearch.com/inflation-shakes-up-cereal-market-share/
Dun & Bradstreet. (2022, June 6). Soap & Other Detergent Manufacturing Industry Profile. First Research. Retrieved July 24, 2022, from www.firstresearch.com/Industry-Research/Soap-and-Other-Detergent-Manufacturing.html
Statista. (2022, July 27). Global Search Engine Market Share 2022. Statista. Retrieved August 12, 2022, from www.statista.com/statistics/216573/worldwide-market-share-of-search-engines/