Table of Contents |
A confidence interval using the t-distribution is very similar to a hypothesis test. In fact, it is preferred to a hypothesis test because we have an estimate and a conclusion that can be made equivalent to a two-tailed test.
When calculating the confidence interval for a sampling distribution, you would normally take the sample mean plus or minus some number of standard deviations times the standard error, or  .
.
However, the only problem is this formula has a sigma in it, which is the population standard deviation. For situations where we don't know what the population standard deviation is, you have to replace this formula with one that uses "s," or the sample standard deviation.
Since you're using s as a stand-in for sigma, you need to use the t-distribution instead and come up with the following formula:

To construct a confidence interval for population means using the t-distribution, the following steps must be followed:
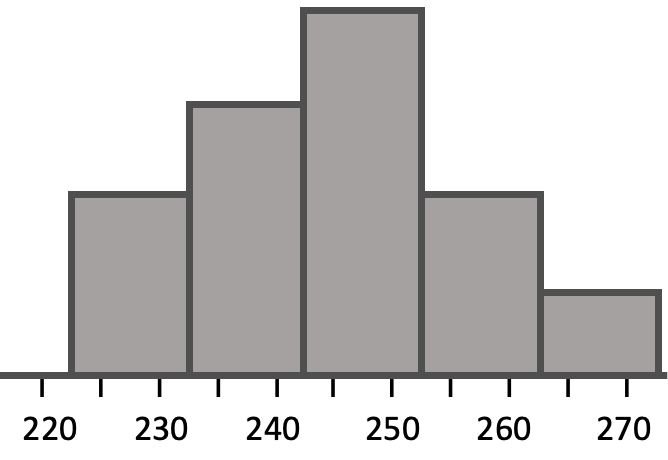
EXAMPLE
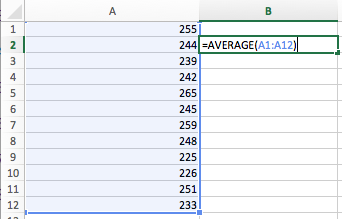
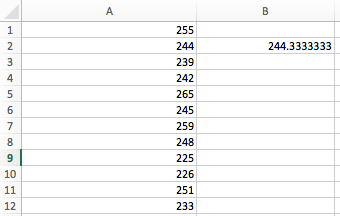
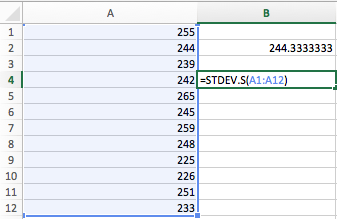
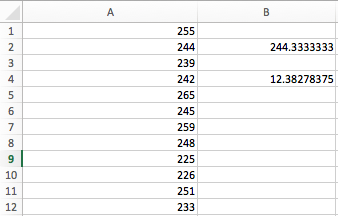
Many times, consumers will pay attention to nutritional contents on packaged food, so it's important to make them accurate as to what the food product actually contains. Suppose, for example, that the stated calorie content for a particular frozen dinner was 240.| 255 | 244 | 239 | 242 | 265 | 245 |
| 259 | 248 | 225 | 226 | 251 | 233 |
| Condition | Description |
| Randomness | How was the sample obtained? |
| Independence | Population ≥ 10n |
| Normality | n ≥ 30 or normal parent distribution |


| T-Distribution Critical Values | ||||||||||||
|---|---|---|---|---|---|---|---|---|---|---|---|---|
| Tail Probability, p | ||||||||||||
| One-tail | 0.25 | 0.20 | 0.15 | 0.10 | 0.05 | 0.025 | 0.02 | 0.01 | 0.005 | 0.0025 | 0.001 | 0.0005 |
| Two-tail | 0.50 | 0.40 | 0.30 | 0.20 | 0.10 | 0.05 | 0.04 | 0.02 | 0.01 | 0.005 | 0.002 | 0.001 |
| df | ||||||||||||
| 1 | 1.000 | 1.376 | 1.963 | 3.078 | 6.314 | 12.71 | 15.89 | 31.82 | 63.66 | 127.3 | 318.3 | 636.6 |
| 2 | 0.816 | 1.080 | 1.386 | 1.886 | 2.920 | 4.303 | 4.849 | 6.965 | 9.925 | 14.09 | 22.33 | 31.60 |
| 3 | 0.765 | 0.978 | 1.250 | 1.638 | 2.353 | 3.182 | 3.482 | 4.541 | 5.841 | 7.453 | 10.21 | 12.92 |
| 4 | 0.741 | 0.941 | 1.190 | 1.533 | 2.132 | 2.776 | 2.999 | 3.747 | 4.604 | 5.598 | 7.173 | 8.610 |
| 5 | 0.727 | 0.920 | 1.156 | 1.476 | 2.015 | 2.571 | 2.757 | 3.365 | 4.032 | 4.773 | 5.893 | 6.869 |
| 6 | 0.718 | 0.906 | 1.134 | 1.440 | 1.943 | 2.447 | 2.612 | 3.143 | 3.707 | 4.317 | 5.208 | 5.959 |
| 7 | 0.711 | 0.896 | 1.119 | 1.415 | 1.895 | 2.365 | 2.517 | 2.998 | 3.499 | 4.029 | 4.785 | 5.408 |
| 8 | 0.706 | 0.889 | 1.108 | 1.397 | 1.860 | 2.306 | 2.449 | 2.896 | 3.355 | 3.833 | 4.501 | 5.041 |
| 9 | 0.703 | 0.883 | 1.100 | 1.383 | 1.833 | 2.262 | 2.398 | 2.821 | 3.250 | 3.690 | 4.297 | 4.781 |
| 10 | 0.700 | 0.879 | 1.093 | 1.372 | 1.812 | 2.228 | 2.359 | 2.764 | 3.169 | 3.581 | 4.144 | 4.587 |
| 11 | 0.697 | 0.876 | 1.088 | 1.363 | 1.796 | 2.201 | 2.328 | 2.718 | 3.106 | 3.497 | 4.025 | 4.437 |
| 12 | 0.695 | 0.873 | 1.083 | 1.356 | 1.782 | 2.179 | 2.303 | 2.681 | 3.055 | 3.428 | 3.930 | 4.318 |
| 13 | 0.694 | 0.870 | 1.079 | 1.350 | 1.771 | 2.160 | 2.282 | 2.650 | 3.012 | 3.372 | 3.852 | 4.221 |
| 14 | 0.692 | 0.868 | 1.076 | 1.345 | 1.761 | 2.145 | 2.264 | 2.624 | 2.977 | 3.326 | 3.787 | 4.140 |
| 15 | 0.691 | 0.866 | 1.074 | 1.341 | 1.753 | 2.131 | 2.249 | 2.602 | 2.947 | 3.286 | 3.733 | 4.073 |
| 16 | 0.690 | 0.865 | 1.071 | 1.337 | 1.746 | 2.120 | 2.235 | 2.583 | 2.921 | 3.252 | 3.686 | 4.015 |
| 17 | 0.689 | 0.863 | 1.069 | 1.333 | 1.740 | 2.110 | 2.224 | 2.567 | 2.898 | 3.222 | 3.646 | 3.965 |
| 18 | 0.688 | 0.862 | 1.067 | 1.330 | 1.734 | 2.101 | 2.214 | 2.552 | 2.878 | 3.197 | 3.610 | 3.922 |
| 19 | 0.688 | 0.861 | 1.066 | 1.328 | 1.729 | 2.093 | 2.205 | 2.539 | 2.861 | 3.174 | 3.579 | 3.883 |
| 20 | 0.687 | 0.860 | 1.064 | 1.325 | 1.725 | 2.086 | 2.197 | 2.528 | 2.845 | 3.153 | 3.552 | 3.850 |
| 21 | 0.686 | 0.859 | 1.063 | 1.323 | 1.721 | 2.080 | 2.189 | 2.518 | 2.831 | 3.135 | 3.527 | 3.819 |
| 22 | 0.686 | 0.858 | 1.061 | 1.321 | 1.717 | 2.074 | 2.183 | 2.508 | 2.819 | 3.119 | 3.505 | 3.792 |
| 23 | 0.685 | 0.858 | 1.060 | 1.319 | 1.714 | 2.069 | 2.177 | 2.500 | 2.807 | 3.104 | 3.485 | 3.767 |
| 24 | 0.685 | 0.857 | 1.059 | 1.318 | 1.711 | 2.064 | 2.172 | 2.492 | 2.797 | 3.091 | 3.467 | 3.745 |
| 25 | 0.684 | 0.856 | 1.058 | 1.316 | 1.708 | 2.060 | 2.167 | 2.485 | 2.787 | 3.078 | 3.450 | 3.725 |
| 26 | 0.684 | 0.856 | 1.058 | 1.315 | 1.706 | 2.056 | 2.162 | 2.479 | 2.779 | 3.067 | 3.435 | 3.707 |
| 27 | 0.684 | 0.855 | 1.057 | 1.314 | 1.703 | 2.052 | 2.158 | 2.473 | 2.771 | 3.057 | 3.421 | 3.690 |
| 28 | 0.683 | 0.855 | 1.056 | 1.313 | 1.701 | 2.048 | 2.154 | 2.467 | 2.763 | 3.047 | 3.408 | 3.674 |
| 29 | 0.683 | 0.854 | 1.055 | 1.311 | 1.699 | 2.045 | 2.150 | 2.462 | 2.756 | 3.038 | 3.396 | 3.659 |
| 30 | 0.683 | 0.854 | 1.055 | 1.310 | 1.697 | 2.042 | 2.147 | 2.457 | 2.750 | 3.030 | 3.385 | 3.646 |
| 40 | 0.681 | 0.851 | 1.050 | 1.303 | 1.684 | 2.021 | 2.123 | 2.423 | 2.704 | 2.971 | 3.307 | 3.551 |
| 50 | 0.679 | 0.849 | 1.047 | 1.299 | 1.676 | 2.009 | 2.109 | 2.403 | 2.678 | 2.937 | 3.261 | 3.496 |
| 60 | 0.679 | 0.848 | 1.045 | 1.296 | 1.671 | 2.000 | 2.099 | 2.390 | 2.660 | 2.915 | 3.232 | 3.460 |
| 80 | 0.678 | 0.846 | 1.043 | 1.292 | 1.664 | 1.990 | 2.088 | 2.374 | 2.639 | 2.887 | 3.195 | 3.416 |
| 100 | 0.677 | 0.845 | 1.042 | 1.290 | 1.660 | 1.984 | 2.081 | 2.364 | 2.626 | 2.871 | 3.174 | 3.390 |
| 1000 | 0.675 | 0.842 | 1.037 | 1.282 | 1.646 | 1.962 | 2.056 | 2.330 | 2.581 | 2.813 | 3.098 | 3.300 |
| >1000 | 0.674 | 0.841 | 1.036 | 1.282 | 1.645 | 1.960 | 2.054 | 2.326 | 2.576 | 2.807 | 3.091 | 3.291 |
| Confidence Interval Between -t and t | ||||||||||||
| 50% | 60% | 70% | 80% | 90% | 95% | 96% | 98% | 99% | 99.5% | 99.8% | 99.9% | |


Source: THIS TUTORIAL WAS AUTHORED BY SOPHIA LEARNING. PLEASE SEE OUR TERMS OF USE.
