Table of Contents |
If embryonic heart cells are separated into a Petri dish and kept alive, each is capable of generating its own electrical impulse followed by contraction. When two independently beating embryonic cardiac muscle cells are placed together, the cell with the higher inherent rate sets the pace, and the impulse spreads from the faster to the slower cell to trigger a contraction. As more cells are joined together, the fastest cell continues to assume control of the rate. A fully developed adult heart maintains the capability of generating its own electrical impulse, triggered by the fastest cells, as part of the cardiac conduction system. The components of the cardiac conduction system include the sinoatrial (SA) node, the atrioventricular (AV) node, the atrioventricular bundle, the atrioventricular bundle branches, and the Purkinje cells.
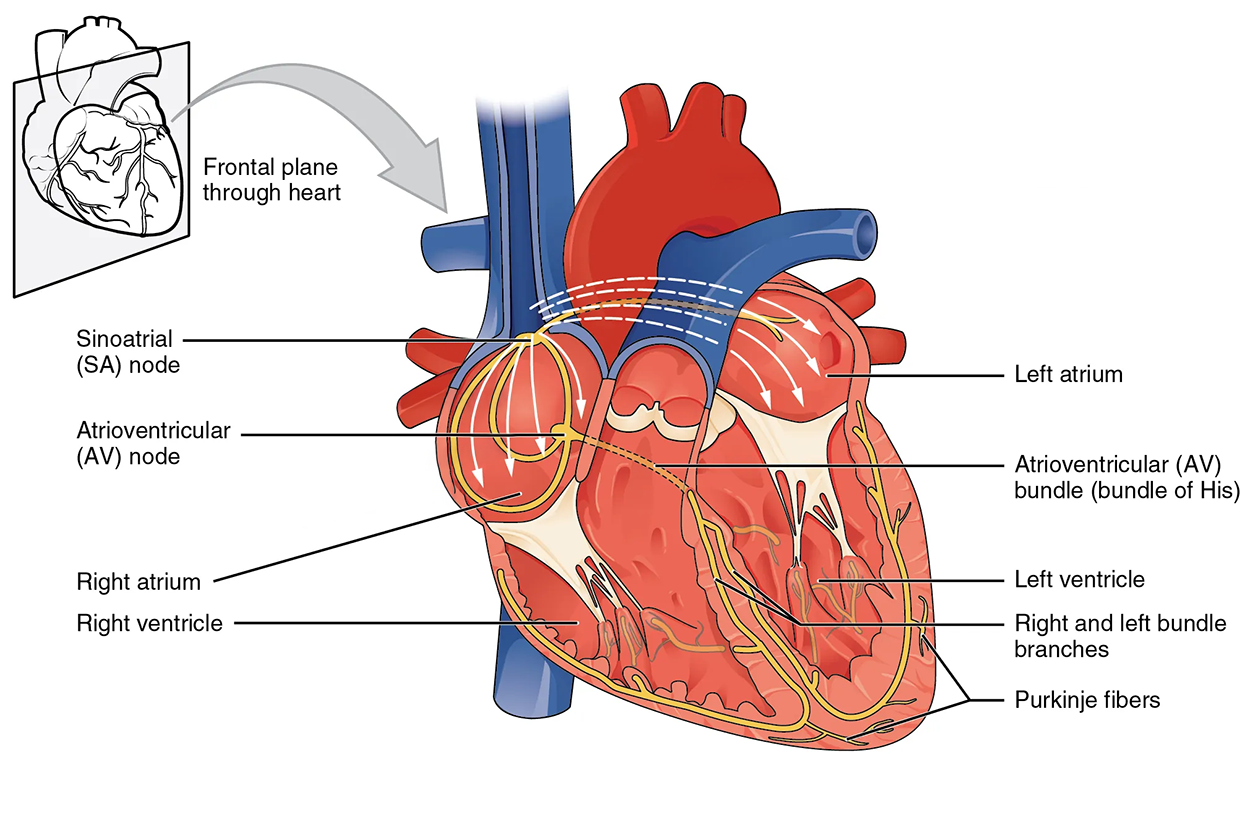
Normal cardiac rhythm is established by the sinoatrial (SA) node, a specialized clump of myocardial conducting cells located in the superior and posterior walls of the right atrium in close proximity to the orifice of the superior vena cava. The SA node has the highest inherent rate of depolarization and is known as the pacemaker of the heart. It initiates the sinus rhythm, or normal electrical pattern, followed by contraction of the heart.
This impulse spreads from its initiation in the SA node throughout the atria through specialized internodal pathways, to the atrial myocardial contractile cells and the atrioventricular node. The internodal pathways consist of three bands that lead directly from the SA node to the next node in the conduction system, the atrioventricular node. The impulse takes approximately 50 ms (milliseconds) to travel between these two nodes. The relative importance of this pathway has been debated, since the impulse would reach the atrioventricular node simply following the cell-by-cell pathway through the contractile cells of the myocardium in the atria. In addition, there is a specialized pathway called Bachmann’s bundle or the interatrial band that conducts the impulse directly from the right atrium to the left atrium. Regardless of the pathway, as the impulse reaches the atrioventricular septum, the connective tissue of the cardiac skeleton prevents the impulse from spreading into the myocardial cells in the ventricles except at the atrioventricular node. The animation below illustrates the initiation of the impulse in the SA node that then spreads the impulse throughout the atria to the atrioventricular node.
The electrical event, the wave of depolarization, is the trigger for muscular contraction. The wave of depolarization begins in the right atrium, and the impulse spreads across the superior portions of both atria and then down through the contractile cells. The contractile cells then begin contraction from the superior to the inferior portions of the atria, efficiently pumping blood into the ventricles.
The atrioventricular (AV) node is a second clump of specialized myocardial conductive cells, located in the inferior portion of the right atrium within the atrioventricular septum. The septum prevents the impulse from spreading directly to the ventricles without passing through the AV node. There is a critical pause before the AV node depolarizes and transmits the impulse to the atrioventricular bundle (see step 3 of the figure). This delay in transmission is partially attributable to the small diameter of the cells of the node, which slows the impulse. Also, conduction between nodal cells is less efficient than between conducting cells. These factors mean that it takes the impulse approximately 100 ms to pass through the node. This pause is critical to heart function, as it allows the atrial cardiomyocytes to complete their contraction that pumps blood into the ventricles before the impulse is transmitted to the cells of the ventricle itself. With extreme stimulation by the SA node, the AV node can transmit impulses maximally at 220 per minute. This establishes the typical maximum heart rate in a healthy young individual. Damaged hearts or those stimulated by drugs can contract at higher rates, but at these rates, the heart can no longer effectively pump blood.
Arising from the AV node, the atrioventricular bundle, or bundle of His, proceeds through the interventricular septum before dividing into two atrioventricular bundle branches, commonly called the left and right bundle branches. The left bundle branch has two fascicles. The left bundle branch supplies the left ventricle, and the right bundle branch the right ventricle. Since the left ventricle is much larger than the right, the left bundle branch is also considerably larger than the right. Portions of the right bundle branch are found in the moderator band and supply the right papillary muscles. Because of this connection, each papillary muscle receives the impulse at approximately the same time, so they begin to contract simultaneously just prior to the remainder of the myocardial contractile cells of the ventricles. This is believed to allow tension to develop on the chordae tendineae prior to right ventricular contraction. There is no corresponding moderator band on the left. Both bundle branches descend and reach the apex of the heart, where they connect with the Purkinje fibers.
The Purkinje fibers are additional myocardial conductive fibers that spread the impulse to the myocardial contractile cells in the ventricles. They extend throughout the myocardium from the apex of the heart toward the atrioventricular septum and the base of the heart. Since the electrical stimulus begins at the apex, the contraction also begins at the apex and travels toward the base of the heart. This allows the blood to be pumped out of the ventricles and into the aorta and pulmonary trunk.
Action potentials are considerably different between cardiac conductive cells and cardiac contractile cells. While Na⁺ and K⁺ play essential roles, Ca²⁺ is also critical for both types of cells. Unlike skeletal muscles and neurons, cardiac conductive cells do not have a stable resting potential. Conductive cells contain a series of sodium ion channels that allow a normal and slow influx of sodium ions that causes the membrane potential to rise slowly from an initial value of −60 mV up to about –40 mV. The resulting movement of sodium ions creates spontaneous depolarization (or prepotential depolarization). At this point, calcium ion channels open and Ca²⁺ enters the cell, further depolarizing it at a more rapid rate until it reaches a value of approximately +15 mV. At this point, the calcium ion channels close and K⁺ channels open, allowing outflux of K⁺ and resulting in repolarization. When the membrane potential reaches approximately −60 mV, the K⁺ channels close and Na⁺ channels open, and the prepotential phase begins again. This phenomenon explains the autorhythmicity properties of cardiac muscle.
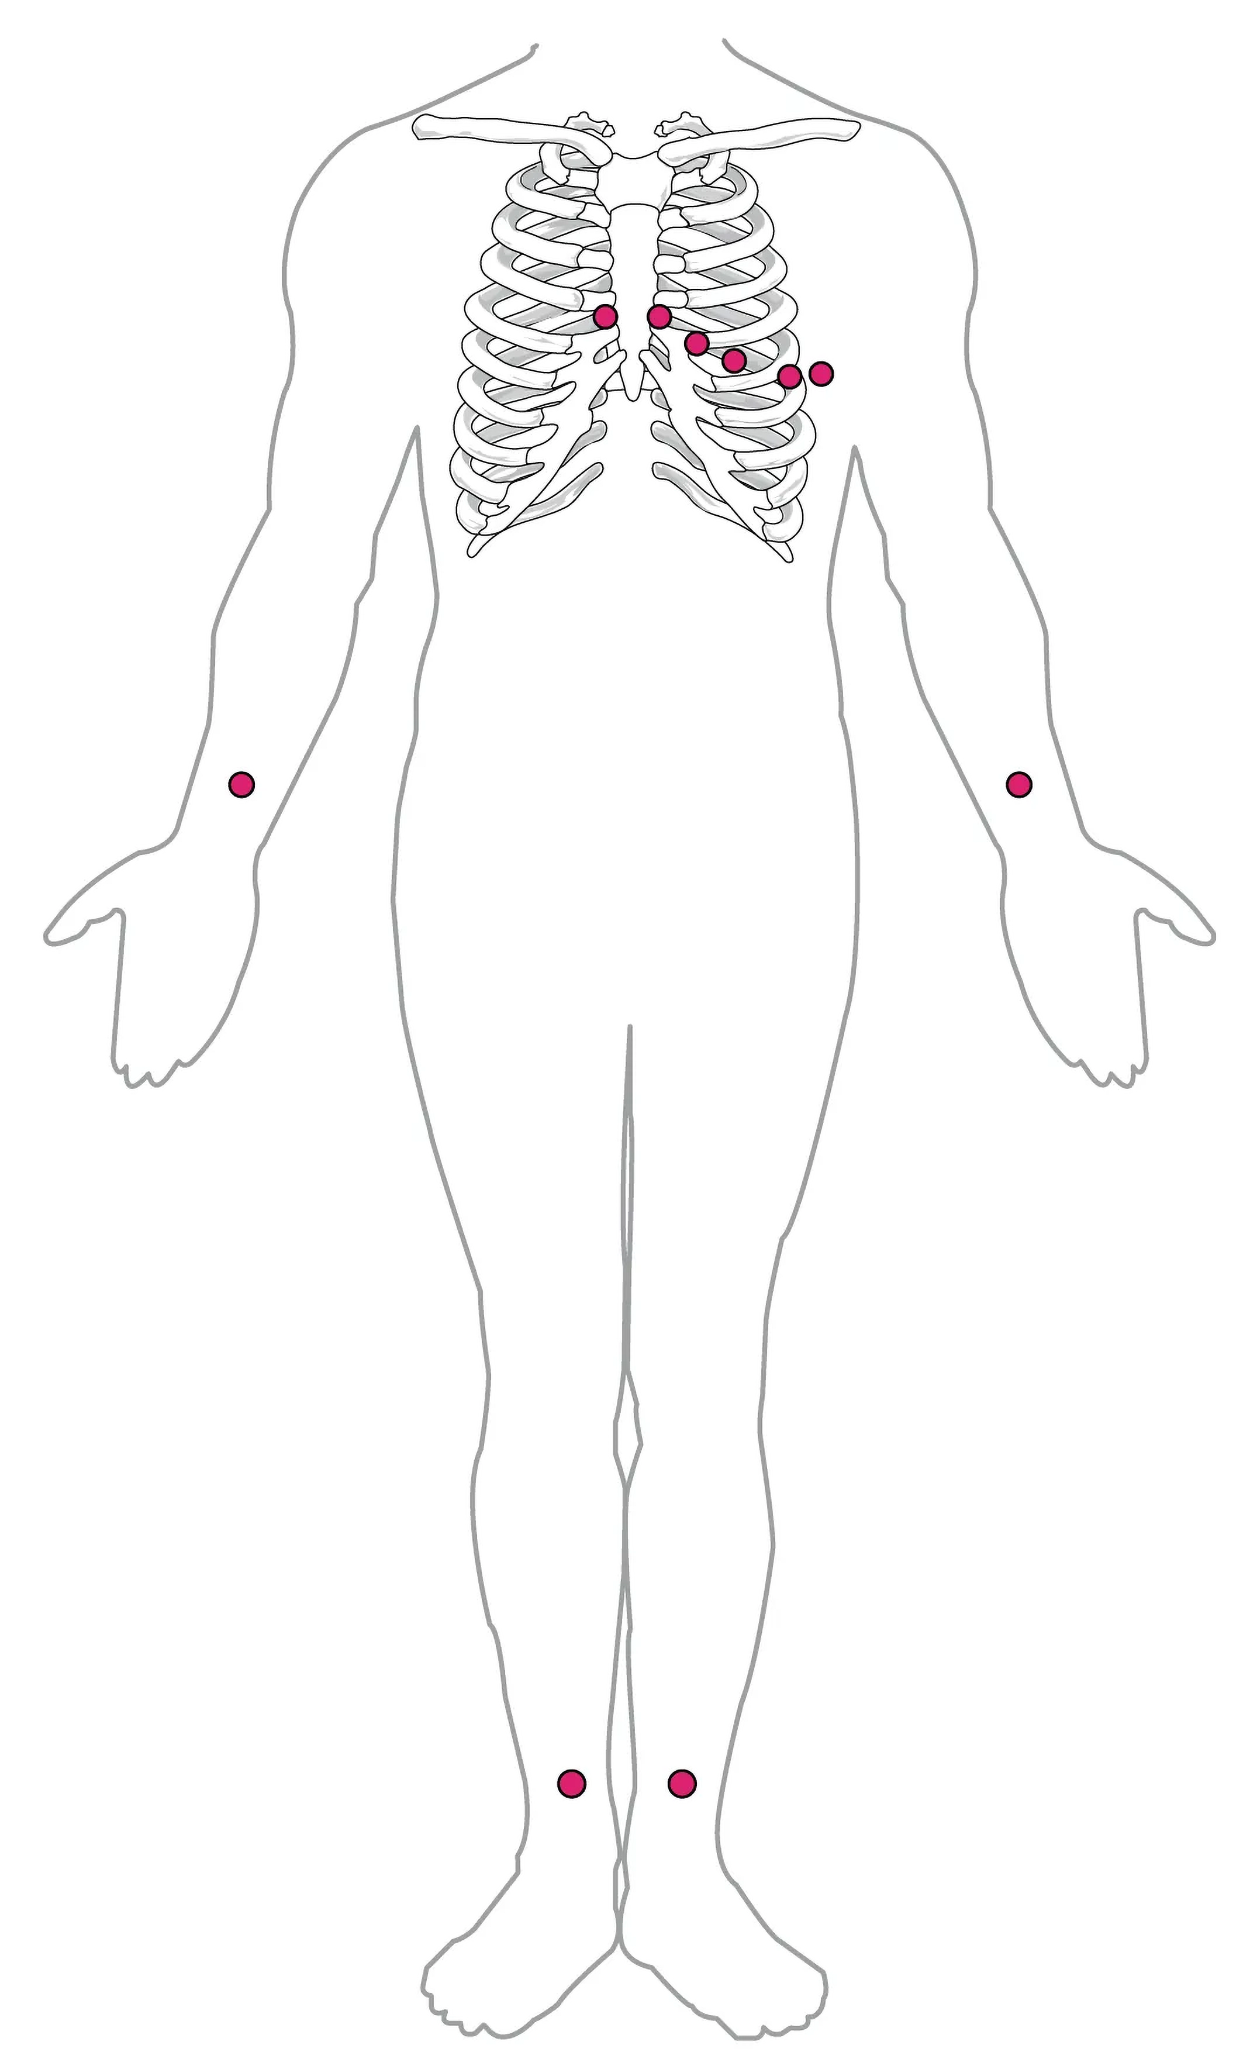
By careful placement of surface electrodes on the body, it is possible to record the complex, compound electrical signal of the heart. This tracing of the electrical signal is the electrocardiogram (ECG). Careful analysis of the ECG reveals a detailed picture of both normal and abnormal heart function and is an indispensable clinical diagnostic tool. The standard electrocardiograph (the instrument that generates an ECG) uses 3, 5, or 12 leads. The greater the number of leads an electrocardiograph uses, the more information the ECG provides. The term “lead” may be used to refer to the cable from the electrode to the electrical recorder, but it typically describes the voltage difference between two of the electrodes. The 12-lead electrocardiograph uses 10 electrodes placed in standard locations on the patient’s skin, as shown in the figure below. In continuous ambulatory electrocardiographs, the patient wears a small, portable, battery-operated device known as a Holter monitor, or simply a Holter, that continuously monitors heart electrical activity, typically for a period of 24 hours during the patient’s normal routine.
The illustration below shows placement of leads for an electrocardiogram: one just above each wrist, one just to each side of the sternum in the center of the chest, four curving down from the pairs of electrodes at the sternum to extend down across the left chest, and one above each ankle.
A normal ECG tracing is presented in the figure below. Each component, segment, and interval is labeled and corresponds to important electrical events, demonstrating the relationship between these events and contraction in the heart.
There are five prominent points on the ECG: the P wave, the QRS complex, and the T wave. The small P wave represents the depolarization of the atria. The atria begin contracting approximately 25 ms after the start of the P wave. The large QRS complex represents the depolarization of the ventricles, which requires a much stronger electrical signal because of the larger size of the ventricular cardiac muscle. The ventricles begin to contract as the QRS reaches the peak of the R wave. Lastly, the T wave represents the repolarization of the ventricles. The repolarization of the atria occurs during the QRS complex, which masks it on an ECG.
The figure below shows a close-up of a 1 s region of an ECG tracing.
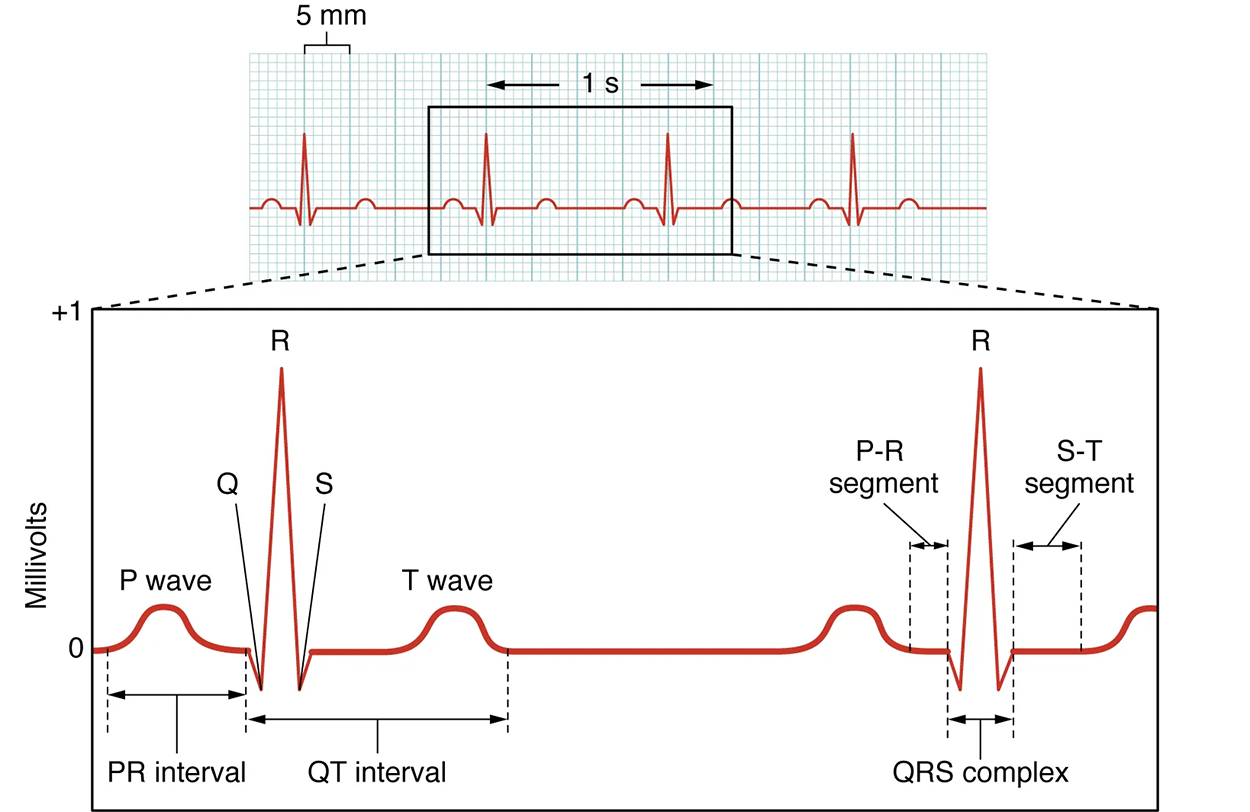
The major segments and intervals of an ECG tracing are indicated in the figure above. Segments are defined as the regions between two waves. Intervals include one segment plus one or more waves. For example, the PR segment begins at the end of the P wave and ends at the beginning of the QRS complex. The PR interval starts at the beginning of the P wave and ends with the beginning of the QRS complex. The PR interval is more clinically relevant, as it measures the duration from the beginning of atrial depolarization (the P wave) to the initiation of the QRS complex. Since the Q wave may be difficult to view in some tracings, the measurement is often extended to the R that is more easily visible. Should there be a delay in passage of the impulse from the SA node to the AV node, it would be visible in the PR interval. The animation below correlates events of heart contraction to the corresponding segments and intervals of an ECG.
Occasionally, an area of the heart other than the SA node will initiate an impulse that will be followed by a premature contraction. Such an area, which may actually be a component of the conduction system or some other contractile cells, is known as an ectopic focus or ectopic pacemaker. An ectopic focus may be stimulated by localized ischemia; exposure to certain drugs, including caffeine, digitalis, or acetylcholine; elevated stimulation by both sympathetic or parasympathetic divisions of the autonomic nervous system; or a number of disease or pathological conditions. Occasional occurrences are generally transitory and nonlife-threatening, but if the condition becomes chronic, it may lead to either an arrhythmia, a deviation from the normal pattern of impulse conduction and contraction, or to fibrillation, an uncoordinated beating of the heart.
While interpretation of an ECG is possible and extremely valuable after some training, a full understanding of the complexities and intricacies generally requires several years of experience. In general, the size of the electrical variations, the duration of the events, and detailed vector analysis provide the most comprehensive picture of cardiac function.
EXAMPLE
An amplified P wave may indicate enlargement of the atria, an enlarged Q wave may indicate a MI, and an enlarged suppressed or inverted Q wave often indicates enlarged ventricles. T waves often appear flatter when insufficient oxygen is being delivered to the myocardium. An elevation of the ST segment above baseline is often seen in patients with an acute MI, and may appear depressed below the baseline when hypoxia is occurring.As useful as analyzing these electrical recordings may be, there are limitations. For example, not all areas suffering a MI may be obvious on the ECG. Additionally, it will not reveal the effectiveness of the pumping, which requires further testing, such as an ultrasound test called an echocardiogram or nuclear medicine imaging. It is also possible for there to be pulseless electrical activity, which will show up on an ECG tracing, although there is no corresponding pumping action.
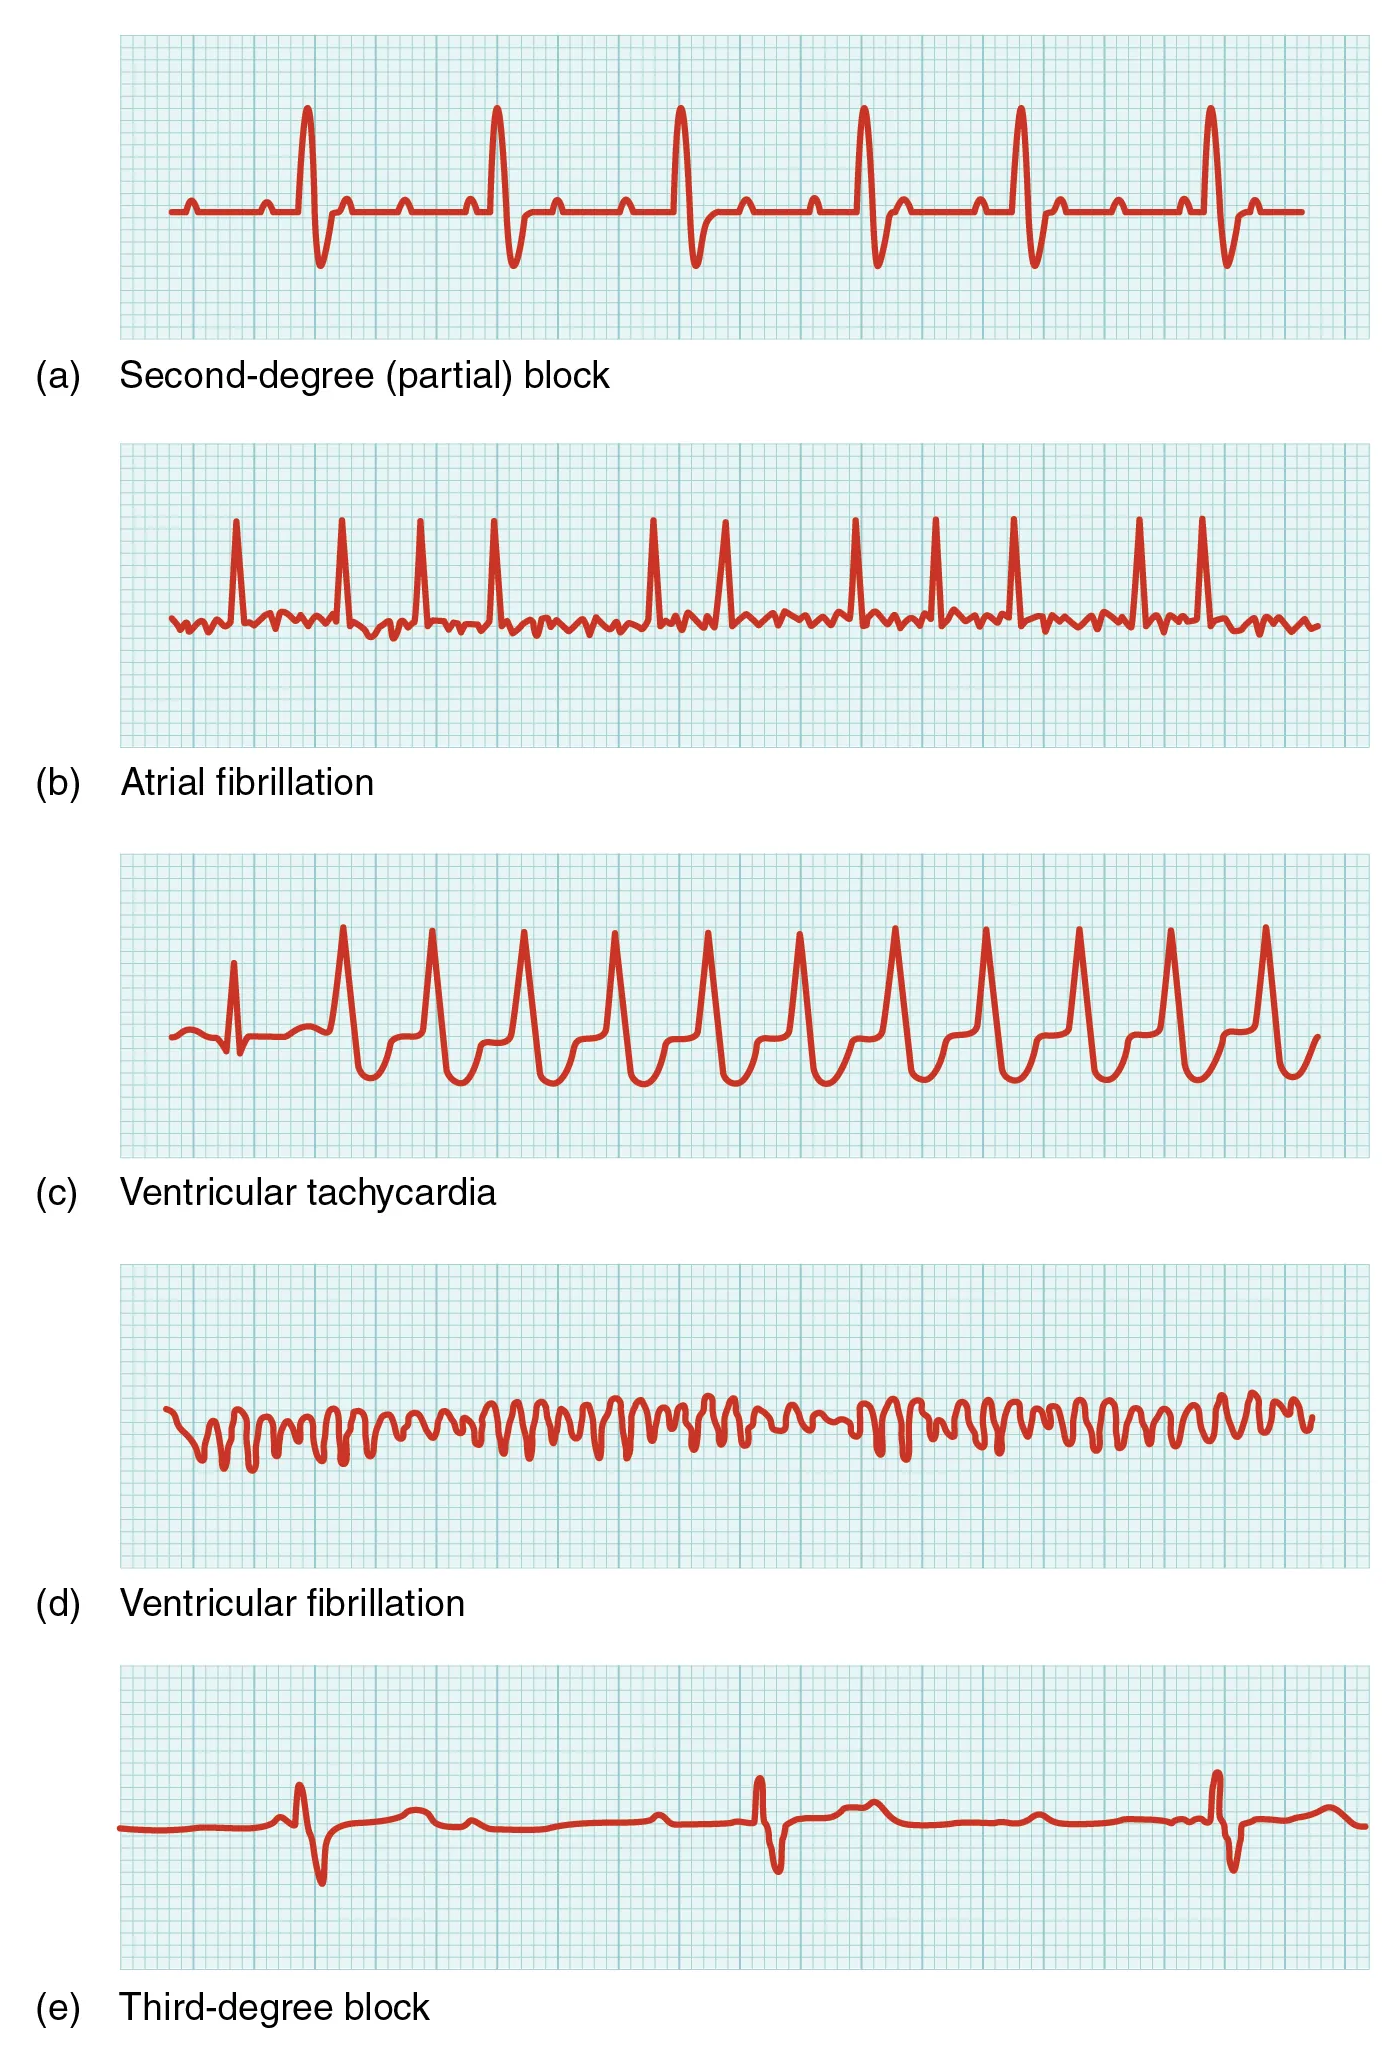
Common abnormalities that may be detected by the ECGs are shown in the figure below. The first abnormality is a second-degree (partial block; a) in which half of the P waves are followed by a QRS complex and half are not. The second abnormality (b) is atrial fibrillation, in which there is an abnormal electrical pattern characterized by very low amplitude and down movement between QRS complexes, while the QRS complexes are closer together than usual. The third abnormality, ventricular tachycardia (c), has unusually shaped QRS complexes with a distinctive “U” shape in the S component. The fourth abnormality, ventricular fibrillation (d), has an uneven, low amplitude pattern with no clear QRS complexes. The fifth abnormality, third degree block (e), has widely spaced QRS complexes and some P waves that are not followed by QRS complexes.
If the electrical activity of the heart is severely disrupted, cessation of electrical activity or fibrillation may occur. In fibrillation, the heart beats in an uncontrolled manner, which prevents it from being able to pump effectively. Atrial fibrillation is a serious condition, but as long as the ventricles continue to pump blood, the patient’s life may not be in immediate danger. Ventricular fibrillation is a medical emergency that requires life support, because the ventricles are not effectively pumping blood. In a hospital setting, it is often described as “code blue.” If untreated for as little as a few minutes, ventricular fibrillation may lead to brain death.
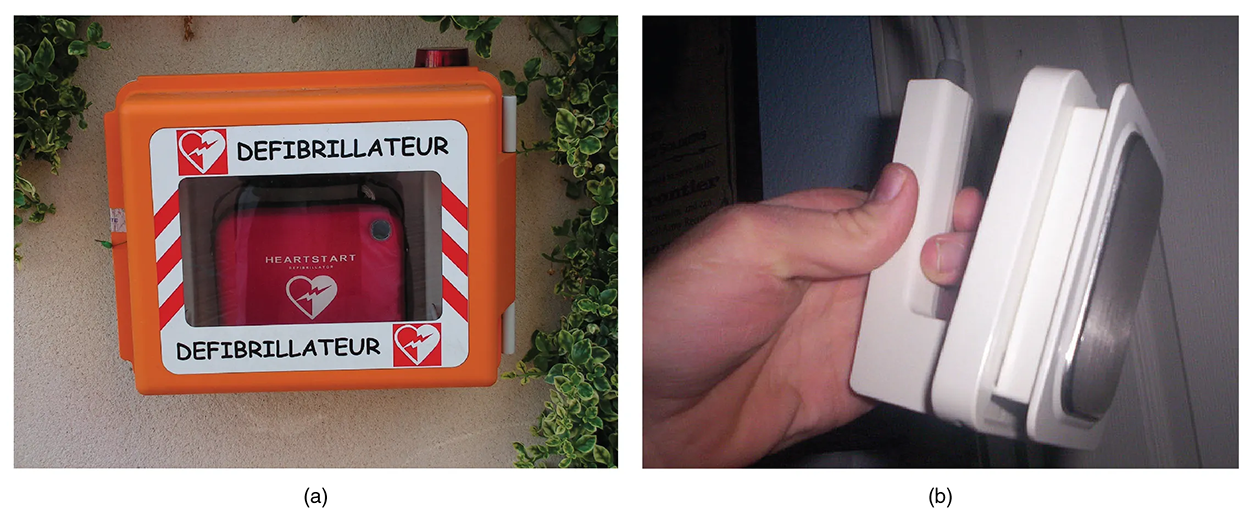
The most common treatment is defibrillation, which uses special paddles, as shown in the image below, to apply a charge to the heart from an external electrical source in an attempt to establish a normal sinus rhythm. A defibrillator effectively stops the heart so that the SA node can trigger a normal conduction cycle. External automated defibrillators (EADs), also called automated external defibrillators (AEDs), are being placed in areas frequented by large numbers of people, such as schools, restaurants, and airports, because of their effectiveness in reestablishing a normal sinus rhythm. These devices contain simple and direct verbal instructions that can be followed by nonmedical personnel in an attempt to save a life.
It’s common to see people's lives being saved on television through combinations of defibrillation and CPR. As you learned above, defibrillation is only useful if a patient has a shockable rhythm. CPR can be lifesaving, and it is a very valuable skill to learn. However, CPR in real life is not as simple as it typically looks on television. It is forceful and can result in injuries like broken ribs.
IN CONTEXT
Advance Directives
For individuals with serious health conditions, especially those who are older and/or frail, there are important factors to consider. Many people would rather spend their final moments in the comfort of their home surrounded by loved ones, instead of experiencing emergency procedures that may be physically traumatic and offer limited benefit, with a low chance of significantly prolonging their lives.
This is a very personal decision, but taking the time to discuss your wishes and those of your loved ones before an emergency happens can provide an opportunity to honor those wishes. These discussions not only empower individuals to make informed decisions about what lifesaving interventions they want and what they feel would be too much, but also give peace of mind to loved ones, knowing that they are honoring that person’s wishes. These conversations can help ensure that personal values and preferences are respected and ease the emotional burden on family members. Advance directives are legal tools that allow people to clearly document their healthcare preferences so their choices can be honored.
Source: THIS TUTORIAL HAS BEEN ADAPTED FROM (1) OPEN RN "MEDICAL TERMINOLOGY 2E". ACCESS FOR FREE AT wtcs.pressbooks.pub/medterm/. (2) Openstax "Anatomy and Physiology 2E". Access for free at OPENSTAX.ORG/DETAILS/BOOKS/ANATOMY-AND-PHYSIOLOGY-2E. LICENSING (1&2): CREATIVE COMMONS ATTRIBUTION 4.0 INTERNATIONAL. Accessed by March 2025.