Table of Contents |
A Venn diagram is a useful tool to visualize conditional probability.
EXAMPLE
What is the probability of getting an even on a roulette wheel? Like the example above, this question is not a conditional probability yet because the question is simply about the probability that the number is even. To find the answer, count up all of the even sectors.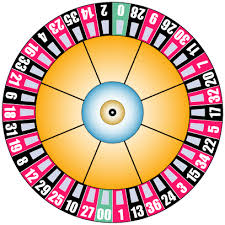

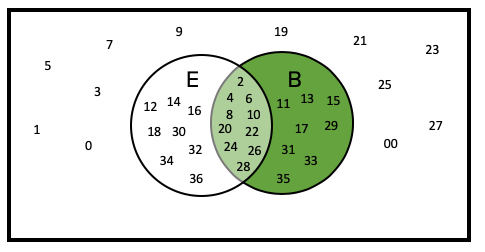

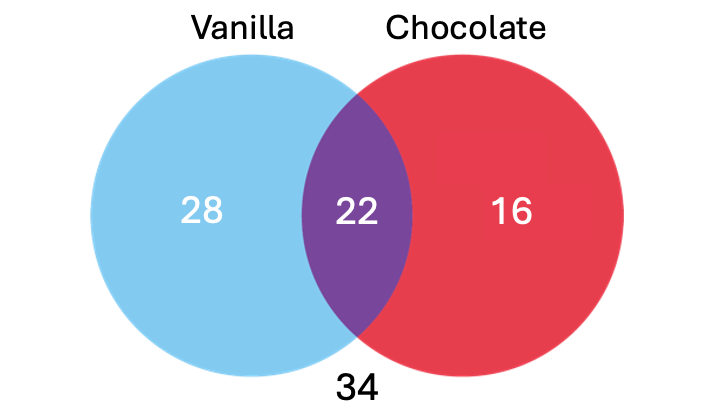
In the example above, we show all the individual members of each group, but usually Venn diagrams summarize this by only indicating the total number of individuals in that group, as in the example below.


Source: THIS TUTORIAL WAS AUTHORED BY JONATHAN OSTERS FOR SOPHIA LEARNING. PLEASE SEE OUR TERMS OF USE.