Use Sophia to knock out your gen-ed requirements quickly and affordably. Learn more
×

Conditional Probabilities

Author: Sophia

what's covered
In this lesson, you will learn about conditional probabilities and how they can be used to answer specific business questions related to probability. Specifically, this lesson will cover:

Table of Contents

1. Conditional Probabilities

Conditional probability is a fundamental concept in statistics and data analytics that helps you understand the likelihood of an event occurring, given that another event has already occurred.

Conditional probability is denoted as straight P open parentheses straight A vertical line straight B close parentheses comma which reads as “the probability of event A occurring, given that event B has occurred.” The formula for conditional probability is:

straight P open parentheses straight A vertical line straight B close parentheses equals fraction numerator straight P open parentheses straight A intersection straight B close parentheses over denominator straight P open parentheses straight B close parentheses end fraction space or space straight P open parentheses straight B vertical line straight A close parentheses equals fraction numerator straight P open parentheses straight B intersection straight A close parentheses over denominator straight P open parentheses straight A close parentheses end fraction

term to know
Conditional Probabilities
The probability of one event occurring, given that another event has occurred.

1a. Marginal and Joint Probabilities

To calculate conditional probabilities, you often need to use marginal and joint probabilities. Marginal probability refers to the probability of a single event occurring, regardless of the outcomes of other events. It is derived from the total probability distribution of all possible events. Consider a retail store analyzing the probability of a customer purchasing electronics. If the store has data on various product categories, the marginal probability of purchasing electronics is calculated by considering only the electronics purchases, regardless of other product categories.

Joint probability refers to the probability of two or more events occurring simultaneously. It considers the intersection of events. In the same retail store, the joint probability might be the probability that a customer purchases both electronics and clothing during a single visit. This helps in understanding the relationship between different product categories and customer behavior.

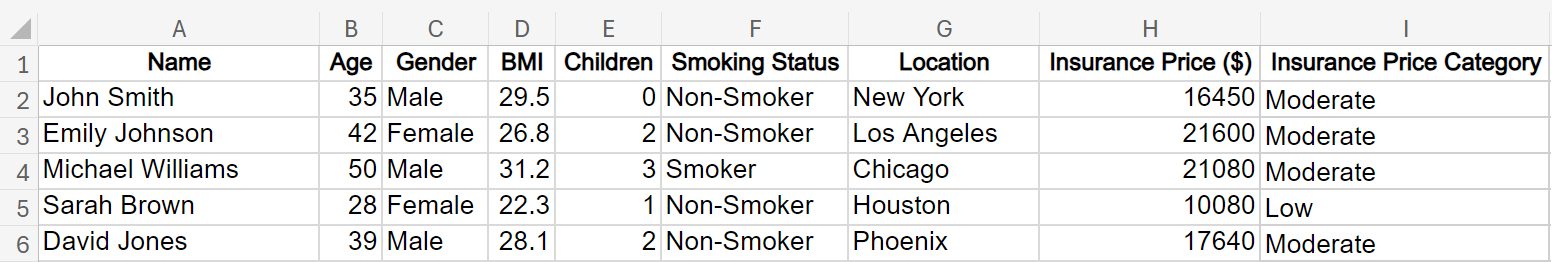
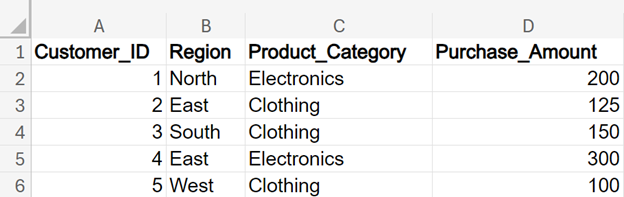
To illustrate these probabilities, consider a healthcare insurance company that wants to analyze risk factors affecting insurance pricing for clients. You are provided with data in a spreadsheet that contains information about individuals, including their age, gender, BMI (Body Mass Index), number of children, smoking status, region, insurance price, and a categorization of insurance price.

The Insurance Price Category column is a categorization of the Insurance Price column. The Insurance Price column shows how much money the customers are paying per year for insurance. If the customer pays less than $15,000 per year, they are considered to pay a low insurance price. If the customer pays more than $15,000 but less than $25,000, the customer is considered to pay a moderate insurance price, and if the customer pays more than $25,0000 per year for health insurance, the customer is considered to pay a high price.

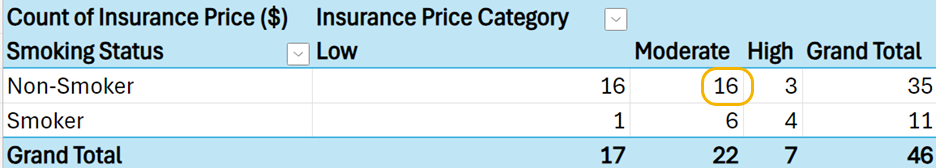
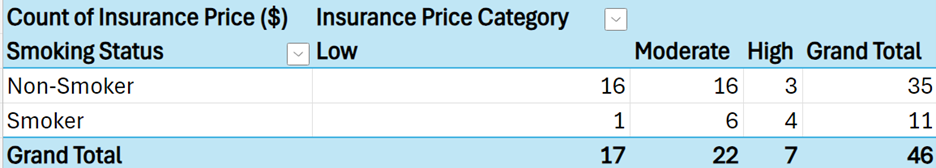
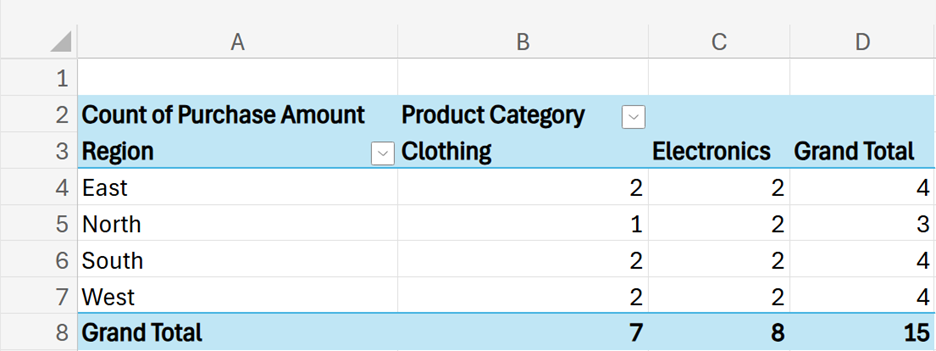
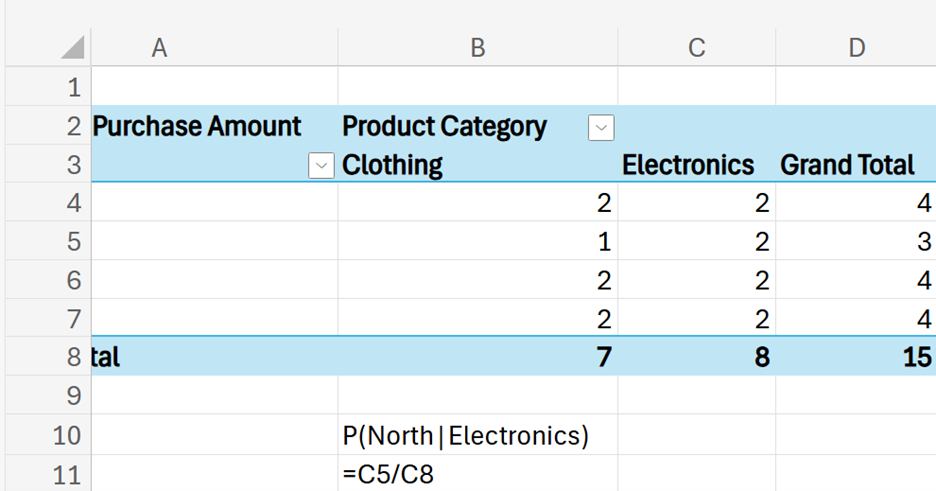
The table below shows a crosstabulation for two events that can be derived using a PivotTable from the healthcare data:

From the table above, we can calculate marginal and joint probabilities. The marginal probability is the likelihood of the event occurring without considering other events. For example, the probability a customer will have low priced insurance is 17 over 46 equals 0.37 equals 37 percent sign comma the probability that a customer will have moderately priced insurance is 22 over 46 equals 0.48 equals 48 percent sign comma and the probability that a customer will have high priced insurance is 7 over 46 equals 0.15 equals 15 percent sign.

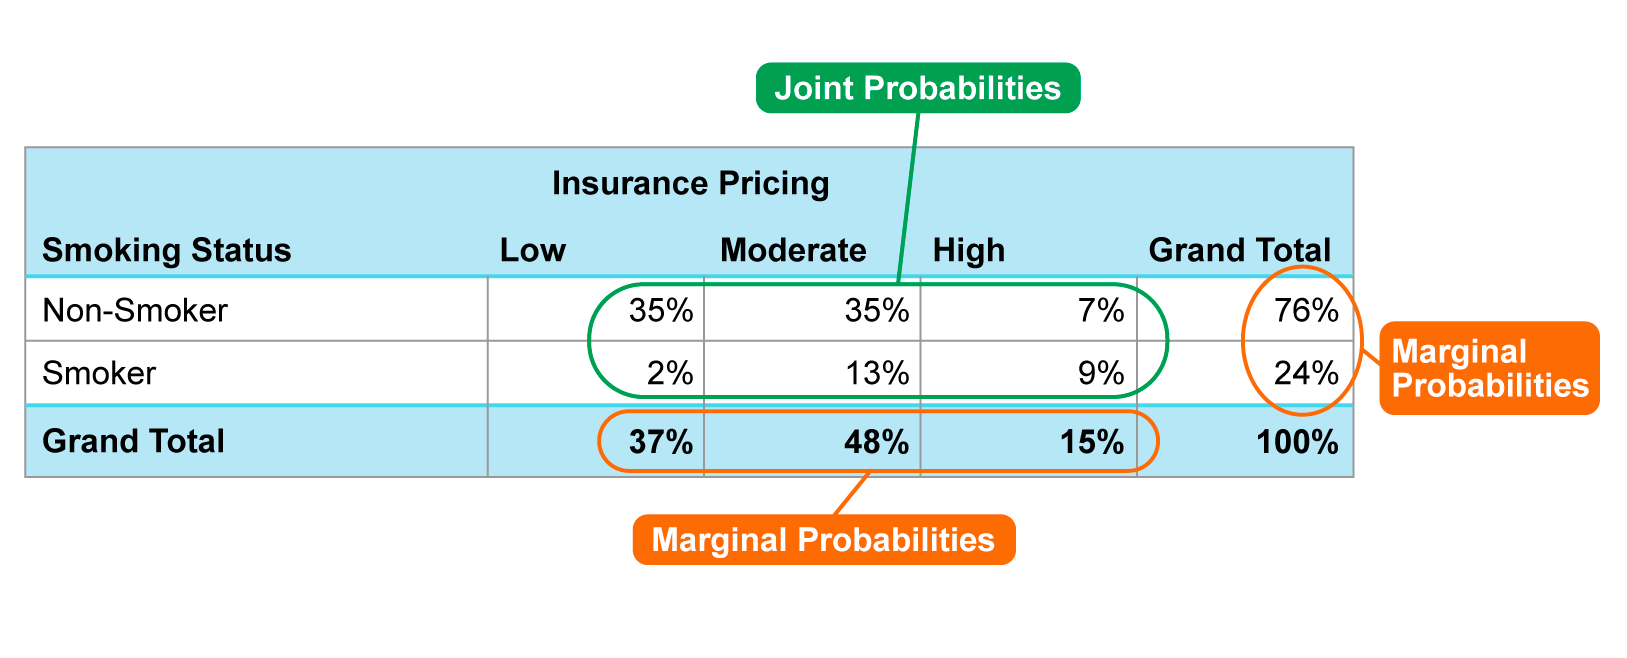
These probabilities are referred to as marginal probabilities because of their location in the margins of the crosstabulation table. But, are these probabilities related to the price category of insurance different for smokers versus non-smokers? Conditional probability allows you to answer this question.

The joint probability provides the probability of the intersection of two events. For example, the probability that a randomly selected customer will be a non-smoker and have moderately priced insurance is 16 over 46 equals 0.35 equals 35 percent sign.

The table below is a joint probability table, which summarizes the probability information of the insurance pricing structure for smokers and non-smokers:

terms to know
Marginal Probabilities
The probability of a single event occurring.
Joint Probabilities
The probability of two or more events occurring simultaneously.

1b. Calculating and Interpreting Conditional Probability

Now that you have the foundation to distinguish between marginal and joint probabilities, you are ready to calculate and interpret conditional probabilities.

EXAMPLE

Imagine you are working as a data analyst for a health insurance company, and they want to analyze risk factors affecting insurance. Your manager has asked you to calculate the probability that a randomly selected customer pays a high insurance price, given they are a non-smoker.


Let event A be the event that an individual pays a high insurance price.

Let event B be the event that an individual is a non-smoker.

You want to find straight P open parentheses straight A vertical line straight B close parentheses.

straight P open parentheses straight A vertical line straight B close parentheses equals fraction numerator straight P open parentheses straight A intersection straight B close parentheses over denominator straight P open parentheses straight B close parentheses end fraction equals fraction numerator begin display style 3 over 46 end style over denominator begin display style 35 over 46 end style end fraction equals 3 over 35 equals 0.086 equals 8.6 percent sign

There is an 8.6% chance that a randomly selected individual will be paying a high insurance price, given they are a non-smoker.

The numerator for the conditional probability is the joint probability of the customer paying a high insurance price and being a non-smoker. The denominator is the marginal probability of the customer being a non-smoker.

Conditional space Probability equals fraction numerator Joint space Probability over denominator Marginal space Probability end fraction

Understanding and interpreting this probability is essential for insurance companies. It helps them assess the impact of smoking status on insurance costs. By knowing the likelihood of non-smokers paying high premiums, insurers can tailor pricing strategies, offer discounts, or adjust risk models accordingly. Additionally, it informs marketing efforts to attract non-smoking customers.

try it
Use the same crosstabulation as provided in the previous example.
Find the probability that a randomly selected customer pays a moderate insurance price, given they are a smoker. Interpret this conditional probability.
Let A be the event that a customer pays a moderate insurance price.

Let B be the event that a customer is a smoker.

You want to find:

straight P open parentheses straight A vertical line straight B close parentheses equals fraction numerator straight P open parentheses straight A intersection straight B close parentheses over denominator straight P open parentheses straight B close parentheses end fraction equals fraction numerator begin display style 6 over 46 end style over denominator begin display style 11 over 46 end style end fraction equals 6 over 11 equals 0.55 equals 55 percent sign

There is a 55% chance that a randomly selected customer will pay a moderate insurance price, given they are a smoker.

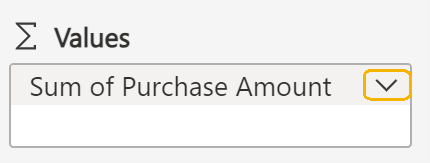
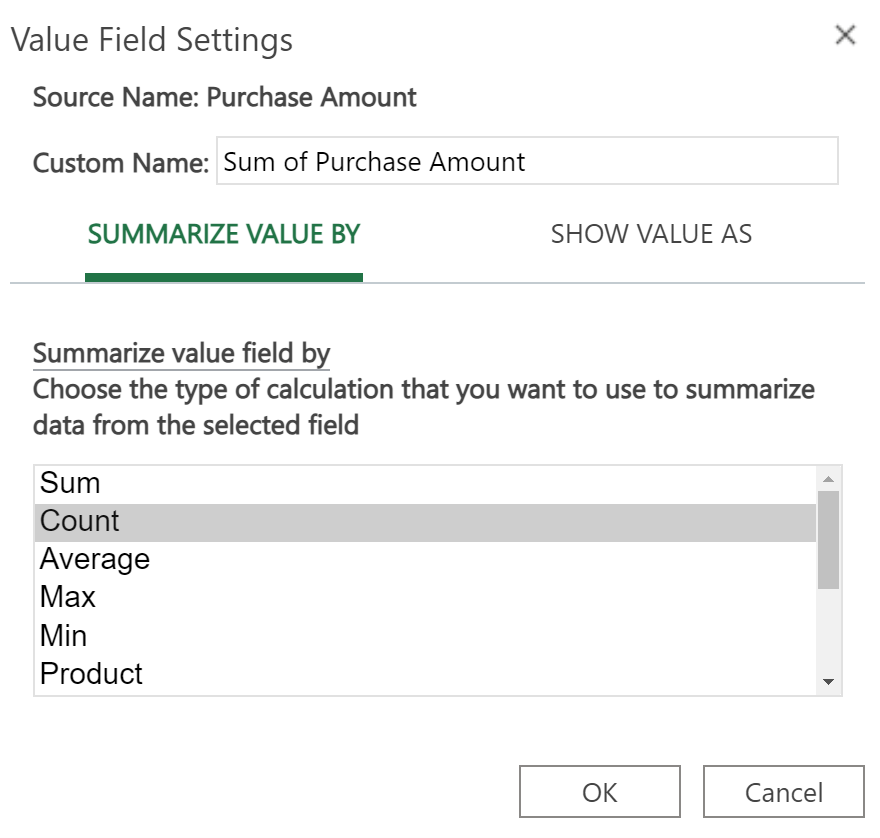
Now that you have become comfortable with the ideas of conditional probability, let’s put it all together! We'll step through the real-world process of being provided data in Excel, creating the PivotTable, and then calculating a conditional probability.

try it
Below is a partial snapshot of data related to customer product purchases by region and products: The data in the Excel file is customer_purchase_products_regions.xlsx.


A description of each column is provided below:

  • CustomerID. Unique identifier for each customer.
  • Region. The region where the purchase was made.
  • Product Category. The type of product the customer purchased.
  • Purchase Amount. Amount of purchase.
Using Excel, find the conditional probability that a purchase is from the North region, given that the product category is Electronics.

Solution: The conditional probability that a purchase is from the North region, given that the product category was Electronics, is 25%.

Perform the following steps in Excel:

1. Create the PivotTable by selecting the entire range of your data (cells A1 to D16). On the Insert menu, select PivotTable --> From Table/Range and select + New Worksheet. Click Ok.

2. Place Region in the Rows box, Product Category in the Columns box, and Purchase Amount in the Σ Values box.

3. You need the values in the cells of the contingency table to represent the counts of each region and product combination. In the drop-down arrow for the Σ Values box, select Value Field Settings, select Count, and OK.


The PivotTable will update to display the counts for each cell.


4. From the PivotTable, you can calculate the conditional probability.

straight P open parentheses North vertical line Electronics close parentheses equals fraction numerator straight P open parentheses North intersection Electronics close parentheses over denominator straight P open parentheses Electronics close parentheses end fraction equals fraction numerator begin display style 2 over 15 end style over denominator begin display style 8 over 15 end style end fraction equals fraction numerator begin display style fraction numerator straight C 5 over denominator straight D 8 end fraction end style over denominator begin display style fraction numerator straight C 8 over denominator straight D 8 end fraction end style end fraction

If you recognize that in conditional probabilities, the denominators for both the numerator and the denominator will cancel out, you can always just divide the numerator of each fraction. For example:

straight P open parentheses North vertical line Electronics close parentheses equals fraction numerator straight P open parentheses North intersection Electronics close parentheses over denominator straight P open parentheses Electronics close parentheses end fraction equals fraction numerator begin display style 2 over 15 end style over denominator begin display style 8 over 15 end style end fraction equals 2 over 8 equals 0.25 equals 25 percent sign

You can perform this calculation in Excel by entering =C5/C8 in the cell that denotes the conditional probability.


2. Evaluating Conditional Probabilities

Now that you know how to calculate conditional probabilities, let’s explore a small case study that illustrates how conditional probabilities can be used to evaluate customer churn in the telecommunications industry.

IN CONTEXT

TelcoConnect is a telecommunications company that provides mobile phone services to its customers. They offer two primary contract types: Postpaid (monthly billing) and Prepaid (pay-as-you-go). TelcoConnect is concerned about customer churn (that is, customers leaving their service), as it impacts revenue and customer satisfaction.

The TelcoConnect analytics team wants to understand the relationship between contract type and churn. Specifically, they aim to answer the following questions:

  • What is the likelihood that a customer churns, given they are Postpaid?
  • What is the likelihood that a customer churns, given they are Prepaid?
  • How does contract type influence churn behavior?
The crosstabulation for a sample of 100 customers is provided below.


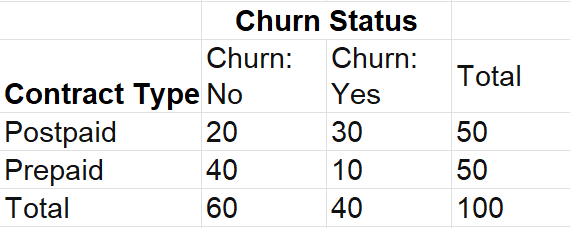
You can use conditional probabilities to address TelcoConnect’s questions. Calculate the probability of churning given Postpaid and Prepaid contracts and compare the probabilities.

straight P open parentheses churn vertical line Postpaid close parentheses equals fraction numerator straight P open parentheses churn intersection Postpaid close parentheses over denominator straight P open parentheses Postpaid close parentheses end fraction equals fraction numerator begin display style 30 over 100 end style over denominator begin display style 50 over 100 end style end fraction equals 30 over 50 equals 0.60 equals 60 percent sign

straight P open parentheses churn vertical line Prepaid close parentheses equals fraction numerator straight P open parentheses churn intersection Prepaid close parentheses over denominator straight P open parentheses Prepaid close parentheses end fraction equals fraction numerator begin display style 10 over 100 end style over denominator begin display style 50 over 100 end style end fraction equals 10 over 50 equals 0.20 equals 20 percent sign

From the conditional probabilities, customers in a postpaid contract plan are more likely to churn than customers in a prepaid plan. TelcoConnect may use this insight to:

  • Tailor retention strategies based on contract type.
  • Offer targeted promotions to customers in a postpaid plan to reduce churn.
It is important to consider that there could be additional factors that might influence churn probability.

summary
In this lesson, you learned about conditional probabilities and their use in answering specific business-related probability questions. You explored concepts like marginal counts, joint probabilities, and how to calculate and interpret conditional probabilities. These tools allowed you to evaluate situations where the probability of one event depends on another. You applied this understanding by analyzing examples, such as how a healthcare insurance company might assess risk factors to determine insurance pricing for clients. Through this, you gained insight into how conditional probabilities are used to make informed business decisions.

Source: THIS TUTORIAL WAS AUTHORED BY SOPHIA LEARNING. PLEASE SEE OUR TERMS OF USE.

Terms to Know
Conditional Probabilities

The probability of one event occurring given that another event has occurred.

Joint Probabilities

The probability of two or more events occurring simultaneously.

Marginal Probabilities

The probability of a single event occurring.