In this lesson, you will learn how to use decision trees for making predictions and understand their role as a machine learning model. Specifically, this lesson will cover:
A decision tree is like a flowchart that helps you make decisions. Imagine it as a tree turned upside down, with the root at the top and branches spreading out below. For example, if you are using a decision to predict the price of a house, the root node might ask, "Is the size of the house greater than 2,000 square feet?" Depending on the answer, the tree will branch out to more questions, such as "Is the number of bedrooms greater than 3?" or "Is the house located in a high-demand area?" This process continues, the question representing a test on a feature, until you reach a terminal decision that provides the predicted price of the house.
1a. Decision Trees as Predictive Models
A decision tree is a type of predictive model. This means it uses data to make predictions about future events or values. For example, if we have data about houses, we can use a decision tree to predict the price of a new house based on its features like size, number of bedrooms, and location.
In this course, you will focus on predicting continuous targets, such as house prices. Continuous targets are values that can take any number within a range, like $250,000.50 or $350,000.68. To do this, you will use a specific type of decision tree called a Classification and Regression Tree (CART). CART is designed to handle both classification (categorical targets) and regression (continuous targets) tasks. Since you are predicting continuous targets, you will be using the regression part of CART.
term to know
Classification and Regression Tree (CART)
A decision tree model used for predicting categorical and continuous targets based on features.
1b. Basic Terminology and Example Decision Tree
To understand how a decision tree works, it is important to become familiar with some basic terminology. Here are the key components of a decision tree:
Root Node: This is the starting point of the tree. It represents the first decision you need to make.
Internal Nodes: These are points where you make more decisions based on different questions or tests.
Branches: These are the lines that connect the nodes. They show the possible answers to each question.
Leaf Nodes: These are the end points of the tree. Each leaf node represents a final decision or outcome.
Let’s examine what a decision tree would look like in Python, using the example of predicting housing prices.
EXAMPLE
Let's walk through a simple example to illustrate how a decision tree can be used to predict house prices. Features will be used to predict the price of the house, such as:
Size – size of the house (in square feet)
Bedrooms – number of bedrooms
Location – numerical value indicates demand (1 = low demand, 2 = medium demand, and 3 = high demand)
The target variable is:
Price – price of the house
The final decision tree that is developed in Python is shown below:
When you look at a decision tree, you will see several boxes connected by lines (branches). Each box represents a decision point or a final prediction. You always start at the root node (node at the top) to follow the branches based on the features' values until you reach a leaf node, which gives the predicted price of the house. Let's explain the key parts of the decision tree:
Understanding the Decision Tree Visual
Root Node:
Decision Criteria (Size <= 3335.5)
This is a question or test that splits the data. For example, "Size <= 3335.5" means the decision tree is asking if the size of the house is less than or equal to 3,335.5 square feet.
If the answer is True (yes), the tree follows the left branch.
If the answer is False (no), the tree follows the right branch.
Samples
This number tells you how many data points (houses, in this case) are being considered at this point in the tree.
For example, the root node states "samples = 1000;" this means there are 1000 houses (observations) being considered at that decision point.
Value
This represents the average value of the target variable (house prices) for the data points in that node.
For example, the root node states "value = 584477.36," which means the average price of the houses in that node is $584,477.36.
Following the Tree
As you move down the tree:
Each internal node (decision point) will ask a new question based on a different feature (for example, number of bedrooms, and location).
The branches show the possible answers (True or False) and lead to the next decision point or a final prediction.
The leaf nodes (endpoints) provide the final predicted value, which in this case is the predicted house price.
Let’s see how well you understand the key components of a decision tree!
try it
Provided below is the same decision tree that was used in the previous example. Presume you are building a tree to predict housing prices using the size of the house, number of bedrooms, and location.
Using the node (box) that is circled in the tree below, identify the following:
Is the node a root, interior, or leaf node?
Describe the decision criterion at this node. What question is being asked?
How many houses (observations) are in this node?
What is the average price of the houses in this node?
The decision tree is asking if the Location value is less than or equal to 1.5. If yes, the tree follows the branch to the left. If no, the tree follows the branch to the right.
42
$659,484.69
How a Decision Tree Works
A decision tree is also known as a data partitioning algorithm. This means it works by dividing the data into smaller and smaller parts. Here’s how the algorithm works:
Start at the Root Node: The algorithm begins at the root node, which represents the entire dataset.
Ask a Question: At each node, the algorithm asks a question based on one of the features. For example, "Is the size of the house greater than 2,000 square feet?"
Split the Data: Based on the answer (True or False), the data is split into two groups. One group goes to the left branch (True), and the other goes to the right branch (False).
Select Features and Values: The algorithm chooses the feature and the specific value to split on by looking for the split that best separates the data. For a continuous target, it tries to find the split that reduces the difference (variance) in the target values the most. For example, it might test different sizes of houses to see which size best splits the data into groups with similar house prices.
Repeat the Process: This process is repeated for each group, asking new questions at each internal node and splitting the data further.
Reach Leaf Nodes: The process continues until it reaches the leaf nodes, which represent the final predictions. Each leaf node gives the predicted value, such as the average house price for that group.
By following this process, the decision tree can make accurate predictions based on the patterns it finds in the data.
terms to know
Root Node
The topmost node in a decision tree that represents the entire dataset and is the starting point for splitting the data.
Internal Node
A node within the decision tree that splits the data into further subsets based on specific conditions.
Branch
A connection between nodes in a decision tree that represents the outcome of a decision made at an internal node.
Leaf Node
The end node of a branch in a decision tree that represents a final decision or classification and does not split further.
1c. Using the Decision Tree to Make Predictions
Once a decision tree is built, it can be used to make predictions. Here’s how the process works:
Input New Data: To make a prediction, you start by inputting the new data into the decision tree. For example, if you want to predict the price of a new house, you would input its features, such as size, number of bedrooms, and location.
Follow the Path: The decision tree will guide the new data through the tree by asking a series of questions at each node. Each question is based on the features of the new data. For example, the tree might first ask, "Is the size of the house greater than 2,000 square feet?"
Branching Out: Depending on the answer (True or False), the data will follow the corresponding branch to the next node. This process continues, with the tree asking new questions at each internal node and the data following the appropriate branches.
Reaching a Leaf Node: Eventually, the data will reach a leaf node. This is where the tree makes its final prediction. The leaf node represents the predicted value, such as the average house price for that group of similar houses.
Output the Prediction: The value at the leaf node is the prediction made by the decision tree. For example, if the leaf node indicates an average house price of $350,000, that is the predicted price for the new house based on its features.
Now, let’s look at an example and see how you can predict with a decision tree in practice.
EXAMPLE
Let's return to the example where a decision tree has been constructed to predict housing prices, using features such as:
Size – size of the house (in square feet)
Bedrooms – number of bedrooms
Location – numerical value indicates demand (1 = low demand, 2 = medium demand, and 3 = high demand)
Let’s say you have a new house with the following features:
Size: 3,330 square feet
Bedrooms: 3
Location: High demand area (3)
To predict the price of this house:
Start at the Root Node: Begin at the top of the tree, which is the root node. This node will have a question based on one of the features.
Follow the Path Based on Size: The root node asks, "Is the size of the house less than or equal to 3,335.5 square feet?" The answer is True (since 3,330 ≤ 3,335.5). Follow the left branch.
Next Question Based on Size: The next node is also based on Size. This node asks, "Is the size of the house less than or equal to 3,270 square feet?” The answer is False (since 3,330 > 3,270). Follow the right branch.
Final Question Based on Bedrooms: The next node is based on the number of bedrooms. This node asks, “Is the number of bedrooms less than or equal to 2.5?” The answer is False (since 3 > 2.5). Follow the right branch.
Reach the Leaf Node: With the previous step you took, this should land you in the following leaf node that is highlighted in orange in the tree below. The leaf node provides the predicted price of the house. That is, a house that is 3,330 square feet, has three bedrooms, and is in a high demand location, the predicted price will be $445,488.23.
In this section, you will apply a decision tree to predict a target variable using machine learning techniques. Decision trees are powerful tools due to their simplicity and interpretability, making them ideal for visualizing and understanding the prediction process.
2a. Applying a Decision Tree as a Machine Learning Model
Let’s now explore how you can use a decision tree as a predictive model in a machine learning context.
EXAMPLE
You are going to return to the same example scenario that you worked with in the previous tutorial.
You are a data analyst at TechPulse Dynamics. The tech company is planning to launch a new wearable fitness tracker. The company wants to predict the success of this product launch based on historical data from previous product launches.
Marketing_Spend: The amount of money spent on marketing the product.
Social_Media_Mentions: The number of times the product was mentioned on social media.
Pre_Orders: The number of pre-orders received before the launch.
Customer_Reviews: The number of customer reviews received within the first month.
Average_Rating: The average customer rating for the product (1 to 5).
Target Variable:
Success_Score: A numerical score from 1 to 100, where higher numbers represent a more successful product launch (higher numbers correspond to higher revenue).
Additional Variable:
Product_ID: A unique identifier for each product.
Your goal is to build a decision tree model that can generalize well to new data. This means the model should not only perform well on the historical data, but also make accurate predictions for future product launches.
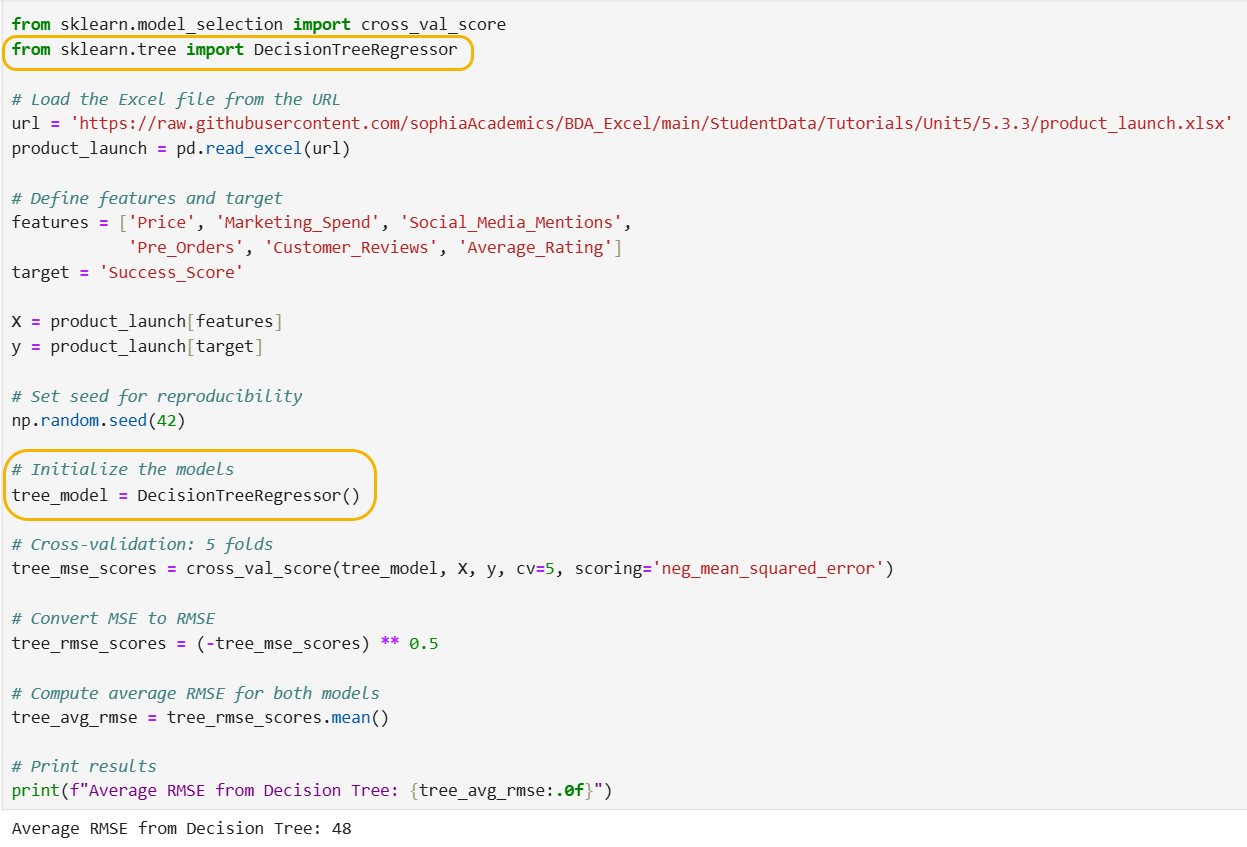
The code below imports pandas, imports an Excel file from a URL, creates a pandas DataFrame named product_launch, builds a decision tree using k-fold cross validation, and evaluates the model using RMSE to measure prediction accuracy.
The code below is identical to the code you ran in the last tutorial when you built a regression model in this same manner, except for the code that is highlighted in orange.
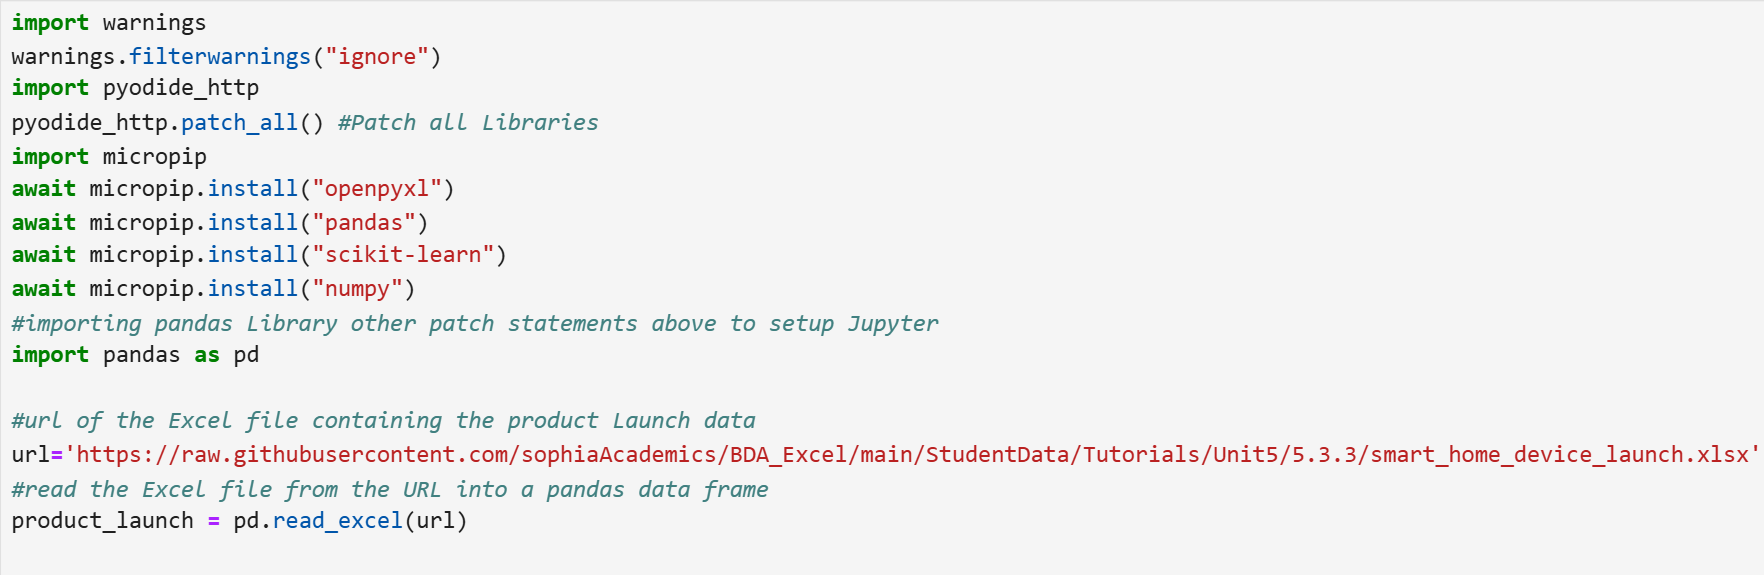
It is important to note that the code that sets up the environment by importing pyodide_http for internet requests, installing essential packages (openpyxl, pandas, numpy, scikit-learn) using micropip, and importing the pandas library for data manipulation is missing from the screenshot below, but is required before you run the code shown in the screenshot.
The key differences between the decision tree and the multiple linear regression code are provided below.
1. Model Import
Decision Tree: from sklearn.tree import DecisionTreeRegressor
Linear Regression: from sklearn.linear_model import LinearRegression
For the decision tree, you import DecisionTreeRegressor from sklearn.tree. For linear regression, you import LinearRegression from sklearn.linear_model.
2. Model Initialization
Decision Tree: model = DecisionTreeRegressor()
Linear Regression: model = LinearRegression()
The main difference here is the type of model being used. The decision tree uses DecisionTreeRegressor, while the linear regression uses LinearRegression.
Interpretation of RMSE in Context
The RMSE value of 48 success score points indicates the average deviation of the predicted success scores from the actual success scores. This means that, on average, the model's predictions are off by 48 points.
2b. Comparing Two Machine Learning Models
Comparing the multiple linear regression model and the decision tree model for TechPulse using their average RMSE values is an important step in determining which model performs better for your specific prediction task. Here’s how and why you would want to compare these models:
Evaluate RMSE Values:
Root Mean Squared Error (RMSE) is a measure of the average magnitude of the errors between the predicted and actual values. Lower RMSE values indicate better model performance.
Compare the average RMSE values of both models. The model with the lower RMSE is generally considered to have better predictive accuracy.
The table below provides the average RMSE values for both models.
Machine Learning Model
Average RMSE Based on 5-Fold Cross-Validation
Multiple Linear Regression
31 points
Decision Tree (CART)
48 points
After evaluating both the multiple linear regression model and the decision tree model using 5-fold cross-validation, it is observed that the multiple linear regression model has an average RMSE of 31 points, while the decision tree model has an average RMSE of 48 points.
This indicates that the multiple linear regression model provides more accurate predictions with lower error compared to the decision tree model for this particular data set. Therefore, you should recommend using the multiple linear regression model for predicting the target variable, as it demonstrates better performance in this scenario.
Why Compare Multiple Models?
In machine learning, the performance of models is highly data-dependent. This means that the effectiveness of a model can vary significantly based on the specific characteristics of the data set being used. Therefore, it is essential to build and compare multiple models to determine which one works best for your particular prediction task.
Here are some key reasons why comparing multiple models is important:
Data Dependency: Different models may perform better or worse depending on the nature of the data. For example, linear models might work well with data that has a linear relationship, while non-linear models like decision trees might be better for capturing complex patterns.
Model Evaluation: By comparing the performance of multiple models, you can identify which model provides the most accurate predictions. This process involves evaluating metrics such as RMSE, which helps in quantifying the prediction errors.
Informed Decision-Making: Building and comparing multiple models allows you to make an informed decision about which model to use. This ensures that you are not relying on a single model that might not be the best fit for your data.
In summary, the exercise of building and comparing multiple machine learning models is crucial because it helps you identify the most suitable model for your data. This approach ensures that you achieve the best possible predictive performance for your specific task.
try it
You are going to return to the same example scenario that you worked with in the previous tutorial.
You are a data analyst at GreenTech Innovations. The company is planning to launch a new smart home device and wants to predict its revenue based on historical data from previous product launches. You have been tasked with building a multiple linear regression to predict revenue for the new smart home device. You have access to 100 observations, each containing various features as described below. Your task is to use this data to create a model that accurately predicts the revenue for future product launches.
Development_Cost: The cost of developing the device.
Marketing_Budget: The amount of money spent on marketing the device.
Social_Media_Ads: The number of social media ads run for the device.
Beta_Testers: The number of beta testers who tried the device before launch.
Customer_Reviews: The number of customer reviews received within the first month.
Average_Rating: The average customer rating for the device (1 to 5).
Target Variable:
Revenue: The total revenue generated by the device within the first six months of launch (in dollars).
Additional Variable:
Device_ID: A unique identifier for each device.
Perform the following.
Import the Excel file and create a pandas DataFrame named home_device.
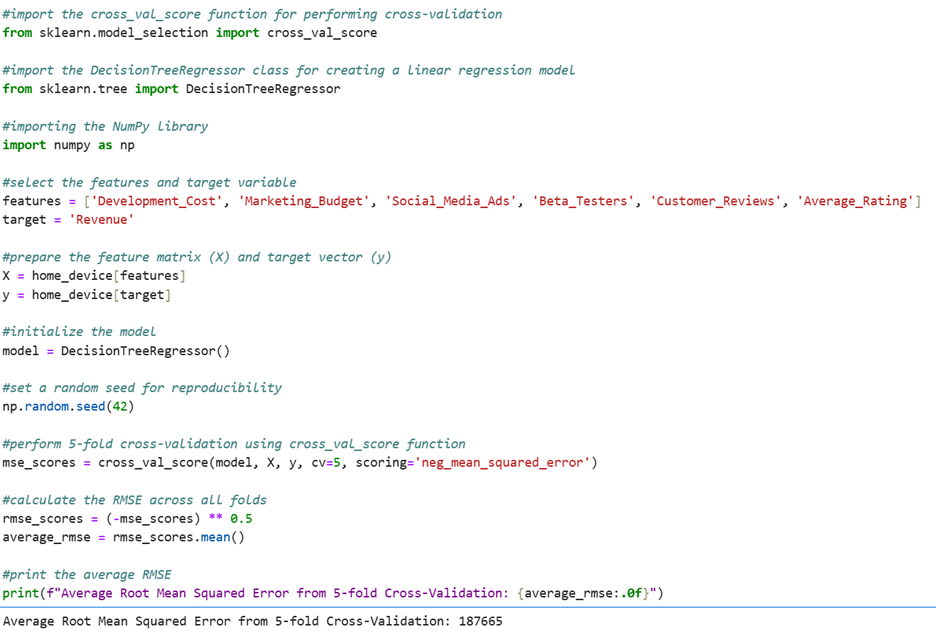
Build a decision tree model in Python to predict revenue using 5-fold cross-validation and use RMSE to assess the model performance.
Find the average RMSE for the decision tree.
The average RMSE for the multiple regression model from the last tutorial was $131,147. Using average RMSE, which of the two models (multiple linear regression or decision tree) would you recommend management should deploy to predict revenues for new devices the company may develop in the future?
Solution:
1. The code below will create a pandas DataFrame named home_device.
2. The code below builds a decision tree model with Revenue as the target variable using 5-fold cross-validation and RMSE as the model assessment measure.
3. The average RMSE value from the code from #2 is $187,665.
4. Based on the average RMSE values, the multiple linear regression model would be recommended for deployment to predict revenues for new devices the company may develop in the future. The multiple linear regression model has an average RMSE of $131,147, which is significantly lower than the RMSE of $187,665 for the decision tree model. A lower RMSE indicates that the multiple linear regression model provides more accurate predictions with less error, making it a better choice for predicting revenues.
watch
Check out this video on creating a decision tree that accurately predicts the revenue for future product launches.
Comparing different types of machine learning models, like multiple regression and decision trees, is important because each model has its strengths and weaknesses. Multiple regression might not always be the best choice, especially if the data has complex patterns that a decision tree can capture better. By comparing models, it is possible to find the one that makes the most accurate predictions for the specific problem at hand. This helps in making better decisions and improving the overall performance of the predictions.
summary
In this lesson, you learned how to use decision trees for making predictions and their role as a machine learning model. The tutorial covered the basics of decision trees, including their structure and terminology, and demonstrated how to build and interpret a decision tree using Python. You explored how decision trees function as data partitioning algorithms and how they can be applied to predict continuous targets, such as house prices. By comparing decision trees with multiple linear regression models, you gained insights into evaluating model performance using metrics like RMSE.
Source: THIS TUTORIAL WAS AUTHORED BY SOPHIA LEARNING. PLEASE SEE OUR TERMS OF USE.
Terms to Know
Branch
A connection between nodes in a decision tree that represents the outcome of a decision made at an internal node.
Classification and Regression Tree (CART)
A decision tree model used for predicting categorical and continuous targets based on features.
Internal Node
A node within the decision tree that splits the data into further subsets based on specific conditions.
Leaf Node
The end node of a branch in a decision tree that represents a final decision or classification and does not split further.
Root Node
The topmost node in a decision tree that represents the entire dataset and is the starting point for splitting the data.