Table of Contents |
As mentioned in the introduction, the circular flow diagram is a model that provides a “big picture” of how the economy functions overall. It shows the interactions among consumers or households, firms, the government, and the rest of the world.
Keep in mind that no model can show us every single interaction, so it is a simplified model.
Here are the two markets shown in the circular flow diagram:
EXAMPLE
To understand this, suppose you go grocery shopping. You physically take goods home with you after going grocery shopping. Or suppose you get your hair cut. Even though you are not bringing a new good home with you, you are still purchasing a service.The input market is where we exchange the factors of production, which are land, labor, and capital. These factors of production are the “inputs” in the input market, as well as resources, and they influence how outputs are produced.
EXAMPLE
You are likely to be involved in the input market with your labor. In order to afford to purchase anything, chances are you have to go to work to afford those things.The diagram shows two different kinds of flows:
Here is a simplified model where the arrows show the circular flow.
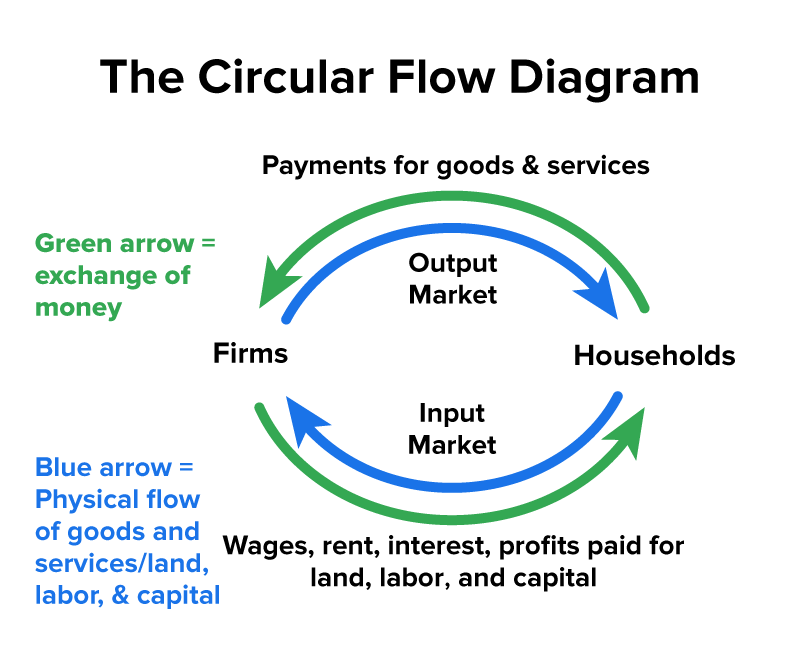
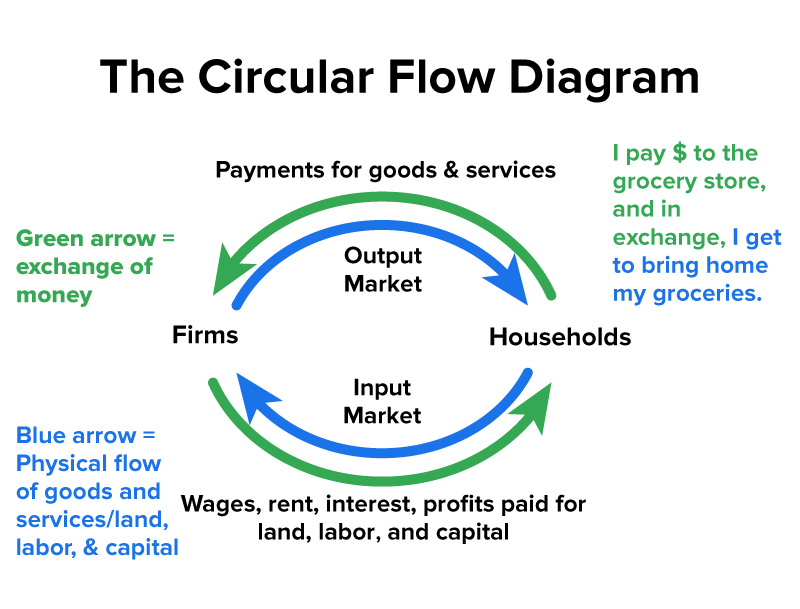
Now, the output market is at the top of the diagram. Notice that the blue arrow represents those goods or services coming home with you, such as the groceries coming home with you from the grocery store.
However, you did not steal them; you paid money to the grocery store in return for them. Therefore, you give money and, in exchange, the business provides you with goods or services.
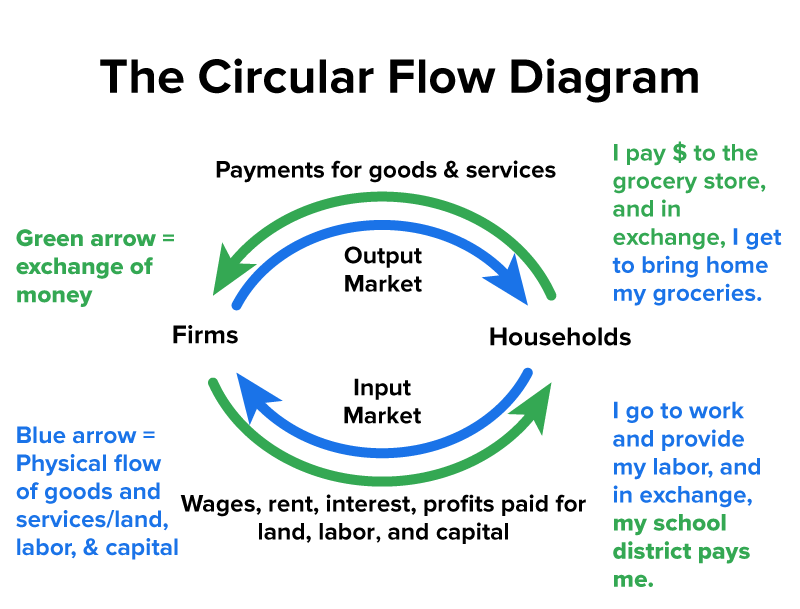
The input market is shown at the bottom of the diagram. Note that the green arrow, the monetary flow, represents the wages, rent, interest, and profits paid for land, labor, and capital.
So, for instance, you drive to work and provide your labor to your employer, and in return, your employer pays you.
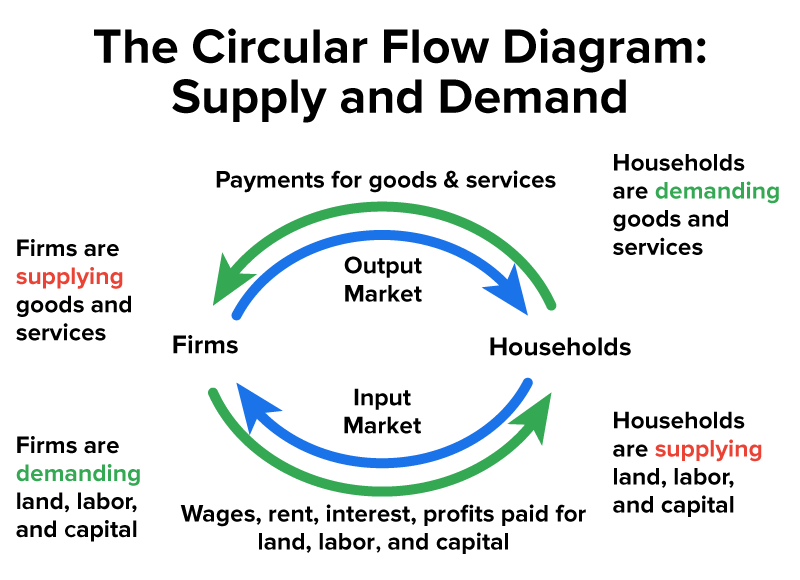
Speaking of different roles, here is another way to view the circular flow diagram.
At the top, households, as demanders, demand goods and services, and the firms supply them to the households. Consumers pay money, and they bring those goods and services home with them.
At the bottom, however, households and firms have different roles. The firms are the ones to demand land, labor, and capital from households. Without this land, labor, and capital, the firms cannot produce or supply anything to consumers in the output market. So, households supply land, labor, and capital in the input market.
Now, let’s add the government. Notice that the government has been added in the middle because the government interacts with both firms and households.
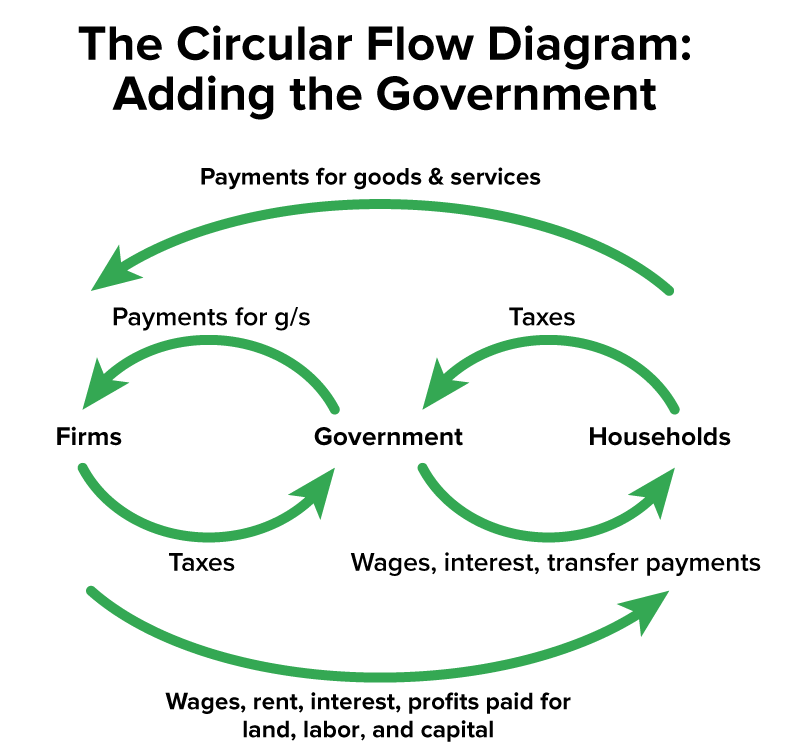
First of all, on the business side of things, the government collects taxes from firms, which is why the arrows show the firms paying taxes to the government.
However, the government also interacts in the output market with firms by paying for certain goods and services.
EXAMPLE
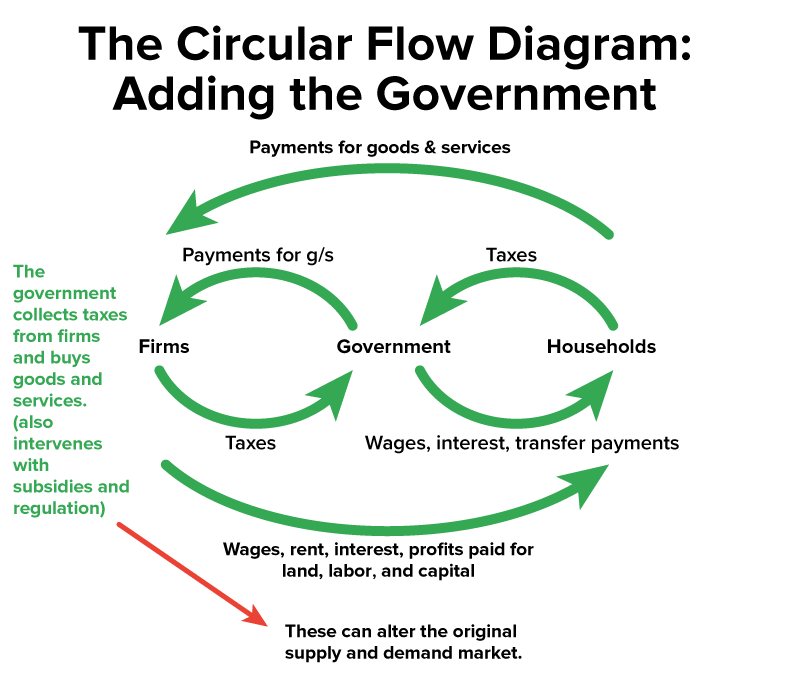
If the government contracts with a business that produces military goods for them, it will pay money to that business for those goods or services.Now, where the firms pay taxes, the government also intervenes sometimes with things like subsidies or business regulations. It is important to note that these types of interventions can alter the original supply and demand market between firms and the government.
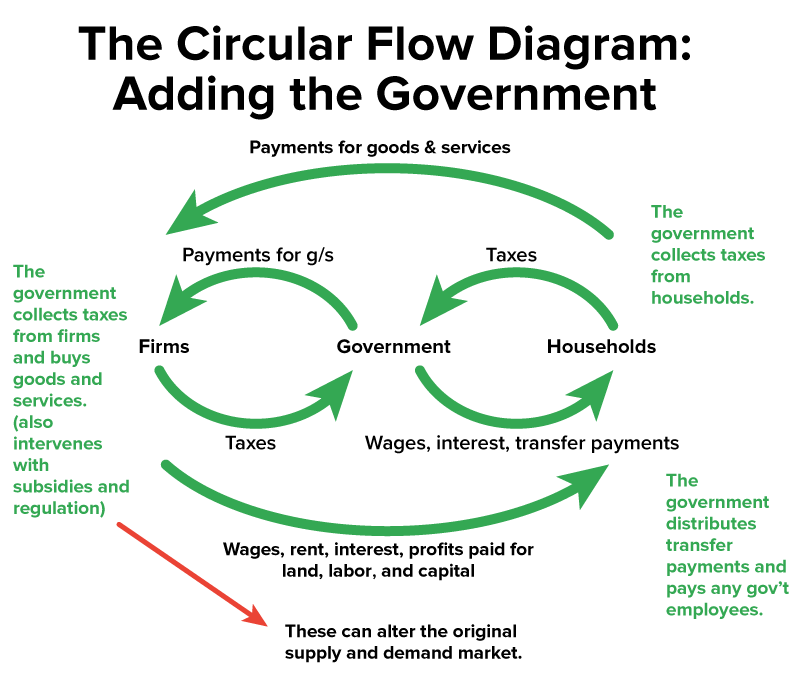
On the household side, the government collects taxes from us, the consumers. You can see the flow of money from households to the government.
However, the government also pays households in different ways. There are transfer payments that go from the government to households in the form of, for instance, any type of welfare payments.
The government also pays households if those households contain any government employees. Many people in our country work in some government capacity, in which case, money flows from the government to households in the form of wages.
Finally, let’s add the rest of the world, placed at the top of the diagram below.
There are two ways that we interact with the rest of the world:
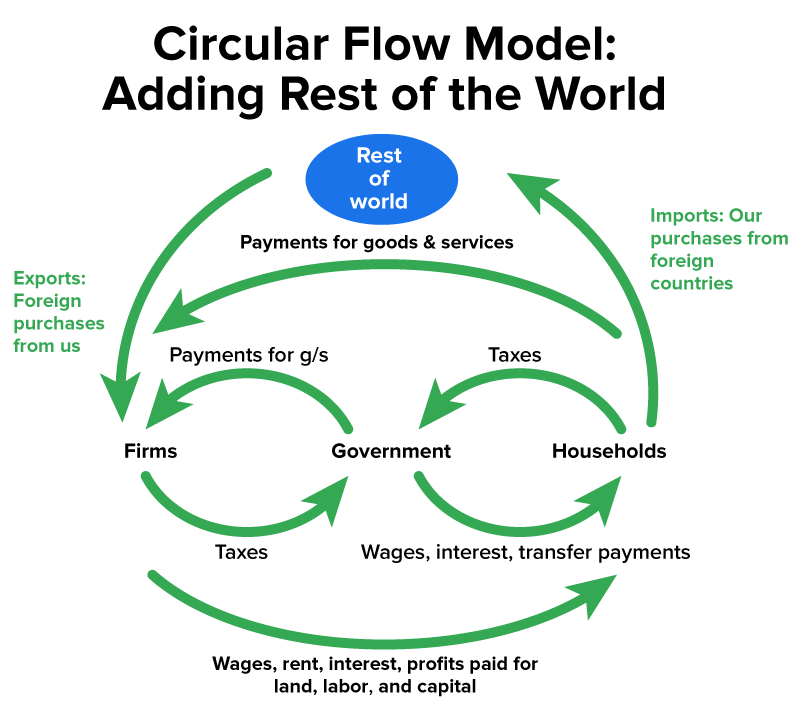
The first way, the right-hand side of the diagram, involves paying the rest of the world for imports.
EXAMPLE
Suppose we, the United States, buy cars from Germany. We would have to pay Germany for those cars that were imported.The left-hand side of the diagram shows the rest of the world paying U.S. firms for exports.
EXAMPLE
When foreigners purchase grain from U.S. farmers, this flow of exports is represented by the arrow.First, let's define some terms.
Gross domestic product, abbreviated GDP, is a major economic key indicator. It is a monetary valuation of all final goods and services of an economy—that is, the total production in a country within a year.
Real gross domestic product, abbreviated RGDP, adjusts for inflation when measuring the monetary valuation of an economy.
Nominal gross domestic product, also abbreviated GDP, measures the total goods and services in an economy based on the current market price.
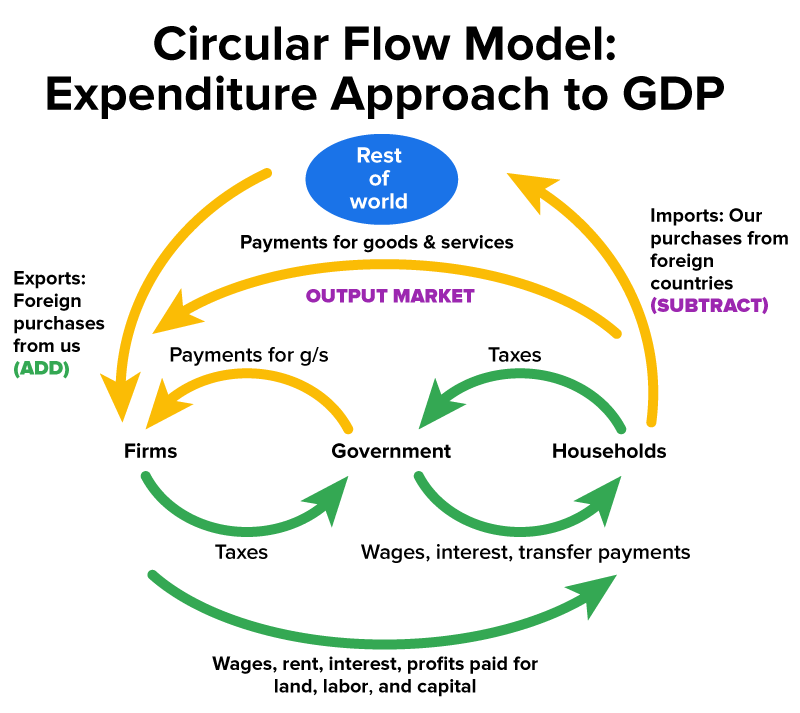
For now, we'll discuss calculating GDP. There are two different approaches to calculating the GDP: income and expenditure. This will be the subject of a future lesson, but for today’s purposes, it is helpful to see these approaches on our circular flow diagram.
One way of measuring how productive our country is would be to add up all of the things that we spend money on, represented by the output market in the diagram. Note that all of the output market arrows are highlighted in yellow so that you can see the way we would calculate GDP using the expenditure approach.
Now, one of the things that we would have to do is add the exports that foreigners purchase from us. Conversely, we would have to subtract all of the things we purchase from other countries because those things would not represent productivity from the U.S. standpoint.
Another way of calculating our GDP would be to use the resource cost/income approach, factoring in all of the income that people provide. This is accomplished by adding up all of the interactions in the input market—the wages, rent, interest, and profits paid for land, labor, and capital.
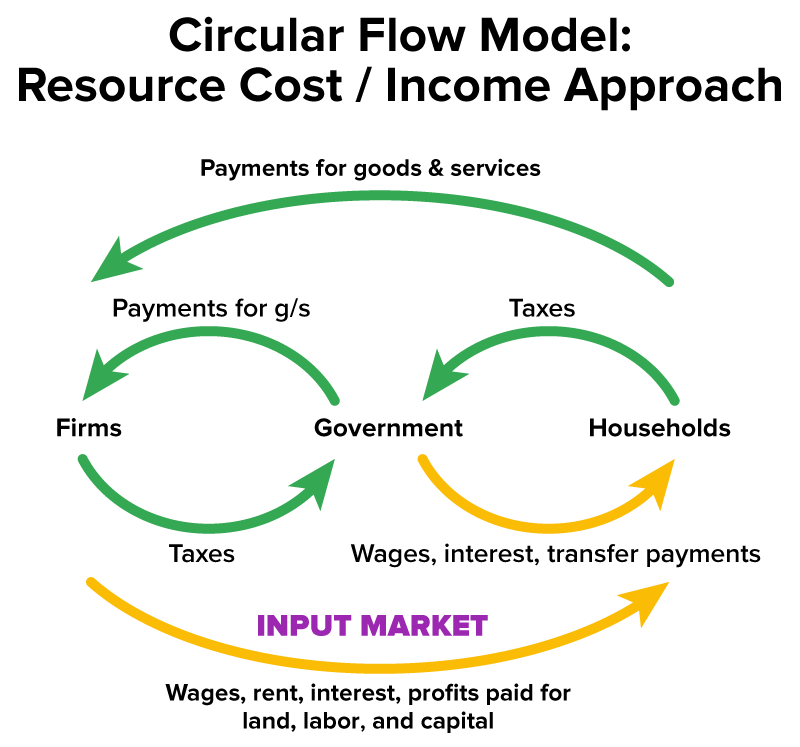
Believe it or not, these two different approaches, although vastly different, should arrive at the same number. This is because, if you think about it, every time you spend money somewhere up in the output market, it becomes a part of somebody else’s income down in the input market.
Source: THIS TUTORIAL WAS AUTHORED BY KATE ESKRA FOR SOPHIA LEARNING. PLEASE SEE OUR TERMS OF USE.