Table of Contents |
Ratio analysis involves calculating and interpreting financial ratios using data taken from the firm’s financial statements in order to assess its condition and performance. A financial ratio states the relationship between financial data on a percentage basis. The ratios can then be compared over time, typically 3 to 5 years. A firm’s ratios can also be compared to industry averages or to those of another company in the same industry. Period-to-period and industry ratios provide a meaningful basis for comparison so that we can answer questions such as:
“Is this particular ratio good or bad?”
Ratios are also important to a firm’s present and prospective creditors (lenders) who want to see if the firm can repay what it borrows and assess the firm’s financial health. Often, loan agreements require firms to maintain minimum levels of specific ratios. Both present and prospective shareholders use ratio analysis to look at the company’s historical performance and trends over time.
It’s important to remember that ratio analysis is based on historical data and may not indicate future financial performance.
However, ratios can help managers monitor the firm’s performance from period to period to understand operations better and identify trouble spots.
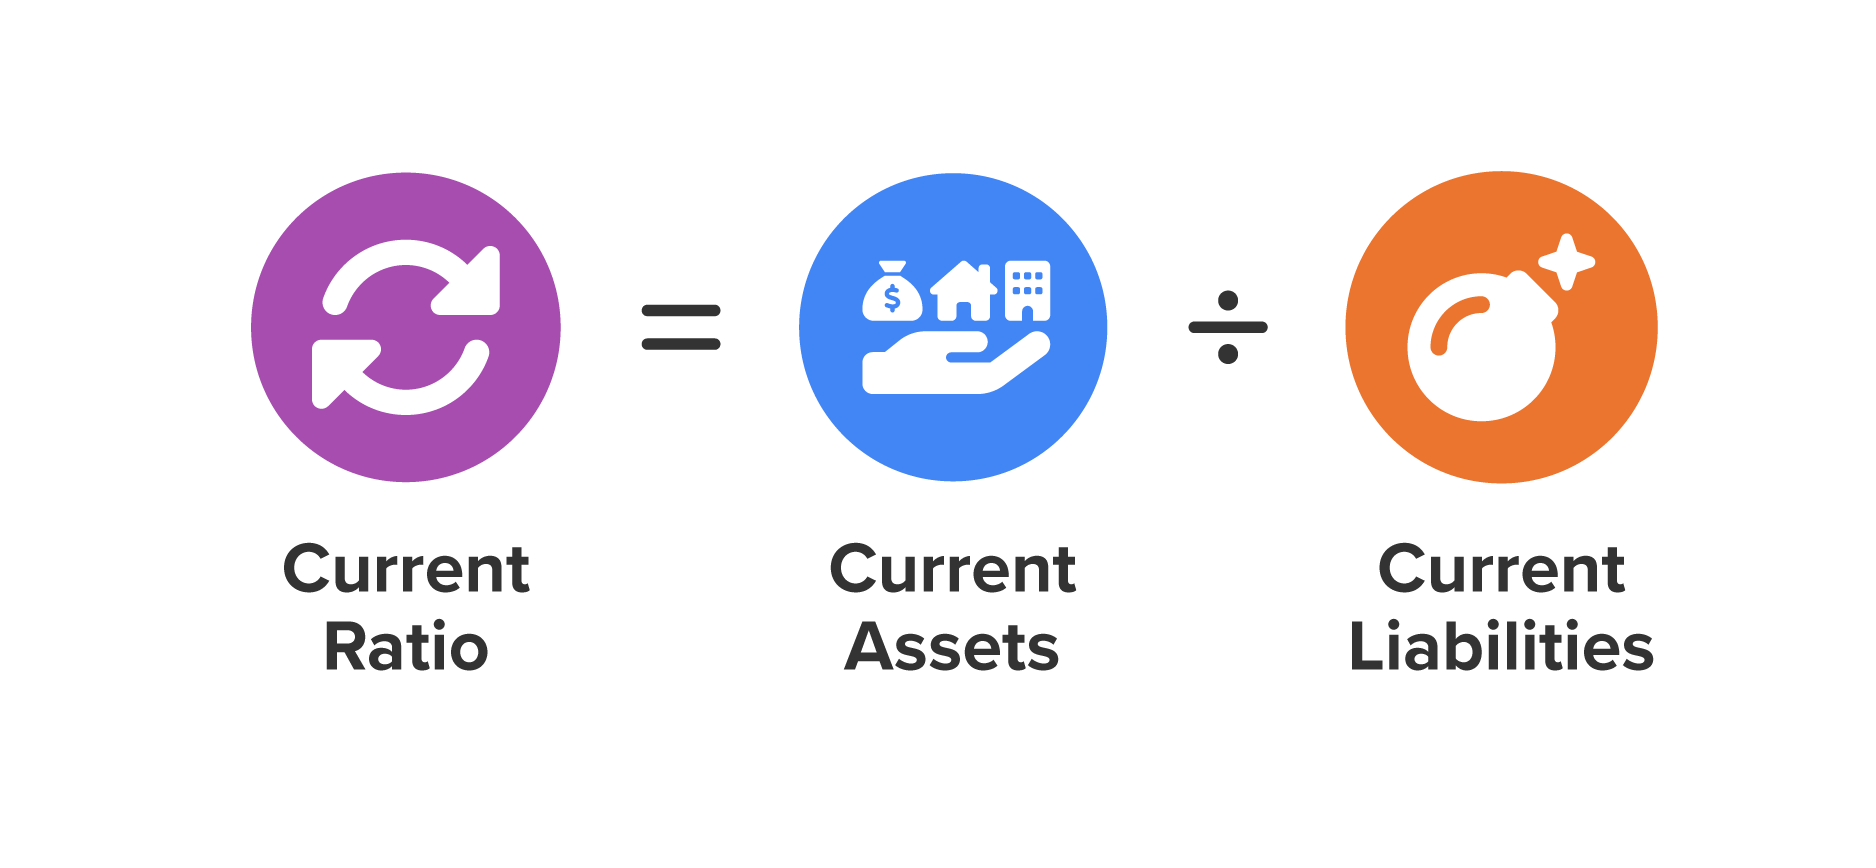
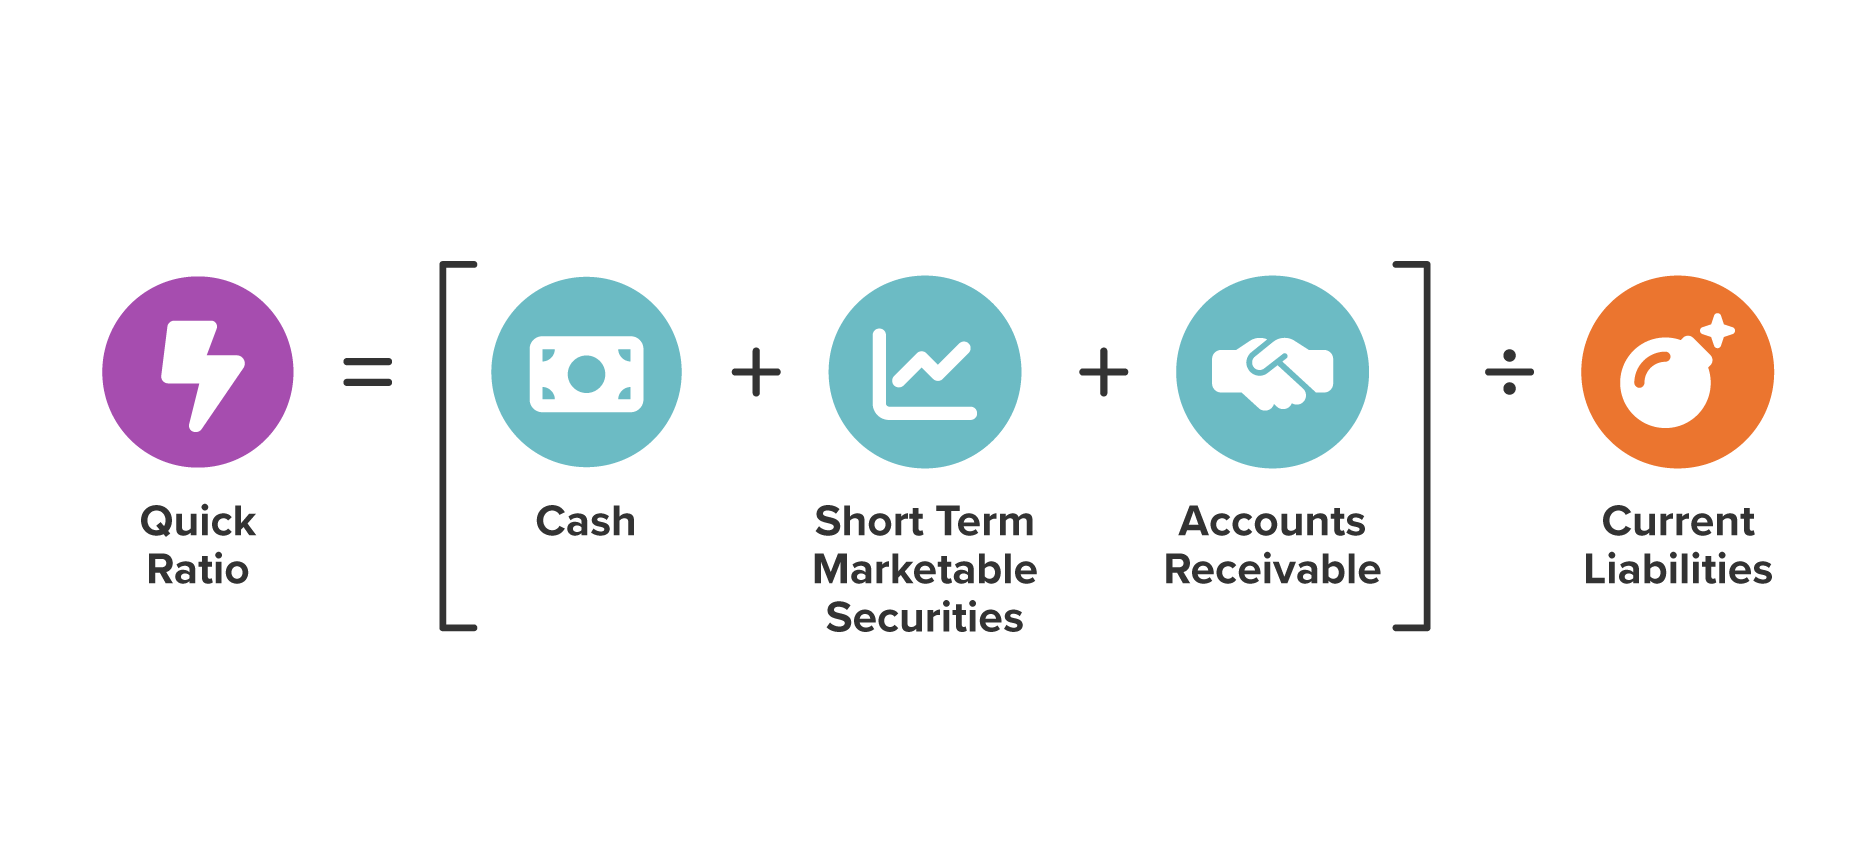
Liquidity ratios measure the firm’s ability to pay its short-term debts as they come due. These ratios are of special interest to the firm’s creditors. The three main measures of liquidity are:
The acid-test (quick) ratio is like the current ratio except that it excludes inventory, which is the least liquid current asset. The acid-test ratio is used to measure the firm’s ability to pay its current liabilities without selling inventory. The name “acid-test” implies that this ratio is a crucial test of the firm’s liquidity. An acid-test ratio of at least 1 is preferred, but again, what is an acceptable value varies by industry. The acid-test ratio is a good measure of liquidity when inventory cannot easily be converted to cash (for instance, if it consists of very specialized goods with a limited market). If inventory is liquid, the current ratio is better.
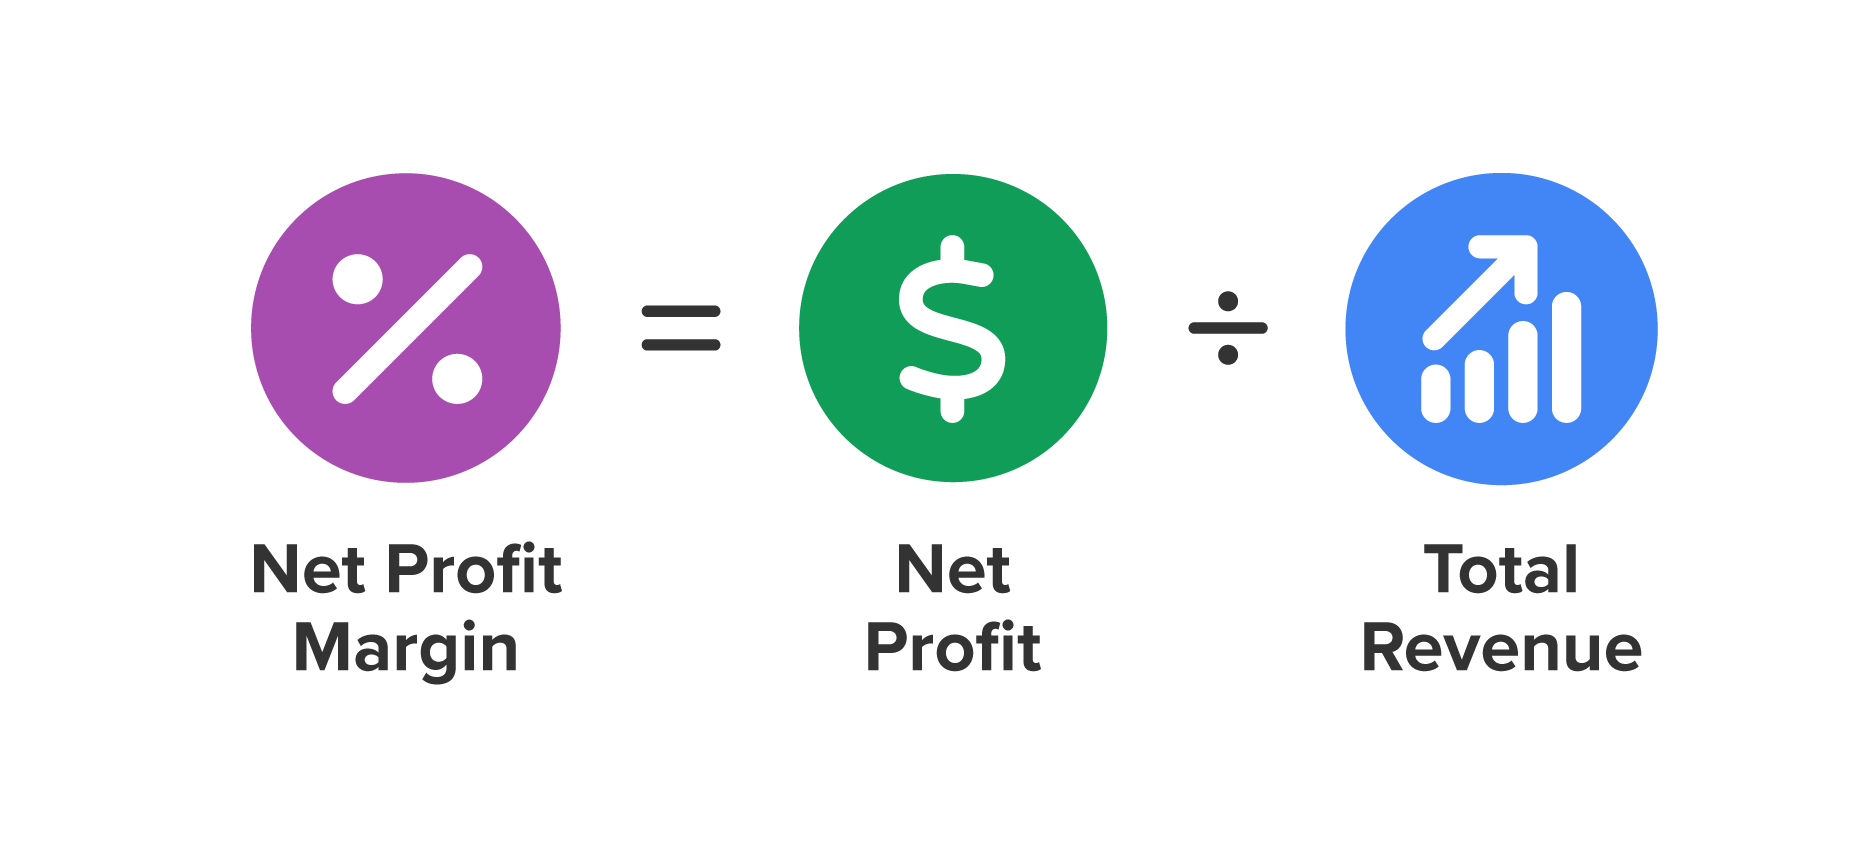
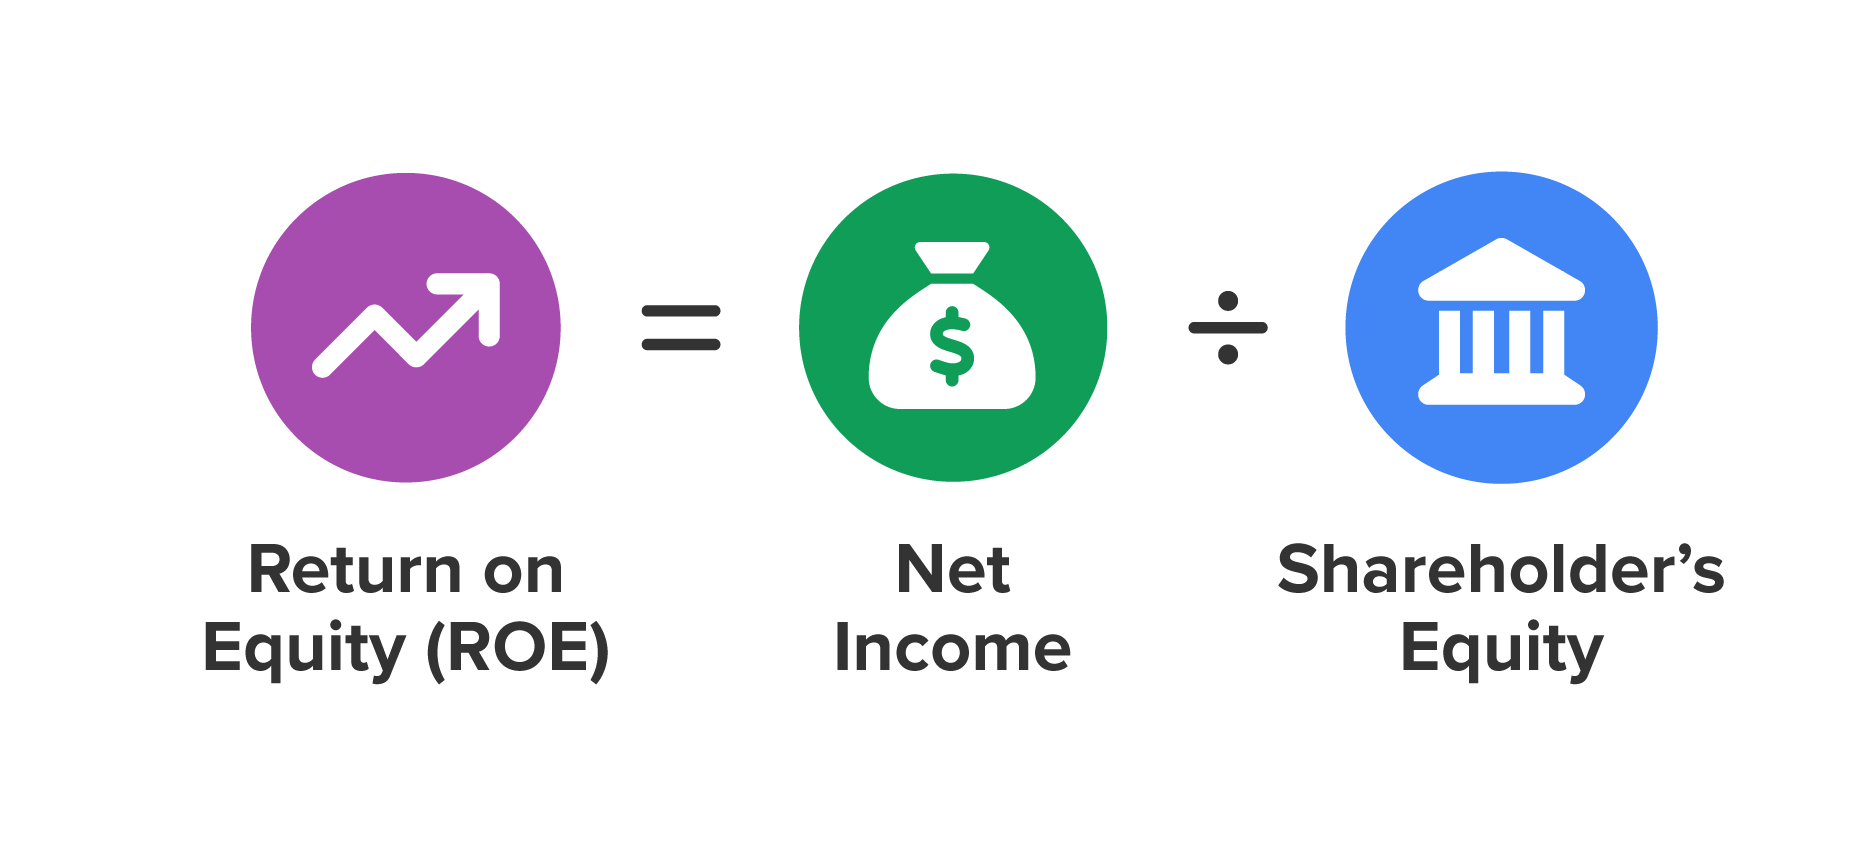
To measure profitability, a firm’s profits can be related to its sales, equity, or stock value. Profitability ratios measure how well the firm is using its resources to generate profit and how efficiently it is being managed. The main profitability ratios are net profit margin, return on equity, and earnings per share.
The ratio of net profit to net sales is the net profit margin, also called return on sales. It measures the percentage of each sales dollar remaining after all expenses, including taxes, have been deducted. Higher net profit margins are better than lower ones. The net profit margin is often used to measure the firm’s earning power. “Good” net profit margins differ quite a bit from industry to industry.
The ratio of net profit to total owners’ equity is called return on equity (ROE). It measures the return that owners receive on their investment in the firm, a major reason for investing in a company’s stock. A firm’s ROE can also be compared to past values to see how it is performing over time.
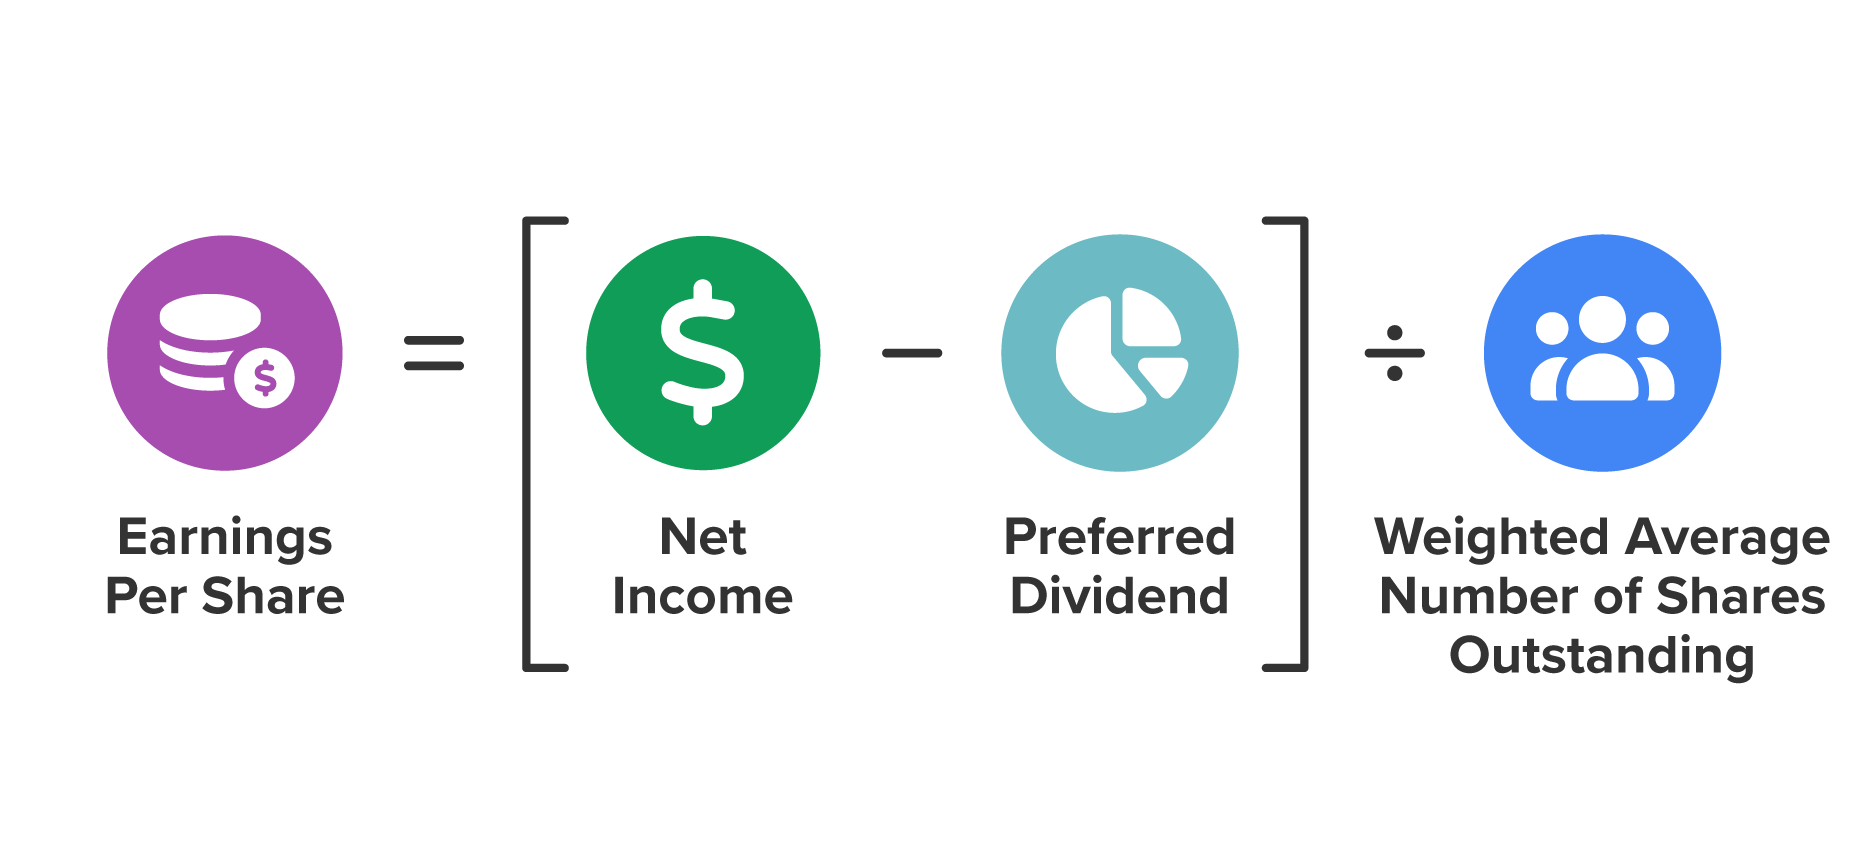
Earnings per share (EPS) is the ratio of net profit to the number of shares of common stock outstanding. It measures the number of dollars earned by each share of stock. EPS values are closely watched by investors and are considered an important sign of success. EPS also indicates a firm’s ability to pay dividends. Note that EPS is the dollar amount earned by each share, not the actual amount given to stockholders in the form of dividends. Some earnings may be put back into the firm.
Debt ratios measure the degree and effect of the firm’s use of borrowed funds (debt) to finance its operations. These ratios are especially important to lenders and investors. They want to make sure the firm has a healthy mix of debt and equity. If the firm relies too much on debt, it may have trouble meeting interest payments and repaying loans. The most important debt ratio is the debt-to-equity ratio.
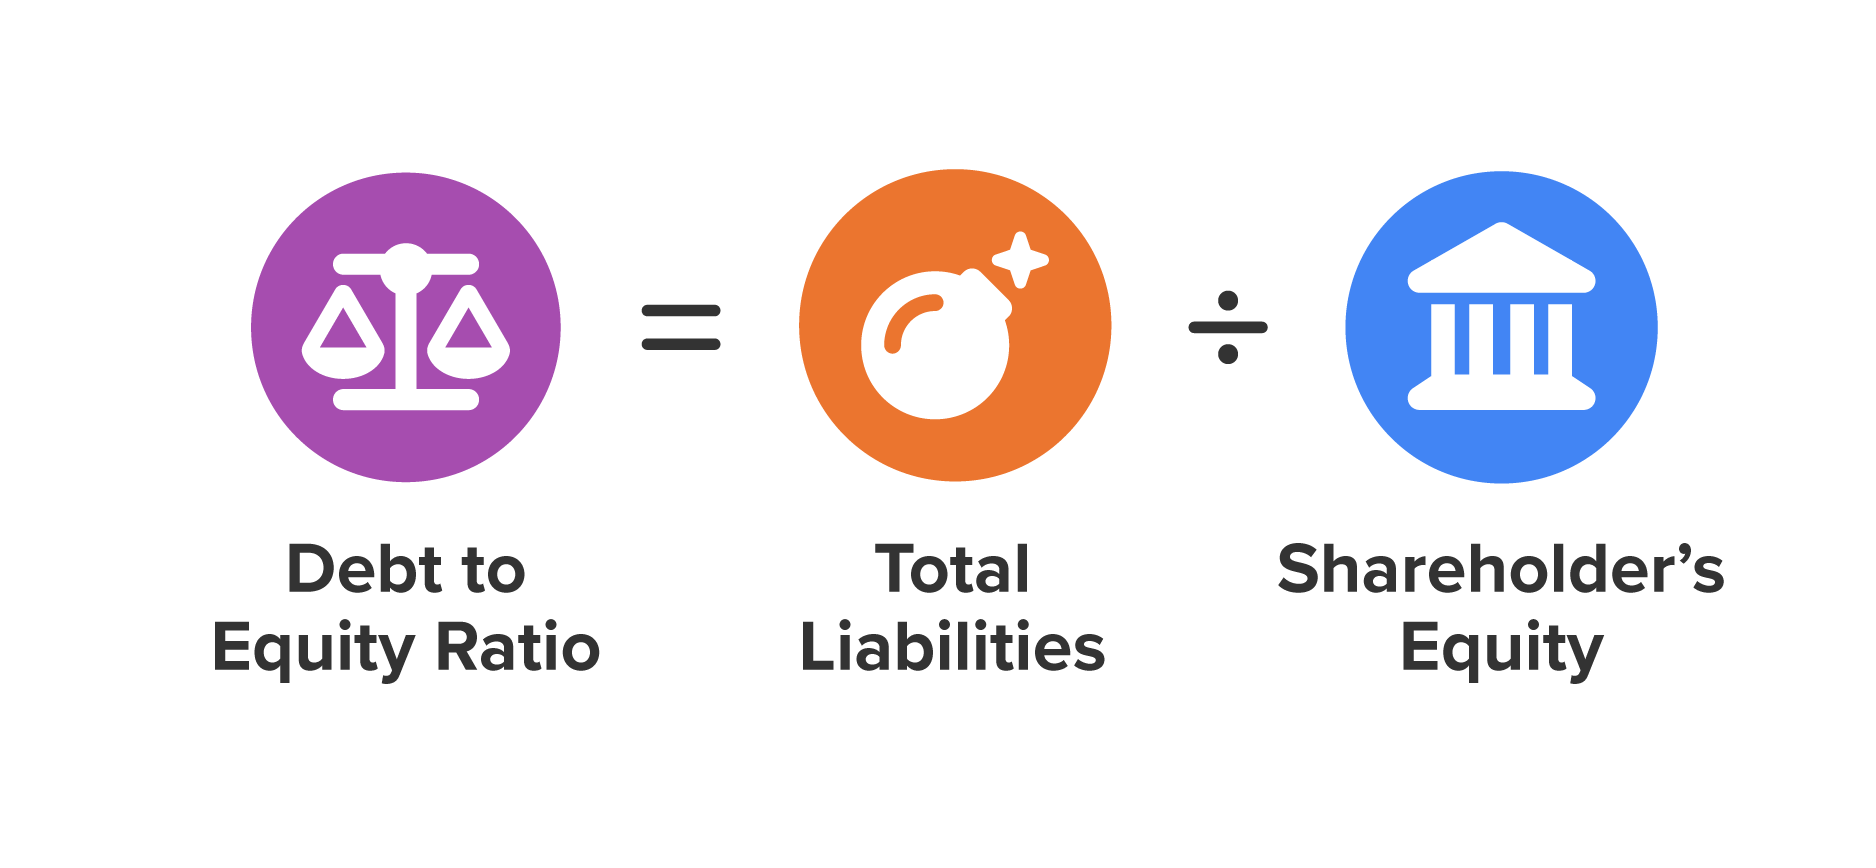
The debt-to-equity ratio measures the relationship between the amount of debt financing (borrowing) and the amount of equity financing (owners’ funds). It is calculated by dividing total liabilities by owners’ equity. In general, the lower the ratio, the better. However, it is important to assess the debt-to-equity ratio against both past values and industry averages.
Let’s look at how Jace might perform a current ratio to get a view of his company’s financial health.
IN CONTEXT: The Financial Health of Jace’s Mobile Detailing
Let’s suppose this information:
Jace has current assets of $15,000, which include cash, accounts receivable, and supplies. Now, suppose he has $2,000 worth of inventory, which would be supplies such as towels and car wax. His liabilities are $7,000, which include payments for his mobile van and credit card balances.
His current ratio would look like this:

The current ratio of $2.14 is good. This means that he has $2.14 of current assets (remember, assets are a good thing!) for every $1 of debt. This shows he has good liquidity and should have no issue paying his short-term debts.
By their 14th year, Amira and Mariam realized that AmmA’s success wasn’t just about technology or staffing; it was about disciplined accounting and financial management. In the early years, AmmA’s finances were simple—seed grants, small subscriptions, and low expenses. However, as it expanded to 34 countries and managed millions in grants, the need for solid financial practices grew. The cofounders had to learn two types of accounting:
For AmmA, financial accounting meant creating reports for external parties such as the World Bank, regulators, and investors who needed transparency. These reports followed strict standards such as IFRS in Europe and GAAP in the United States. Managerial accounting, on the other hand, was focused on internal decision making to guide the organization’s future growth.
IN CONTEXT:
Analyzing AmmA’s Financial Statements
Page through AmmA’s financial statements and see if you can identify the total liabilities, owner’s equity, and assets AmmA is reporting for 2025.
How did Amira and Mariam calculate these ratios? Let’s see.
Source: THIS CONTENT HAS BEEN ADAPTED FROM RICE UNIVERSITY’S “INTRODUCTION TO BUSINESS”. ACCESS FOR FREE AT OpenStax. LICENSE: CREATIVE COMMONS ATTRIBUTION 4.0 INTERNATIONAL.