Approximately 1% of the cells of the heart are a part of the cardiac conduction system. This group of cells are self-exciting and produce electrical signals, or electrical impulses, that stimulate heart contractions. They act as a pacemaker and drive our heart contractions. More importantly, they do so independently of the nervous system. This is an interesting fact because even if all nerves that were leading to the heart were cut, the heart would still be able to beat.
There are two places where a bunch of the specialized cardiac conduction system cells cluster, and these clusters are called nodes. Our heart beats because of the self-exciting cells in the two nodes of the heart.
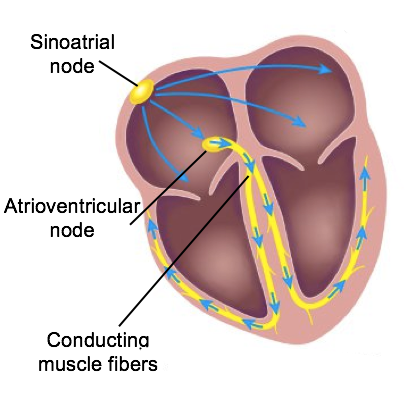
The sinoatrial node (also known as the SA node) produces an excitation wave that will spread over both of the atria. This signals for contraction and spreads so quickly that the cardiac muscle cells will contract together almost as one unit. When our atria contract, blood flows into our ventricles.
This wave will start to slow down when it reaches our atrioventricular node (AV node), which is the second node. The slower conduction in the atrioventricular node is important because it allows for the atria to have time to finish contracting before the wave travels from the atrioventricular node to the ventricles. Once the atria are done contracting and the blood has filled out the ventricles, then the wave will stimulate the ventricles to contract. Connected to these nodes, we have conducting muscle fibers that spread throughout the atria and the ventricles.
It is because there is some sort of malfunction in their own SA node. The artificial pacemaker is implanted so they still have the stimulus for these heart contractions.
Arising from the AV node, the atrioventricular bundle, clinically known as the bundle of His, proceeds through the interventricular septum before dividing into two atrioventricular bundle branches, commonly called the left and right bundle branches. The left bundle branch supplies the left ventricle, and the right bundle branch supplies the right ventricle. Because the left ventricle is much larger than the right, the left bundle branch is also considerably larger than the right.
Portions of the right bundle branch are found in the moderator band and supply the right papillary muscles. Because of this connection, each papillary muscle receives the impulse at approximately the same time, so they begin to contract simultaneously just prior to the remainder of the myocardial contractile cells of the ventricles. This is believed to allow tension to develop on the chordae tendineae prior to right ventricular contraction. There is no corresponding moderator band on the left. Both bundle branches descend and reach the apex of the heart where they connect with the Purkinje fibers. This passage takes approximately 25 milliseconds (ms).
The Purkinje fibers are additional myocardial conductive fibers that spread the impulse to the myocardial contractile cells in the ventricles. They extend throughout the myocardium from the apex of the heart toward the atrioventricular septum and the base of the heart.
The Purkinje fibers have a fast inherent conduction rate, and the electrical impulse reaches all of the ventricular muscle cells in approximately 75 ms. Because the electrical stimulus begins at the apex, the contraction also begins at the apex and travels toward the base of the heart, similar to squeezing a tube of toothpaste from the bottom. This allows the blood to be pumped out of the ventricles and into the aorta and pulmonary trunk. The total time elapsed from the initiation of the impulse in the SA node until depolarization (the reduction of membrane potential, making the inside of a cell less negative) of the ventricles is approximately 225 ms. Note that depolarization results in contraction.
Since the SA node is the pacemaker, it reaches threshold faster than any other component of the conduction system. It will initiate the impulses spreading to the other conducting cells. The SA node, without nervous or endocrine control, would initiate a heart impulse approximately 80–100 times per minute. Although each component of the conduction system is capable of generating its own impulse, the rate progressively slows as you proceed from the SA node to the Purkinje fibers.
Without the SA node, the AV node would generate a heart rate of 40–60 beats per minute. If the AV node were blocked, the atrioventricular bundle would fire at a rate of approximately 30–40 impulses per minute. The bundle branches would have an inherent rate of 20–30 impulses per minute, and the Purkinje fibers would fire at 15–20 impulses per minute.
While a few exceptionally trained aerobic athletes demonstrate resting heart rates in the range of 30–40 beats per minute (the lowest recorded figure is 28 beats per minute for Miguel Indurain, a cyclist), for most individuals, rates lower than 50 beats per minute would indicate a condition called bradycardia. Depending upon the specific individual, as rates fall much below this level, the heart would be unable to maintain an adequate flow of blood to vital tissues, initially resulting in decreasing loss of function across the systems, unconsciousness, and ultimately, death.
IN CONTEXT
This information can be observed as an electrocardiogram (ECG)—a recording of the electrical impulses of the cardiac muscle, shown below. You will learn more about ECGs in a future lesson.
The beating of the heart is regulated by an electrical impulse that causes the characteristic reading of an ECG. The signal is initiated at the sinoatrial valve. The signal then (a) spreads to the atria, causing them to contract. The signal is (b) delayed at the atrioventricular node before it is passed on to the (c) heart apex. The delay allows the atria to relax before the (d) ventricles contract. The final part of the ECG cycle prepares the heart for the next beat.
terms to know
Cardiac Conduction System
A system of specialized cells and nodes in the heart that rhythmically paces the heart and time when the chambers contract; it includes the sinoatrial node (SA node) and the atrioventricular node (AV node).
Sinoatrial Node (SA Node)
Known as the pacemaker of the heart due to its ability to depolarize and repolarize faster than the rest of the cardiac conduction system; it is located in the right atrium of the heart.
Atrioventricular Node (AV Node)
Known as the “gateway” between the atria and ventricles; the AV node slows down the rate at which the action potential travels from the atria to the ventricles, allowing for more filling time.
Atrioventricular Bundle
Myocardial conductive cells that transmit the AV node signal into the interventricular septum.
Atrioventricular Bundle Branches
Left and right divisions of the atrioventricular bundle that transmit the signal to the respective ventricles.
Purkinje Fiber
A myocardial conductive fiber that spreads the impulse to the myocardial contractile cells in the ventricles.
2. Cardiac Cycle
The period of time that begins with the contraction of the atria and ends with ventricular relaxation is known as the cardiac cycle. The period of contraction that the heart undergoes while it pumps blood into circulation is called systole. The period of relaxation that occurs as the chambers fill with blood is called diastole. Both the atria and ventricles undergo systole and diastole, and it is essential that these components be carefully regulated and coordinated to ensure blood is pumped efficiently to the body.
Recall that fluids, whether gases or liquids, are materials that flow according to pressure gradients—that is, they move from regions that are higher in pressure to regions that are lower in pressure. Accordingly, when the heart chambers are relaxed (diastole), blood will flow into the atria from the veins, which are higher in pressure. As blood flows into the atria, the pressure will rise, so the blood will initially move passively from the atria into the ventricles. When the conduction system triggers the muscles in the atria to contract (atrial systole), the pressure within the atria rises further, pumping blood into the ventricles.
During ventricular systole, pressure rises in the ventricles, pumping blood into the pulmonary trunk from the right ventricle and into the aorta from the left ventricle.
Overview of the Cardiac Cycle—The cardiac cycle begins with atrial systole and progresses to ventricular systole, atrial diastole, and ventricular diastole, when the cycle begins again. Correlations to the ECG are highlighted.
terms to know
Cardiac Cycle
The period of time that begins with contraction of the atria and ends with ventricular relaxation.
Systole
The period of contraction that the heart undergoes while it pumps blood into circulation.
Diastole
The period of relaxation that occurs as the chambers fill with blood.
3. Phases of the Cardiac Cycle
At the beginning of the cardiac cycle, both the atria and ventricles are relaxed (diastole). Blood is flowing into the right atrium from the superior and inferior venae cavae and the coronary sinus. Blood flows into the left atrium from the four pulmonary veins. The two atrioventricular valves are both open, so blood flows unimpeded from the atria and into the ventricles. Approximately 70%–80% of ventricular filling occurs by this method. The two semilunar valves are closed, preventing backflow of blood into the right and left ventricles from the pulmonary trunk on the right and the aorta on the left.
3a. Atrial Systole and Diastole
Contraction of the atria follows depolarization, represented by the P wave of the ECG (shown in the image below). As the atrial muscles contract from the superior portion of the atria toward the atrioventricular septum, pressure rises within the atria, and blood is pumped into the ventricles through the open right and left atrioventricular valves.
At the start of atrial systole, the ventricles are normally filled with approximately 70%–80% of their capacity due to inflow during diastole. Atrial contraction, also referred to as the “atrial kick,” contributes the remaining 20%–30% of filling. Atrial systole lasts approximately 100 ms and ends prior to ventricular systole, as the atrial muscle returns to diastole and blood flow into the atria resumes.
3b. Ventricular Systole
Ventricular systole follows the depolarization of the ventricles and is represented by the QRS complex in the ECG. It may be conveniently divided into two phases, lasting a total of 270 ms. At the end of atrial systole and just prior to ventricular contraction, the ventricles contain approximately 130 mL of blood in a resting adult in a standing position. This volume is known as the end diastolic volume (EDV).
Phase 1: Initially, as the muscles in the ventricle contract, the pressure of the blood within the chamber rises, but it is not yet high enough to open the semilunar (pulmonary and aortic) valves and be ejected from the heart. However, blood pressure quickly rises above that of the atria that are now relaxed and in diastole. This increase in pressure causes blood to flow back toward the atria, closing the atrioventricular valves. Since blood is not being ejected from the ventricles at this early stage, the volume of blood within the chamber remains constant. Consequently, this initial phase of ventricular systole is known as isovolumetric contraction (iso, equal).
Phase 2: In the second phase of ventricular systole, the ventricular ejection phase, the contraction of the ventricular muscle has raised the pressure within the ventricle to the point that it is greater than the pressure in the pulmonary trunk and the aorta. Blood is pumped from the heart, pushing open the pulmonary and aortic semilunar valves.
Pressure generated by the left ventricle will be appreciably greater than the pressure generated by the right ventricle, since the existing pressure in the aorta will be so much higher. Nevertheless, both ventricles pump the same amount of blood. This quantity is referred to as stroke volume. Stroke volume will normally be in the range of 70–80 mL. Since ventricular systole began with an EDV of approximately 130 mL of blood, this means that there is still 50–60 mL of blood remaining in the ventricle following contraction. This volume of blood is known as the end systolic volume (ESV).
terms to know
End Diastolic Volume (EDV)
The volume of blood present in the ventricles following ventricular diastole.
Isovolumetric Contraction
The initial phase of ventricular systole in which pressure in the ventricle increases, but no blood is ejected from the heart.
Ventricular Ejection Phase
The second phase of ventricular systole during which blood is pumped from the ventricle.
End Systolic Volume (ESV)
The amount of blood remaining in each ventricle following ventricular systole.
3c. Ventricular Diastole
Ventricular relaxation, or diastole, follows the repolarization (in which membrane potential is returned to its negative state) of the ventricles and is represented by the T wave of the ECG. It, too, is divided into two distinct phases and lasts approximately 430 ms.
Phase 1: During the early phase of ventricular diastole, as the ventricular muscle relaxes, pressure on the remaining blood within the ventricle begins to fall. When pressure within the ventricles drops below pressure in both the pulmonary trunk and aorta, blood flows back toward the heart, producing the dicrotic notch (small dip) seen in blood pressure tracings. The semilunar valves close to prevent backflow into the heart. Since the atrioventricular valves remain closed at this point, there is no change in the volume of blood in the ventricle, so the early phase of ventricular diastole is called the isovolumetric ventricular relaxation phase.
Phase 2: In the second phase of ventricular diastole, called late ventricular diastole, as the ventricular muscle relaxes, pressure on the blood within the ventricles drops even further. Eventually, it drops below the pressure in the atria. When this occurs, blood flows from the atria into the ventricles, pushing open the right and left atrioventricular valves. As pressure drops within the ventricles, blood flows from the major veins into the relaxed atria and from there into the ventricles. Both chambers are in diastole, the atrioventricular valves are open, and the semilunar valves remain closed. The cardiac cycle is complete.
Relationship Between the Cardiac Cycle and ECG—Initially, both the atria and ventricles are relaxed (diastole). The P wave represents depolarization of the atria and is followed by atrial contraction (systole). Atrial systole extends until the QRS complex, at which point, the atria relax. The QRS complex represents depolarization of the ventricles and is followed by ventricular contraction. The T wave represents the repolarization of the ventricles and marks the beginning of ventricular relaxation.
term to know
Isovolumetric Ventricular Relaxation Phase
The early phase of ventricular diastole in which pressure in the ventricle decreases and the semilunar valves close.
4. Heart Sounds
did you know
One of the simplest, yet most effective, diagnostic techniques applied to assess the state of a patient’s heart is auscultation, which refers to listening to internal body sounds, using a stethoscope.
In a normal, healthy heart, there are only two audible heart sounds: S₁ and S₂. Both of these sounds are created by the closing of heart valves, much like the closing of a door causes a sound.
S₁ is the sound created by the closing of the atrioventricular valves during ventricular contraction and is normally described as a “lub,” or first heart sound.
The second heart sound, S₂, is the sound of the closing of the semilunar valves during ventricular diastole and is described as a “dub.”
try it
Click the following link to hear a heartbeat using a stethoscope. (Note: Make sure to turn your volume up to hear the audio file.)
There is a third heart sound, S₃, but it is rarely heard in healthy individuals. It may be the sound of blood flowing into the atria, or blood sloshing back and forth in the ventricle, or even tensing of the chordae tendineae. S₃ may be heard in youth, some athletes, and pregnant people. If the sound is heard later in life, it may indicate congestive heart failure, warranting further tests. Some cardiologists refer to the collective S₁, S₂, and S₃ sounds as the “Kentucky gallop,” because they mimic those produced by a galloping horse. The fourth heart sound, S₄, results from the contraction of the atria pushing blood into a stiff or hypertrophic ventricle, indicating failure of the left ventricle. S₄ occurs prior to S₁, and the collective sounds S₄, S₁, and S₂ are referred to by some cardiologists as the “Tennessee gallop,” because of their similarity to the sound produced by a galloping horse with a different gait.
Heart Sounds and the Cardiac Cycle—In this illustration, the x-axis reflects time with a recording of the heart sounds. The y-axis represents pressure.
The term murmur is used to describe an unusual sound coming from the heart that is caused by the turbulent flow of blood. Murmurs are graded on a scale of 1 to 6, with 1 being the most common, the most difficult sound to detect, and the least serious. The most severe is a 6. Phonocardiograms or auscultograms can be used to record both normal and abnormal sounds using specialized electronic stethoscopes.
try it
Click the following link to hear a murmur using a stethoscope. (Note: Make sure to turn your volume up to hear the audio file.) What you will hear is a beating human heart with a ventricular septal defect (VSD), a hole in the wall separating the left and right ventricles. Because this defect provides an alternative direction for blood, the sounds you hear are caused less by the heart valves closing and more by the blood traveling through the defect.
During auscultation, it is common practice for the clinician to ask the patient to breathe deeply. This procedure not only allows for listening to airflow, but it may also amplify heart murmurs. Inhalation increases blood flow into the right side of the heart and may increase the amplitude of right-sided heart murmurs. Expiration partially restricts blood flow into the left side of the heart and may amplify left-sided heart murmurs. The figure below indicates the proper placement of the bell of the stethoscope to facilitate auscultation.
Stethoscope Placement for Auscultation—Proper placement of the bell of the stethoscope facilitates auscultation. At each of the four locations on the chest, a different valve can be heard.
terms to know
Heart Sound
Sounds heard by auscultation with a stethoscope of the closing of the atrioventricular valves (“lub”) and semilunar valves (“dub”).
Murmur
An abnormal heart sound.
summary
In this lesson, you learned about the conduction system of the heart and how cyclic contraction and relaxation of the heart chambers form the cardiac cycle. You learned the components of the conduction system as well as their functions and how they work together, and the comparative rates of conduction system firing among the various components of the system. You then explored the individual phases of the cardiac cycle—atrial systole and diastole, ventricular systole, and ventricular diastole. Lastly, you learned how the cardiac cycle causes heart sounds.
Myocardial conductive cells that transmit the AV node signal into the interventricular septum.
Atrioventricular Bundle Branches
Left and right divisions of the atrioventricular bundle that transmit the signal to the respective ventricles.
Atrioventricular Node (AV Node)
Known as the “gateway” between the atria and ventricles; the AV node slows down the rate at which the action potential travels from the atria to the ventricles, allowing for more filling time.
Cardiac Conduction System
A system of specialized cells and nodes in the heart that rhythmically paces the heart and time when the chambers contract; it includes the sinoatrial node (SA node) and the atrioventricular node (AV node).
Cardiac Cycle
The period of time that begins with contraction of the atria and ends with ventricular relaxation.
Diastole
The period of relaxation that occurs as the chambers fill with blood.
End Diastolic Volume (EDV)
The volume of blood present in the ventricles following ventricular diastole.
End Systolic Volume (ESV)
The amount of blood remaining in each ventricle following ventricular systole.
Heart Sound
Sounds heard by auscultation with a stethoscope of the closing of the atrioventricular valves (“lub”) and semilunar valves (“dub”).
Isovolumetric Contraction
The initial phase of ventricular systole in which pressure in the ventricle increases, but no blood is ejected from the heart.
Isovolumetric Ventricular Relaxation Phase
The early phase of ventricular diastole in which pressure in the ventricle decreases and the semilunar valves close.
Murmur
An abnormal heart sound.
Purkinje Fiber
A myocardial conductive fiber that spreads the impulse to the myocardial contractile cells in the ventricles.
Sinoatrial Node (SA Node)
Known as the pacemaker of the heart due to its ability to depolarize and repolarize faster than the rest of the cardiac conduction system; it is located in the right atrium of the heart.
Systole
The period of contraction that the heart undergoes while it pumps blood into circulation.
Ventricular Ejection Phase
The second phase of ventricular systole during which blood is pumped from the ventricle.

. The P wave represents depolarization of the atria and is followed by atrial contraction (systole). Atrial systole extends until the QRS complex, at which point, the atria relax. The QRS complex represents depolarization of the ventricles and is followed by ventricular contraction. The T wave represents the repolarization of the ventricles and marks the beginning of ventricular relaxation.")


 spreads to the atria, causing them to contract. The signal is (b) delayed at the atrioventricular node before it is passed on to the (c) heart apex. The delay allows the atria to relax before the (d) ventricles contract. The final part of the ECG cycle prepares the heart for the next beat.")