Table of Contents |
Let’s start with a reminder of the definition of Gross Domestic Product (GDP). GDP is the sum of all final goods and services being produced within a nation’s domestic borders; we use this to measure economic activity in our country from one period to the next, whether from year to year or quarter to quarter.
In theory, we expect to see an upward trend in GDP, which represents growth (GDP growth/nominal GDP growth). This is simply the overall increase in total goods and services over a measured period. On the other hand, when the same data is presented in the real gross domestic product (RGDP) format, the graph will show an upward-and-downward movement.
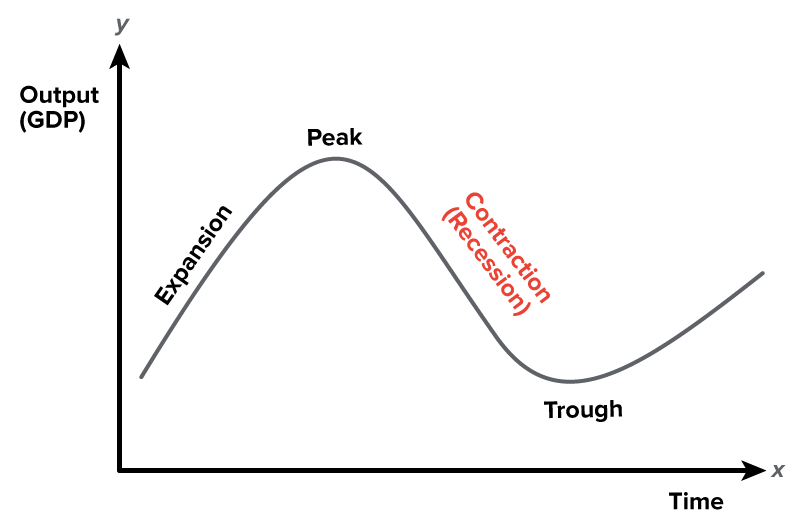
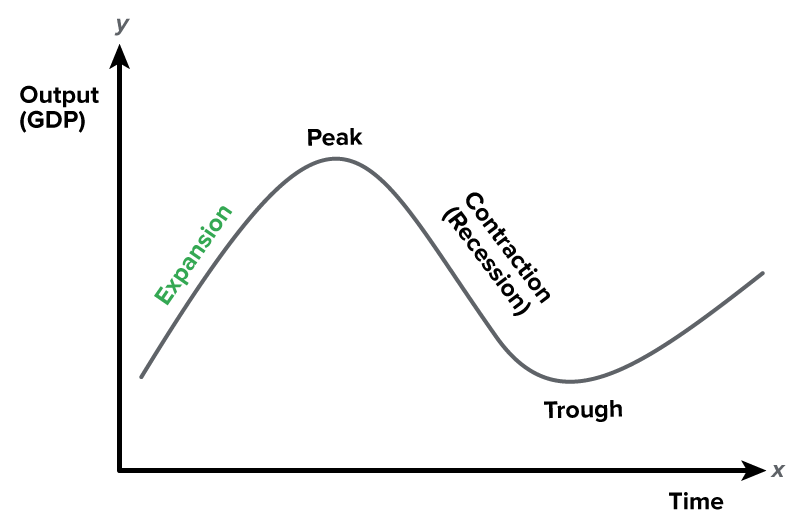
Here is a representation of a business cycle. As you will notice, GDP, referring to the nation’s output, is on the y-axis (vertical axis), and time is on the x-axis (horizontal axis).
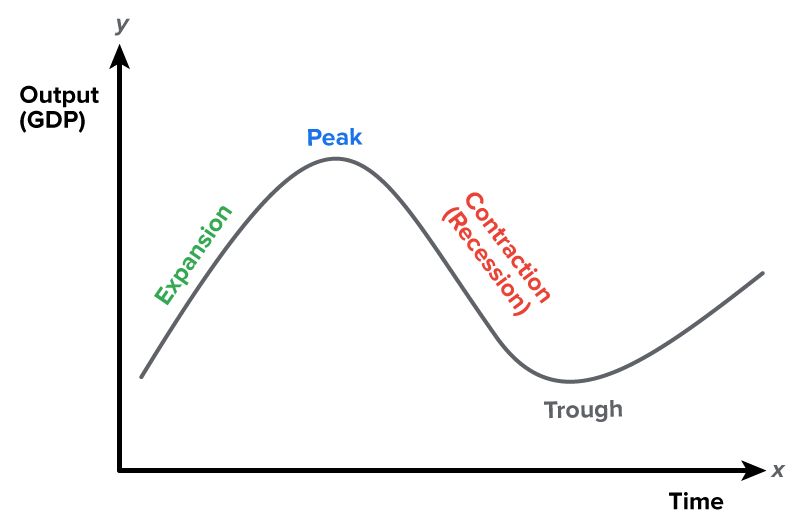
Over time, the hope is that there will be a positive, upward trend of GDP growth. However, we expect our economy to go through periods of expansion and contraction as well.
As mentioned, this is just an example of one business cycle—one that shows that there are times when the economy grows quickly and times when it shrinks. However, the idea is that, over time, we hope that the trend will be one of growth.
The National Bureau of Economic Research (NBER) is one of many organizations that measure this business cycle activity. The NBER officially establishes the start and the end of the recessionary period, which is defined as two consecutive quarterly downturns.
A recession is defined as a decrease in economic activity as reflected in the GDP, occurring during the contraction period of a business cycle with two consecutive quarterly downturns. Basically, the GDP shrinks or the business cycle has a downward slope and starts to trend down.
In our business cycle diagram, you can see the period where the GDP shrinks, which indicates a recession.
According to the NBER,
“A recession is a significant decline in economic activity spread across the economy, lasting more than a few months, normally visible in real GDP, real income, employment, industrial production, and wholesale-retail sales.”
In other words, a recession is not something that happens over a couple of weeks. Generally, in most economics textbooks, the decline in economic activity would have to last about 6 months, or two quarters, in order to be considered a recession.
Recessions are visible in RGDP measurements, meaning that RGDP shrinks. This is because:
Unfortunately, once some workers begin to lose their jobs, they do not have as much money to put back into the economy.
This cutting back on expenditures hurts businesses even further and, in turn, businesses lay off more workers because they notice that demand has fallen for their goods and services.
Thus, the cycle continues, and it gets worse and worse, as shown in the graph below. This graph shows the GDP from 2000 to 2022. Note that the gray periods are official recessions, and you can see that during the recessions, the GDP tends to shrink.

Notice, in particular, that the recession in 2001 was right after 9/11, although it was not as significant as the recession that occurred at the very end of 2007 or 2020, where the GDP declined more significantly.
Conversely, an expansion is the business cycle period that coincides with growth in an economy.
According to the NBER,
“Converse to a recession, if GDP is growing at a rate faster than the overall time trend, we’re said to be in an expansion.”
Then, expansion is the period where the output, or GDP, grows.
Now, the peak labeled in the business cycle is defined as the business cycle period that coincides with the maximum obtainable GDP growth rate for a given point in time.
Remember that this is one business cycle—it is short term. Therefore, this is the maximum ability that can be produced by our economy at any given point in time in the short run.
A peak occurs between expansions and contractions, or recessions, whereas a trough is the business cycle period that coincides with the lowest GDP growth rate for a given point in time.
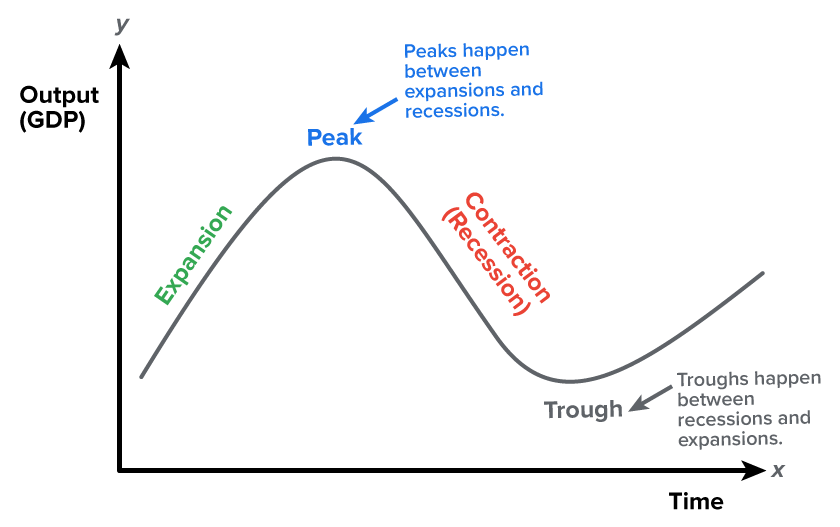
A trough occurs between recessions and the next period of expansion.
It follows that when things are quite bad in an economy and we are also in a recession, we always hope that we are actually at the trough, because this means we have experienced the worst of it and are ready to turn things around again.
Source: THIS TUTORIAL WAS AUTHORED BY SOPHIA LEARNING. PLEASE SEE OUR TERMS OF USE.