Table of Contents |
So, why would countries trade with each other? Well, part of the answer is that countries have different advantages and disadvantages in terms of the following:
EXAMPLE
Some countries have an advantage in labor-intensive raw materials, while others have an advantage in capital-intensive goods.The United States has the potential to produce many goods and services because we have many natural resources; sophisticated technologies; and a trained, highly skilled, and educated workforce.
Does that mean, though, that we should not trade with others who might be slightly less efficient?
The same idea applies to trade because of the concept of opportunity cost. As a reminder, opportunity cost is the sacrifice made by choosing one value or opportunity over another. It is the value of a forgone opportunity, or what has been given up.
EXAMPLE
Whenever the United States decides to devote resources like land, labor, and capital to produce textiles, we give up the opportunity to use those resources to produce something else, such as cars, because our land, labor, and capital are scarce. There is a limited amount of them. Therefore, what is given up is our opportunity cost.Absolute advantage is the advantage conferred between two countries when one country clearly has a lead in the production of a given good relative to the amount of needed input.
Let’s explore the concept of absolute advantage by walking through an example in context.
IN CONTEXT
Suppose the United States can either build 21 cars or produce seven million textiles in a production period, whereas Mexico can either build eight cars or produce four million textiles in that same production period.
In this case, the United States enjoys an absolute advantage in both activities because it is absolutely more productive.
Absolute advantage is defined as the advantage conferred between two countries when one country clearly has a lead in the production of a given good relative to the amount of needed input.
So, how should these countries divide the tasks? Well, we must figure out who has the lower cost for each activity, and this utilizes the theory of comparative advantage.
Comparative advantage is the advantage conferred to a country because of the production of one good relative to another.
So, if the United States and Mexico divide the tasks most efficiently by specializing in the task for which they have the lower opportunity cost, then both countries will benefit.
Therefore, we need to determine who gives up less in terms of textiles when they produce cars and who gives up less in terms of cars when they produce textiles. Let’s outline the relevant information in a chart.
| Output in a Production Period | ||
|---|---|---|
| Cars | Textiles | |
| United States | 21 | 7 |
| Mexico | 8 | 4 |
Now, as mentioned, you can see that the United States has an absolute advantage in both cars and textiles because it can produce more.
So, who should produce each good? What we have to look at now is opportunity cost.
This chart outlines the opportunity cost per country for producing one car.
| Opportunity Cost of Production | ||
|---|---|---|
| Cars | Textiles | |
| United States | 1/3 textile | 3 cars |
| Mexico | 1/2 textile | 2 cars |
Every time the United States produces one car, the cost is what it gives up in terms of textiles. In this case, it gives up one third of a textile for one car, determined by dividing textiles by cars.
When it decides to produce one textile, it gives up three cars.
We calculate the same thing for Mexico, and as you can see, the United States has a lower opportunity cost for producing cars, and Mexico has a lower opportunity cost for producing textiles.
If they specialize in trade according to this, they will both end up with more cars and textiles. This is known as gains from trade, which we will cover in the next section.
This concept can be a bit tricky, so let’s continue with our current example to understand it fully.
Let’s say the United States is now going to devote all its resources to producing cars. If you recall, in a production period, it is able to produce 21 cars.
| Output in a Production Period | ||
|---|---|---|
| Cars | Textiles | |
| United States | 21 | 7 |
| Mexico | 8 | 4 |
Remember, this table expresses how many cars or textiles can be produced when all resources are devoted to either good. Before trade, let’s assume that the United States would need to devote half of its resources to cars and half to producing textiles. If this is the case when producing both items, it would be left with half of what is expressed in the table above—10.5 cars and 3.5 textiles.
Now, to see the impact of specializing in cars and trading for textiles, let’s assume an even, one-to-one trade. So, if it wants, for instance, 5 textiles, it will have to trade away 5 cars, leaving it with 16 cars and 5 textiles.
| United States: Before and After Specialization | ||
|---|---|---|
| Cars | Textiles | |
| Before | 10.5 | 3.5 |
| After | 16 | 5 |
Its gains from trade are 5.5 cars and 1.5 textiles.
Even though the United States enjoys an absolute advantage in the production of both items, it is still better off when it specializes in trade with Mexico. In the same way that two people can get more accomplished by specializing, so can we.
Now, a production possibility frontier (PPF) shows us the maximum combination of two goods that can be produced when an economy’s resources are being utilized.
It is somewhat similar to the long-run aggregate supply curve, except that this is a different graph completely because, here, we are not graphing the price and quantity of something.
Instead, we are graphing all the textiles that can be produced (y-axis) versus cars (x-axis). Notice that we have plotted the numbers from our previous example, which shows the number of each item that each country can produce in a production period.
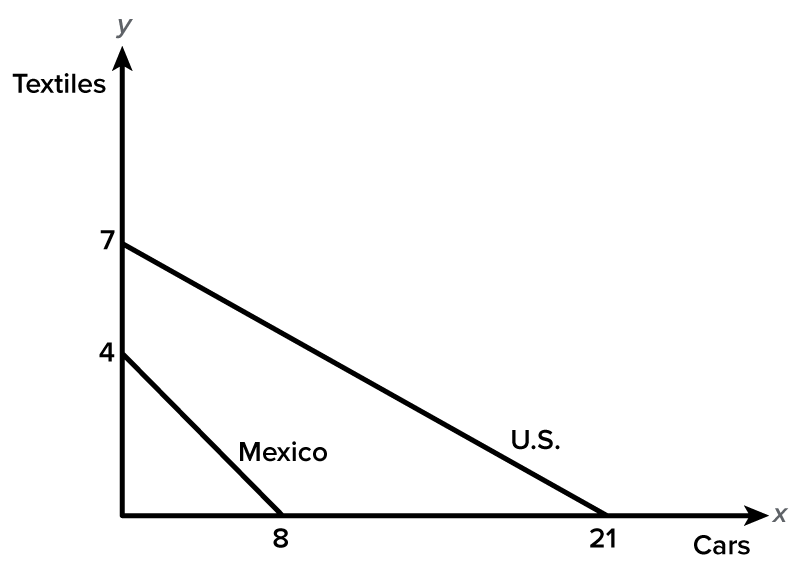
The x-intercept represents how many cars can be produced when all resources are devoted to car production (specialization).
The y-intercept represents how many textiles can be produced with a specialization in textiles.
You can easily see an absolute advantage. On the x-intercept, who can produce more? The United States. On the y-intercept, who can produce more? Again, it is the United States.
Comparative advantage, though, can be seen by looking at the slope. The slope represents the trade-off, or how many units of one item have to be sacrificed in order to produce one more unit of the other.
If you think about it, the country with the flatter slope is going to have a comparative advantage in the item on the x-axis.
EXAMPLE
The United States is giving up fewer textiles every time it produces one more car.The country with the steeper slope is going to have the comparative advantage in the y-axis item because it will be giving up fewer of the item on the x-axis—in this case, fewer cars when it is producing one more textile.
Now, it may seem complicated, but it does make sense if you recognize that the PPF represents a trade-off for every time we produce one more versus how many we give up in terms of the other good.
As we calculated earlier, when the United States and Mexico trade according to comparative advantage—using the United States’ PPF here—you can see that the United States gains 5.5 cars and 1.5 textiles.
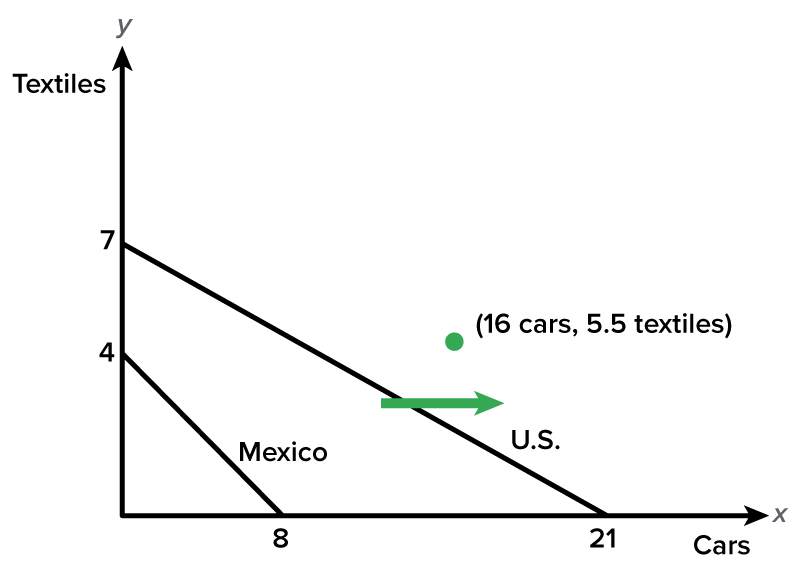
This gain is outside of our initial possibility, which is how we can show economic growth.
Source: THIS TUTORIAL WAS AUTHORED BY KATE ESKRA FOR SOPHIA LEARNING. PLEASE SEE OUR TERMS OF USE.