Table of Contents |
This lesson introduces several important concepts related to microbial growth. In previous lessons, you learned how bacterial cells reproduce (primarily through binary fission) and that this type of reproduction generally produces two identical daughter cells. In other lessons, you learned about ways in which genetic diversity is generated in these daughter cells through horizontal gene transfer.
In this lesson, you will learn about basic growth patterns in different environments (focusing on laboratory cultures) and some examples of direct and indirect ways of measuring microbial growth.
Compared with eukaryotes, prokaryotes can have very rapid or very slow generation times. Generation time (doubling time) is defined as the time it takes for the population to double through one round of binary fission.
When bacteria are actively growing, their generation time can be exceptionally rapid. For example, a laboratory culture of Escherichia coli bacteria provided with ideal growth conditions can double in as little as 20 minutes. However, generation times vary by species and are slower when conditions are less favorable. Additionally, some bacteria can form spores that can be dormant for extended periods of time, and they do not undergo binary fission while dormant.
In the laboratory, bacteria are often grown in containers in which no growth medium is added or removed. These closed (batch) cultures initially have abundant nutrients, but the bacteria gradually use up nutrients as waste builds up. Similar situations are sometimes found in nature (e.g., in a small pond with no input or output of nutrients). In a batch culture, the culture density (number of cells per unit volume) equals the number of cells in the population.
In a batch culture, growth follows a relatively predictable pattern. It is important to realize that this pattern does not reflect more complex patterns found in many natural settings, such as infections, although there may be similarities.
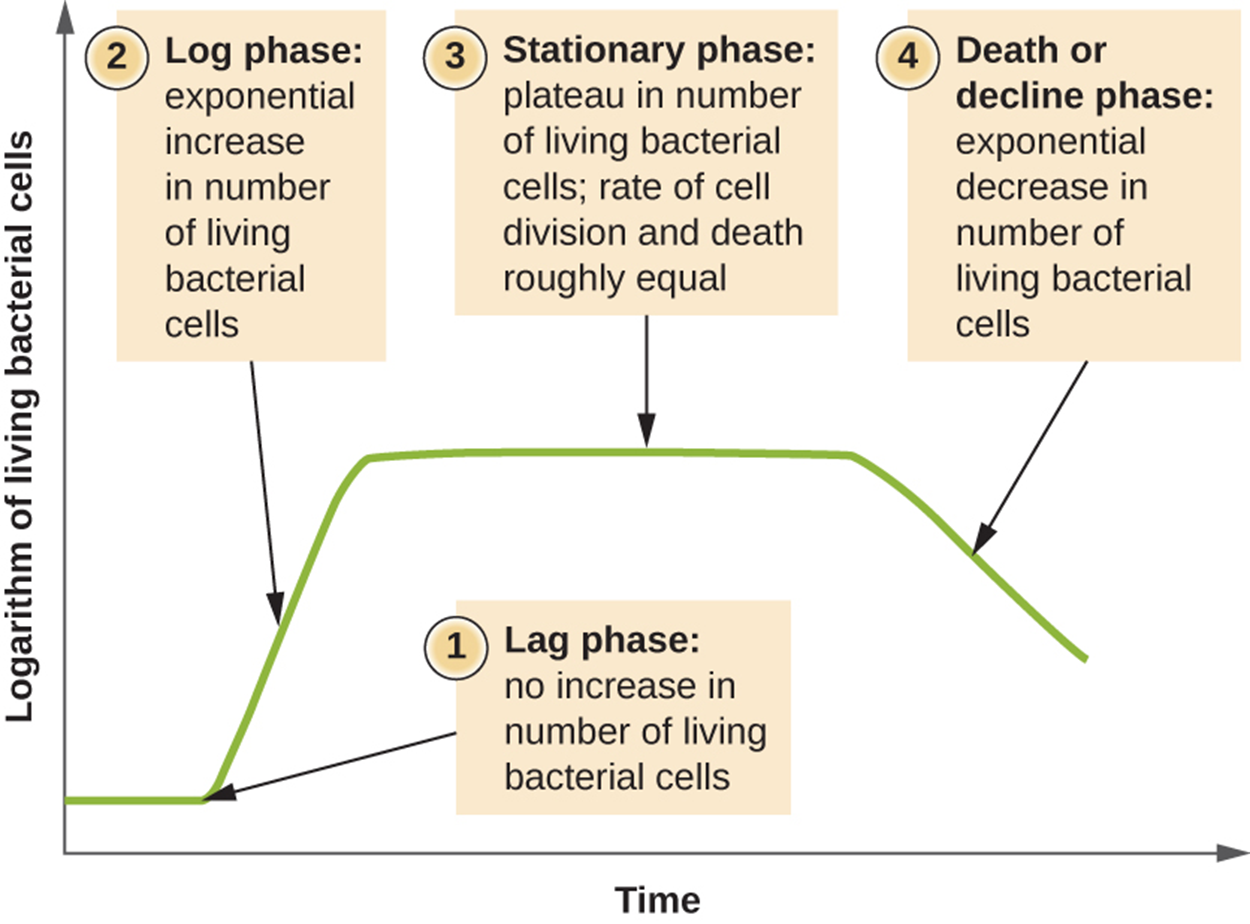
The image below shows the growth curve of a batch culture. The graph plots increasing time on the horizontal axis and increasing number of living bacterial cells (as a logarithmic value) on the vertical axis. The steps shown in the image are explained in detail below.
Natural environments are often open systems, and therefore, growth patterns may be very different. In the laboratory, researchers may want to maintain cells in an open rather than a closed system. This can allow the researchers to keep cells in the exponential growth phase that is generally most useful for laboratory work. This can also be helpful if microbes are being raised to harvest their products.
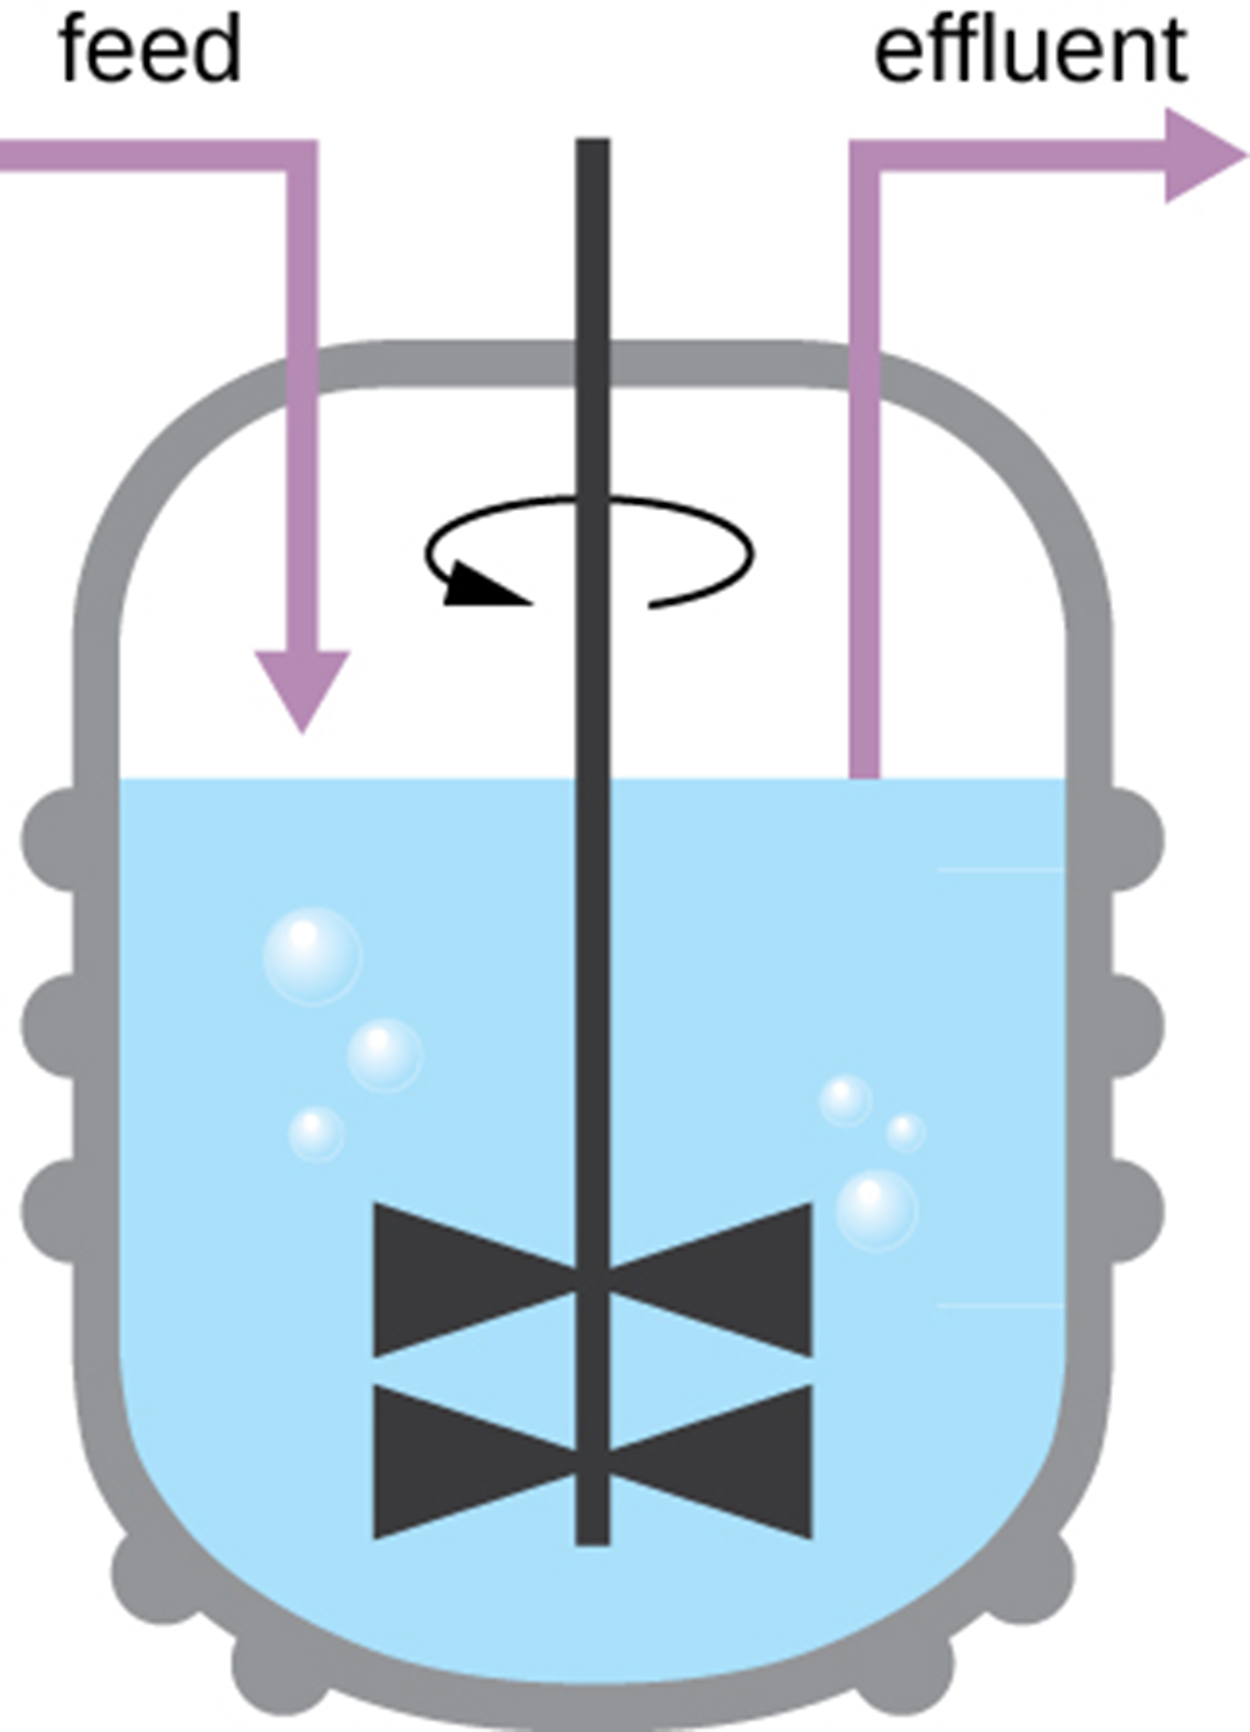
One way to maintain an open culture is using a chemostat as shown in the image below. Nutrients are supplied to a chemostat at a steady rate (the “feed” in the image) and air is mixed into the solution to provide sufficient oxygen for aerobic processes. To maintain an optimal growth environment, bacterial suspension (“effluent” in the image) is removed at the same rate as nutrients flow in.
As mentioned above, there are a variety of ways to measure growth. These are important for a wide range of applications, ranging from understanding microbial ecology in natural systems to determining whether water is safe to drink.
The optimal approach depends on the reason for taking the measurement and on the equipment available. The two major categories of measurement techniques include direct methods and indirect methods.
As the name suggests, direct cell counts involve counting individual cells in a culture or colonies on a plate. It would be impossible to count all of the cells in a large sample, so small samples are used to estimate numbers in larger samples.
The simplest way to count bacteria is called the direct microscopic cell count, which involves transferring a known volume of a culture to a calibrated slide (i.e., a slide with a grid indicating squares of specific areas) and counting the cells under a light microscope. The calibrated slide is called a Petroff-Hausser chamber (or a hemacytometer).
The image below shows a Petroff-Hausser chamber. Part (a) shows a photo and part (b) shows an illustration that demonstrates how squares are marked so that individual cells within squares can be counted. The squares vary in size, but their exact areas are known.
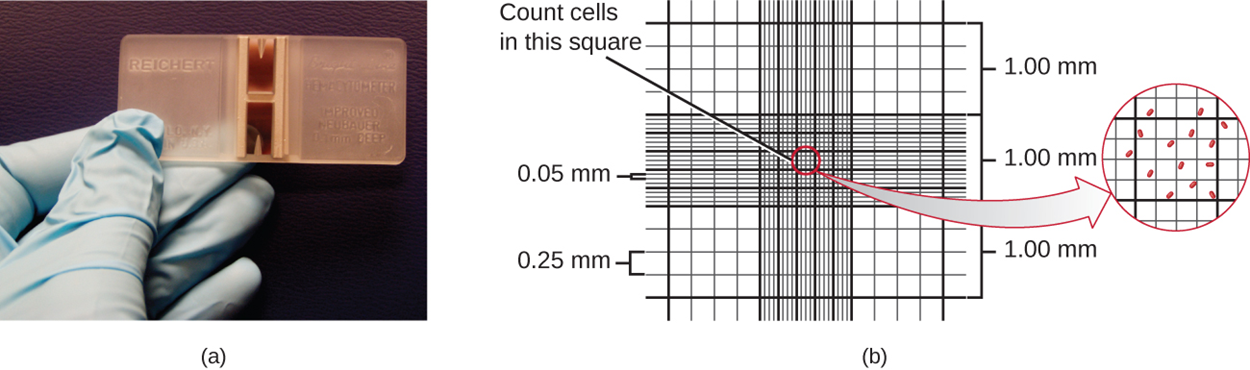
When a sample of culture suspension is added to the chamber under a coverslip placed at a specific height from the surface of the grid, it is possible to estimate the concentration of cells in the original sample. This is accomplished by counting individual cells in a number of squares and determining the volume of sample observed. The area of the squares and the height at which the coverslip is positioned are specified for the chamber. If the solution was diluted, then this must be taken into account in making the estimate. To get a reliable estimate, cells in several small squares are counted and then the average number of cells per square is calculated.
This method has the advantage of being fast and easy but is not accurate when cultures are very dilute and cells are spread far apart. Additionally, it is not always possible to distinguish between living and dead cells (or cell-like materials).
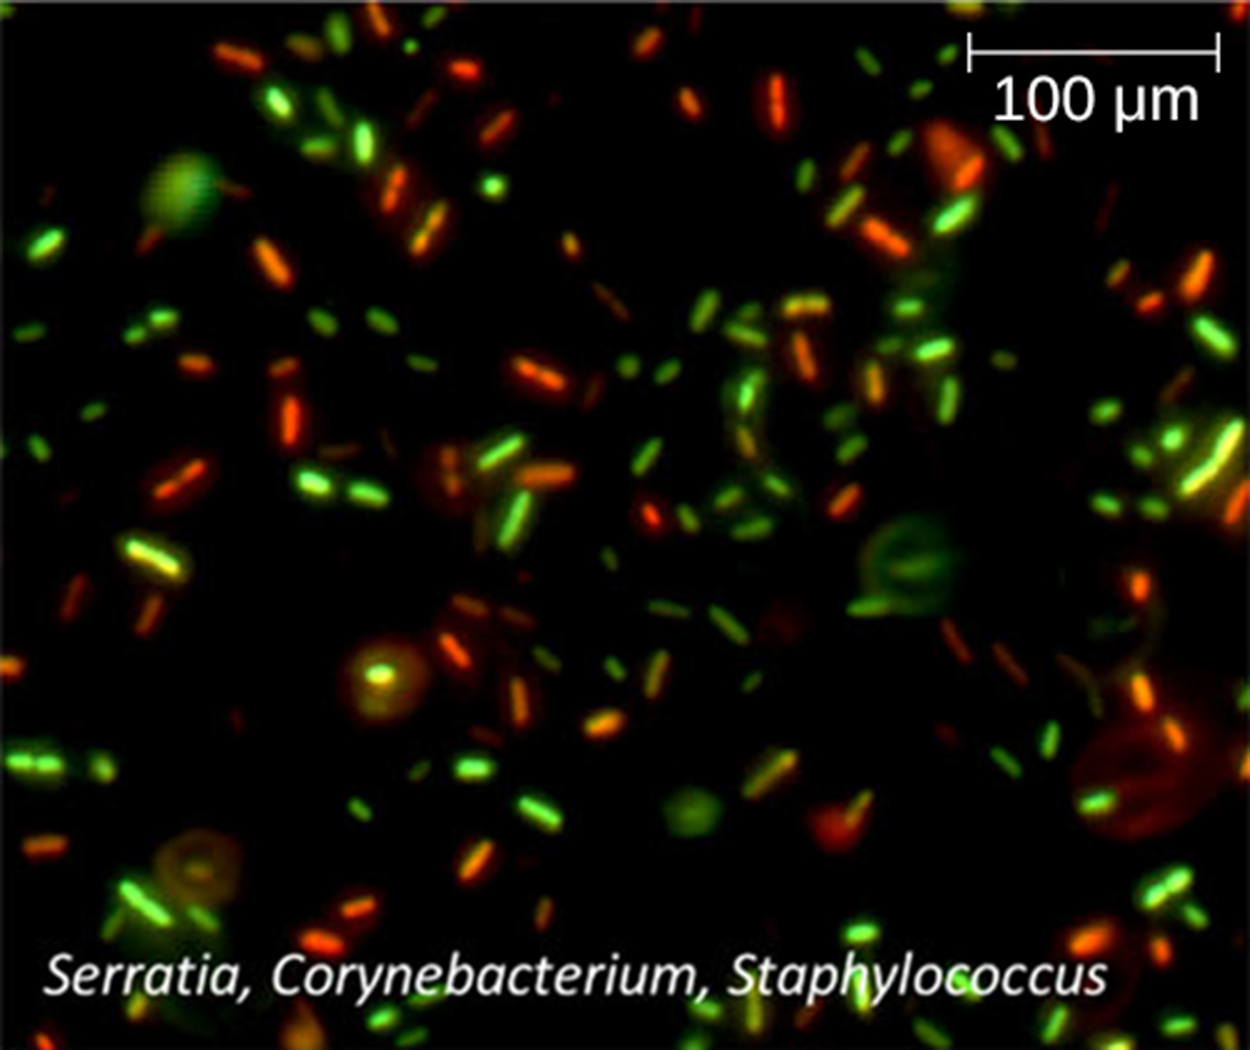
The image below shows a fluorescence staining technique that provides a way to distinguish between living and dead cells. This is called a viability stain. The micrograph shows some red and some green cells. The green primary stain can pass through intact cytoplasmic membranes to stain both living and dead cells. The secondary red stain can only stain cells with damaged cytoplasmic membranes. Therefore, living cells appear green and dead cells appear red.
Another direct cell count technique uses an electronic device called a Coulter counter, which is shown in the image below. A glass tube with a small opening is immersed in an electrolyte solution as shown in part (a). One electrode is suspended in the glass tube, and another is located outside the tube. As cells are drawn through the small opening in the glass tube (illustrated with arrows in the image), they change the electrical resistance measured by the electrodes. Therefore, each resistance change represents the movement of a cell through the opening and is recorded to count the number of cells. Part (b) shows a photograph of a Coulter counter.
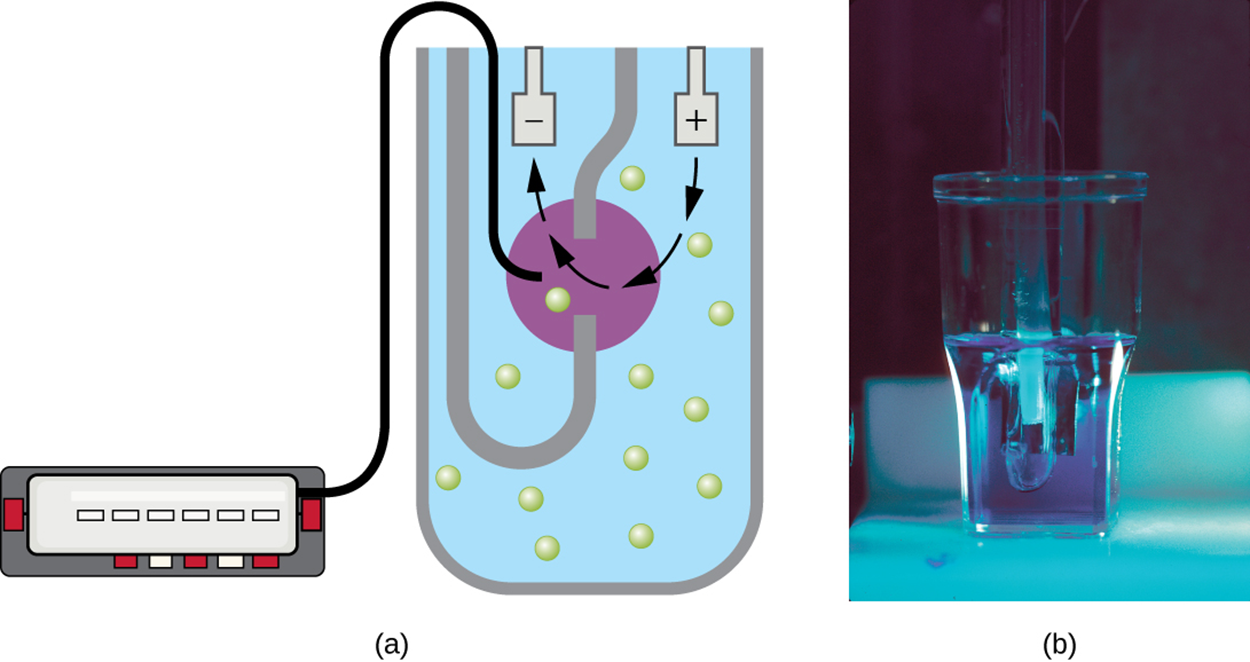
Plate counts are similar to direct cell counts with several important differences. First, they measure numbers of colonies rather than numbers of individual cells. This is an estimate of the number of cells if the concentration of cells in the medium is appropriate, but there is no guarantee that one colony was formed by one cell. Secondly, plate counts measure living cells as dead cells do not form colonies on plates.
Measurements obtained using plate count techniques are usually expressed as colony-forming units per milliliter (CFU/mL) to avoid confusion about the possibility that a colony may be formed by more than one bacterial cell. More than one cell may have landed in the same place or colonies may have grown together. Some bacteria grow in colonies or chains and may be difficult to disperse. Finally, some living cells may not grow on culture medium and may not be counted. Therefore, it is important to carefully distinguish these measurements from direct cell counts.
Microbiologists typically count plates with 30 to 300 colonies. Samples with too few colonies (<30) do not give statistically reliable numbers. Samples with too many colonies (>300) can be crowded and difficult to count, and there is increased risk of having colonies with multiple bacteria.
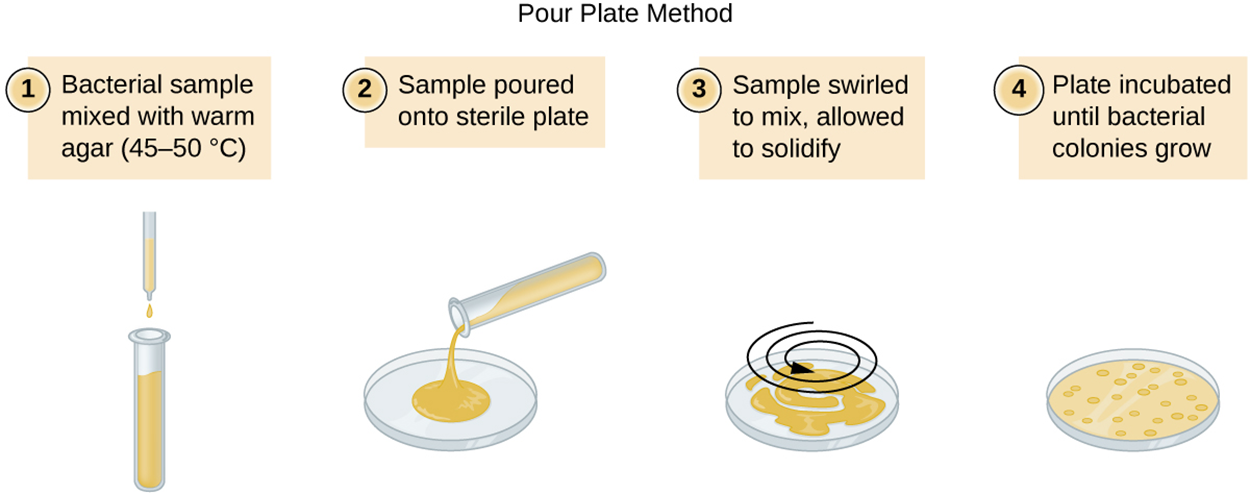
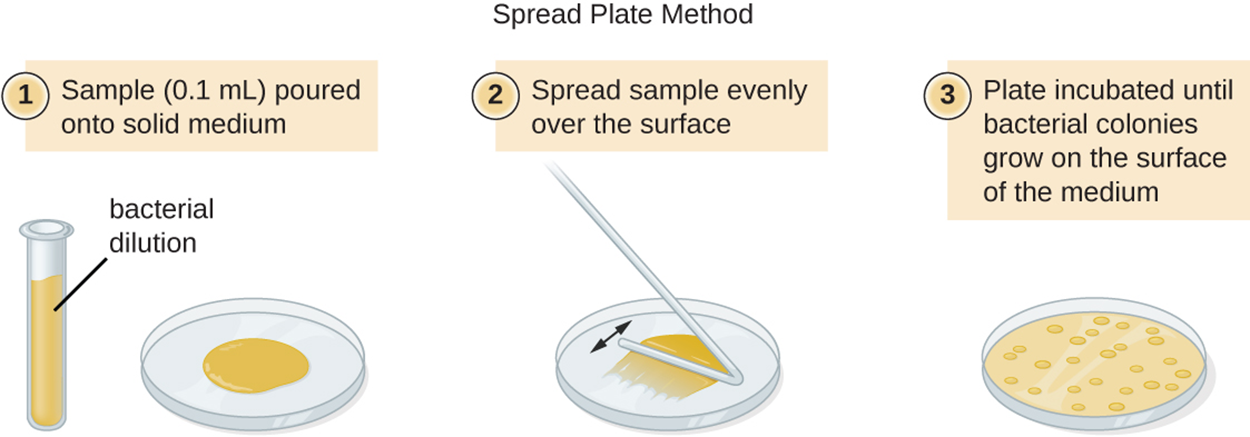
The two major plate count methods are the pour plate and the spread plate methods. In the pour plate method, medium containing cells is poured into petri dishes and incubated. In the spread plate method, bacteria are spread across solid medium in a plate and incubated.
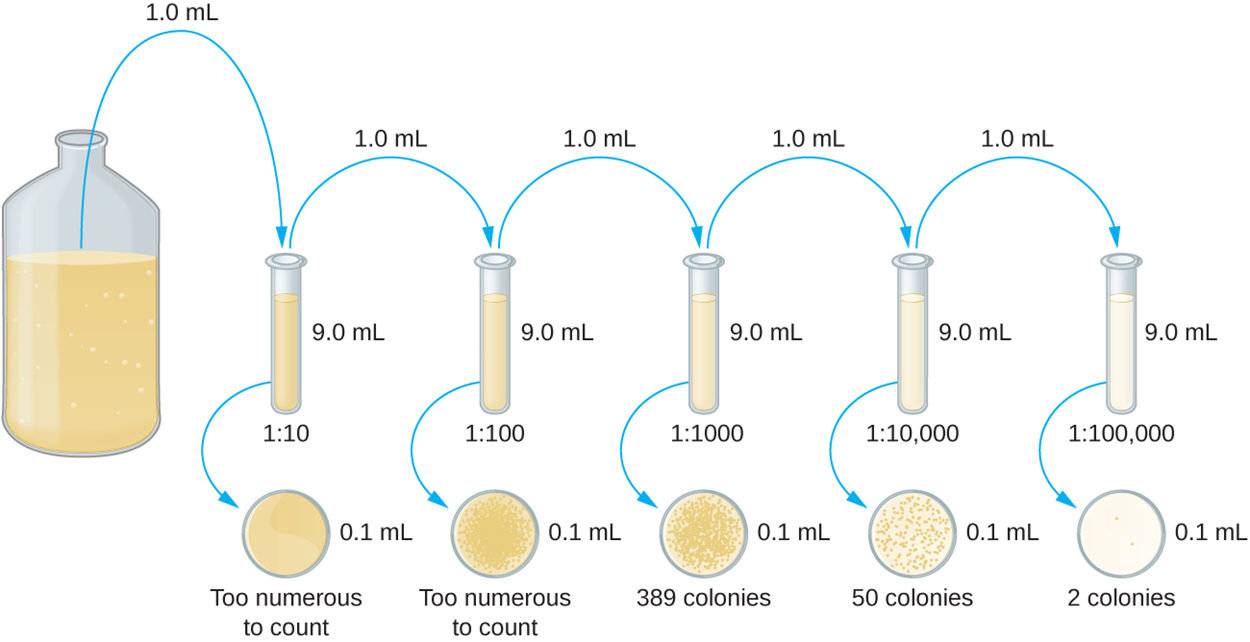
Both of these methods begin with serial dilution, as shown in the image below. Serial dilution helps to ensure that the density of colonies is within the appropriate range of 30 to 300. A fixed volume of the original culture, shown in the large bottle in the image, is added to a test tube. In this case, 1.0 mL of the original solution is added to 9.0 mL in the test tube. A sample is then added to a plate. This process is repeated, adding 1.0 mL from each test tube to the next in the series to increase the dilution. As shown in the image below, some plates may have colonies that are too numerous to count and some may have too few to count (two colonies in this example), but ideally some plates will have appropriate numbers of colonies. The dilution factor is then used to calculate the number of cells in the original cell culture.
The image and description below show the steps of the pour plate method for estimating numbers of bacteria.
The image and description below show the steps of the pour plate method for estimating numbers of bacteria.
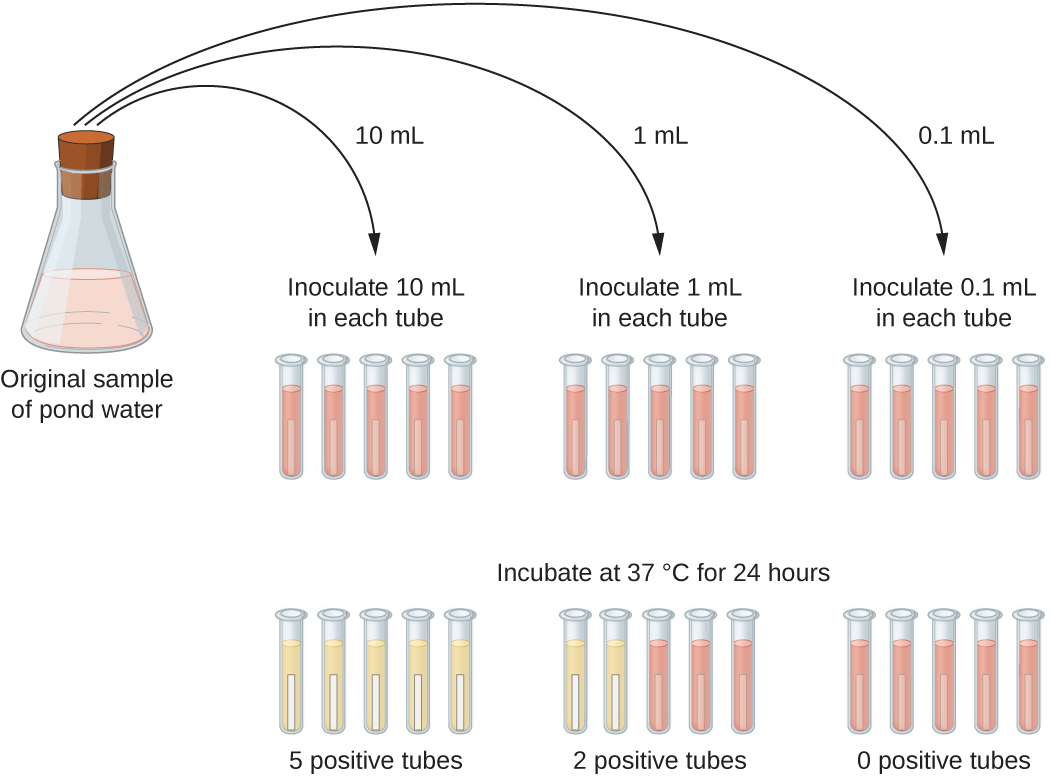
When dilute samples are used, plate count samples are not effective. Instead, the most probable number (MPN) method can be used to estimate the number of viable microorganisms in a sample. This method is important in evaluating water and food samples.
The image below shows an example of the MPN method. Varying amounts from the original sample (10 mL, 1 mL, and 0.1 mL in this example) are transferred to test tubes for incubation. To test for coliform bacteria (associated with fecal contamination of water), lactose broth tubes are used that contain a pH indicator. When bacteria ferment the lactose, the pH becomes more acidic and the color changes from red to yellow. The example below shows five positive tubes when 10 mL is inoculated, two positive tubes when 1 mL is inoculated, and no positive tubes when 0.1 mL is inoculated. These values can be compared with values in an appropriate MPN table to estimate the most probable number of bacteria per 100 mL of the original sample.
In some cases, it is not necessary and/or too difficult to determine the number of cells present. In these cases, indirect cell counts may work well.
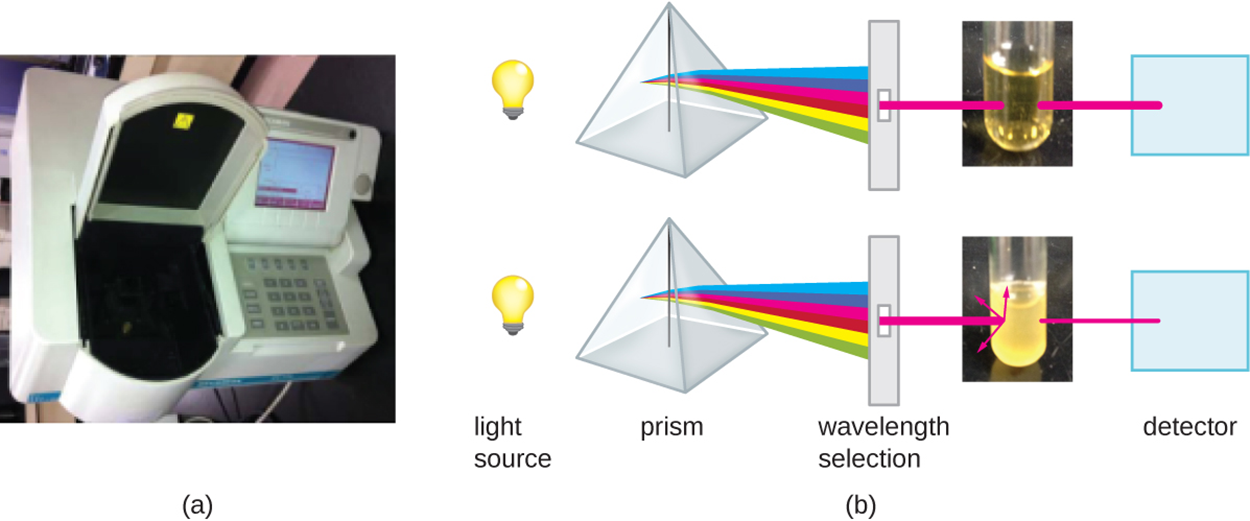
There are several ways to measure indirect cell counts. The image below shows how to use turbidity to estimate cell density. High cell densities produce greater turbidity. It is possible to take multiple turbidity readings and compare them to numbers obtained via plate count methods to develop a way to estimate colony-forming units from turbidity.
Part (a) of the image below shows a spectrophotometer that has been opened so that a sample can be added. The spectrometer measures light passing through and absorbed by the sample. Part (b) shows light from a light source being prepared so that the correct wavelength passes through the sample to a detector. The detector measures how much light passes through versus how much is absorbed. With a lower cell count and lower turbidity (upper image), more light passes through, and less light is absorbed with a higher cell count and higher turbidity (lower image).
There are several other indirect approaches. It is possible to measure the dry weight of a culture sample after using filtration or centrifugation to concentrate the sample and then drying it before weighing. It is also possible to measure chlorophyll and ATP formation, oxygen consumption, and other such values to estimate cell numbers.
This lesson focuses on patterns of cell growth and ways to measure cell numbers. The patterns of cell growth described are based on reproduction using binary fission. However, it is important to realize that some prokaryotes use other methods of cell division.
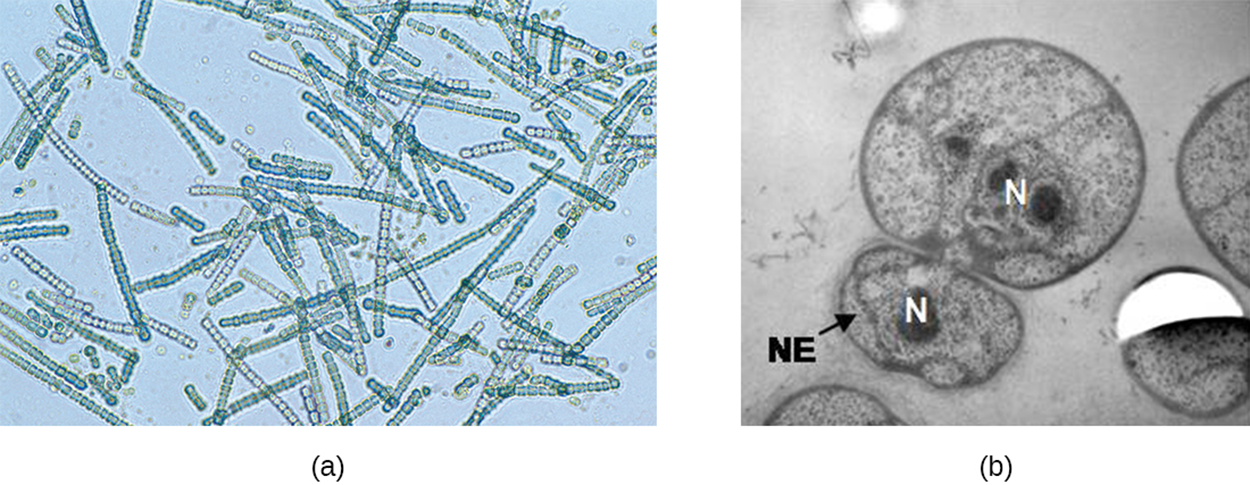
Some cyanobacteria undergo fragmentation, in which many nucleoids that have accumulated within a large cell or filament break apart to simultaneously release many cells. In the giant bacterium Epulopiscium, several daughter cells grow within the parent before the parent disintegrates to release them. Finally, some species form an extension at one pole that swells to form a smaller cell that detaches through a process called budding.
The image below shows a micrograph of filamentous cyanobacteria in part (a), which can reproduce through fragmentation, and in part (b), an electron micrograph of bacterial cells (Gemmata obscuriglobus) budding.
Source: THIS TUTORIAL HAS BEEN ADAPTED FROM OPENSTAX "MICROBIOLOGY." ACCESS FOR FREE AT openstax.org/details/books/microbiology. LICENSE: CC ATTRIBUTION 4.0 INTERNATIONAL. Accessed by August 2022.
REFERENCES
Gibson, B., Wilson, D. J., Feil, E., & Eyre-Walker, A. (2018). The distribution of bacterial doubling times in the wild. Proceedings. Biological sciences, 285(1880), 20180789. doi.org/10.1098/rspb.2018.0789