Table of Contents |
Consider the function  Note that the function is undefined when
  meaning the domain of
  is
is  Let’s examine the behavior of near
Here is a table of values, which reflects the values of as x gets closer to 0 on the positive side:

|
0.1 | 0.01 | 0.001 | 0.0001 | 0.00001 |
|---|---|---|---|---|---|

|
10 | 100 | 1,000 | 10,000 | 100,000 |
Here is a table of values, which reflects the values of as x gets closer to 0 from the negative side:
|
|
-0.1 | -0.01 | -0.001 | -0.0001 | -0.00001 |
|---|---|---|---|---|---|
|
|
-10 | -100 | -1,000 | -10,000 | -100,000 |
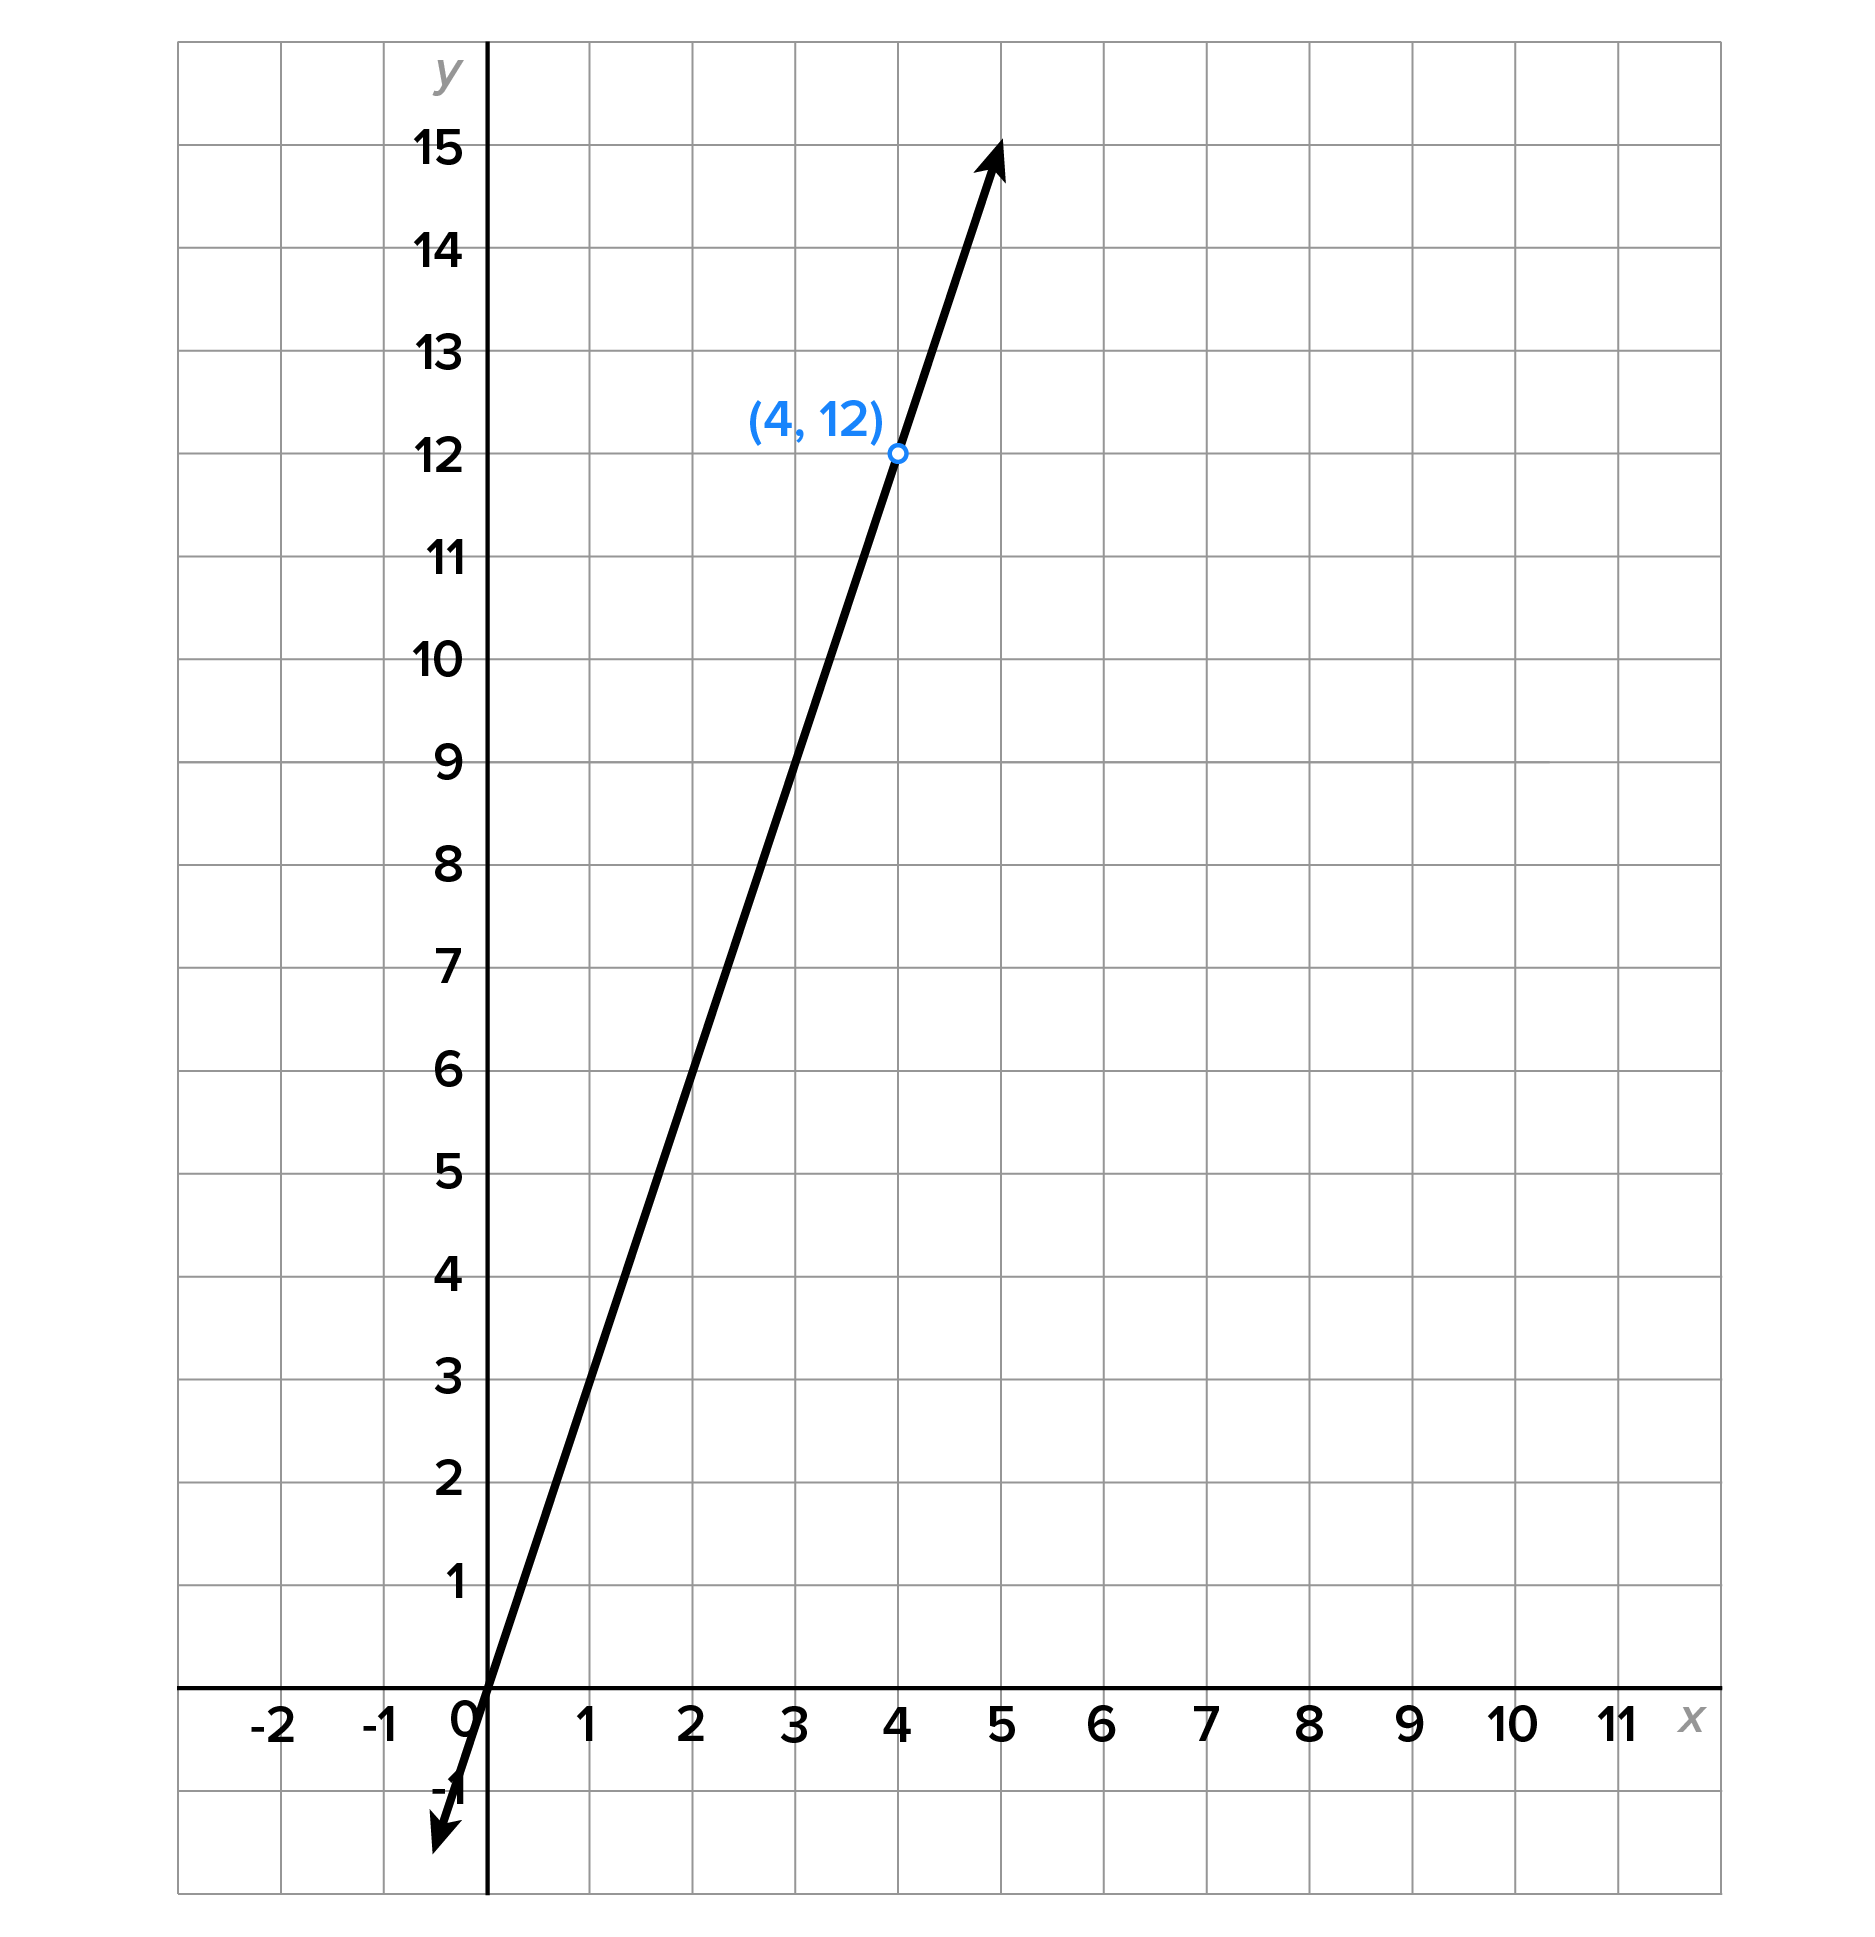
Consider the graph of

Now focus on the graph around
Notice how the graph falls indefinitely as x gets closer to 0 from the left side and rises indefinitely as x gets closer to 0 from the right side.
Using arrow notation, we say that  as
as  , and
, and  as
as 
If we were to draw the line the graph would approach this line as x gets closer to 0 from either side. This line is called a vertical asymptote.
never crosses a vertical asymptote.
Now consider the function 
Note that this function is undefined when  This means that the domain is
  Let’s now examine the behavior of this graph around
|
|
3.9 | 3.99 | 3.999 | 4.001 | 4.01 | 4.1 |
|---|---|---|---|---|---|---|
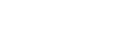
|
11.7 | 11.97 | 11.997 | 12.003 | 12.03 | 12.3 |
Note also that can be simplified by removing a common factor:
 where
where  is a line except when Its graph is shown below.
Notice the hole in the graph at  The graph has a hole in it since there is no definition for when
  and the graph doesn’t rise or fall indefinitely as x gets closer to 4.
To summarize, the vertical asymptotes and holes in the graph correspond to the values of x for which the function is undefined. So, how can we tell when the graph of a function will have a vertical asymptote and when there will be a hole in the graph?
 is undefined. In other words, the denominator is equal to zero. is already in simplest form, then the values found in step 1 correspond to vertical asymptotes. can be simplified, then remove common factors. Let
  the simplified form.
  is equal to zero corresponds to a vertical asymptote of is not equal to 0 corresponds to a hole in the graph of The y-coordinate of the hole in the graph is computed by substituting the value of x into
EXAMPLE
Consider the function Find all vertical asymptotes and/or holes in the graph of
is undefined:
Find all vertical asymptotes and/or holes in the graph of
is undefined:

|
Set the denominator equal to 0. |
 
|
Solve. |
to see if it can be simplified:

|
Factor the numerator and denominator. |

|
Remove the common factor of 
|
 where
where  Now, let
  is equal to zero when
  Since the numerator is not equal to zero when
  this means that
  is a vertical asymptote of the graph of
is not equal to zero, when
is a vertical asymptote of the graph of
is not equal to zero, when  , there is a hole in the graph of when
 and the hole in the graph is at

 Since the numerator and denominator have no common factors, there are no holes in the graph.


 and
and 

 is undefined when
  and when
  can be written in simplest form by cancelling out the common factor of
 then
then  Now, let
  makes both and undefined. This means that there is a vertical asymptote when
 makes undefined but is not undefined. This means there is a hole in the graph when

 the graph of has a hole located at
In closing, it is possible for a rational function to have neither a vertical asymptote nor a hole in the graph. This occurs when there is no real number x for which the denominator is equal to zero.
EXAMPLE
Consider the function is in simplest form.

|
Set the denominator equal to 0. |
 
|
Solve. |
 for which or as
Consider the graph of
Now focus on the graph as  and as
  Notice how the graph appears to “level off” toward
This means that the end behavior of can be described as  as and as
Since  is a horizontal line, we say that the graph of has a horizontal asymptote at
Now consider the function 
Recall that the end behavior of a polynomial is determined by its leading term. In other words:
 is the same as the end behavior of
 is the same as the end behavior of x.
  is the same as the end behavior of
This means that  as and as
Thus,  is the horizontal asymptote of
Before we summarize our findings, another example will be helpful.
EXAMPLE
Determine the horizontal asymptote of
 is the same as the end behavior of
 is the same as the end behavior of
 is the same as the end behavior of
  or
or  or
or 
 (Dividing 4 by a very large number results in a number close to 0).
is the horizontal asymptote of
(Dividing 4 by a very large number results in a number close to 0).
is the horizontal asymptote of
This means that there are certain conditions under which has a horizontal asymptote. Here is a summary.
 where
where  and
and  are polynomials.
is smaller than the degree of
are polynomials.
is smaller than the degree of  then the horizontal asymptote is
and are equal, then the horizontal asymptote is
then the horizontal asymptote is
and are equal, then the horizontal asymptote is  is larger than the degree of then has no horizontal asymptote.
Here is an example to illustrate this important idea.
EXAMPLE
Consider the functions and
and  has horizontal asymptote since the numerator has degree 1, which is less than the degree of the denominator, which is 3.
has horizontal asymptote
has horizontal asymptote since the numerator has degree 1, which is less than the degree of the denominator, which is 3.
has horizontal asymptote  Since the degrees of the numerator and denominator of are the same (they are both 2), the leading coefficient of the numerator is 3, and the leading coefficient of the denominator is 5.
 and
and 

 for which
  as or
as or
Consider a rational function  where and are polynomials.
When the degree of is greater than the degree of by one, then the end behavior of is described by a slant asymptote.
When the degree of is greater than the degree of by more than one, then the end behavior of is described by a nonlinear asymptote.
Both types are found by performing long division or when appropriate, synthetic division.
Before finding these asymptotes, let’s review the division algorithm for polynomials.
By the division algorithm, we know that  has quotient
  and remainder
  for which
  Now, let’s rewrite the equation.

|
This is the original equation. |

|
Divide both sides by 
|

|
Simplify and replace with
|
Remember that according to the division algorithm, the degree of is less than the degree of This means that  as and as
Thus, the end behavior of is the same as the end behavior of  the quotient.
A slant asymptote is the oblique asymptote obtained when the degree of the numerator is one greater than the degree of the denominator.
EXAMPLE
Consider the function has a slant asymptote. To find this, we use division.
 Since this is a linear term with leading coefficient equal to 1, synthetic division can be used.

|
Set up the synthetic division. |

|
Perform the synthetic division. |
 This means that the equation of the slant asymptote is


 without the remainder term, which means the equation of the slant asymptote is
When the denominator doesn’t have the form  long division is used.
EXAMPLE
Consider the function


 which means the equation of the slant asymptopte is
  and
and
undefined could result in vertical asymptotes or holes in the graph of a rational function. You also learned that the horizontal, slant, and nonlinear asymptotes describe the end behavior of a rational function. The graph of a rational function has either a horizontal asymptote, a slant asymptote, or a nonlinear asymptote; it is not possible for it to have more than one of these types.
and
and
undefined could result in vertical asymptotes or holes in the graph of a rational function. You also learned that the horizontal, slant, and nonlinear asymptotes describe the end behavior of a rational function. The graph of a rational function has either a horizontal asymptote, a slant asymptote, or a nonlinear asymptote; it is not possible for it to have more than one of these types.
SOURCE: THIS TUTORIAL HAS BEEN ADAPTED FROM OPENSTAX "PRECALCULUS” BY JAY ABRAMSON. ACCESS FOR FREE AT OPENSTAX.ORG/DETAILS/BOOKS/PRECALCULUS-2E. LICENSE: CREATIVE COMMONS ATTRIBUTION 4.0 INTERNATIONAL.
A horizontal line  for which
  as
as  or
or 
The asymptote obtained when the degree of the numerator is more than one greater than the degree of the denominator. This means that the graph of a rational function approaches a nonlinear function (in our case, a polynomial function) as  and
and 
The asymptote obtained when the degree of the numerator is one greater than the degree of the denominator. This means that the graph of a rational function approaches a linear function as  and
and 
A vertical line  for which
  or
or  as
as 
