Table of Contents |
Before we get into the connection between areas and calculus, let’s get some practice finding areas of some shapes using basic geometric formulas.
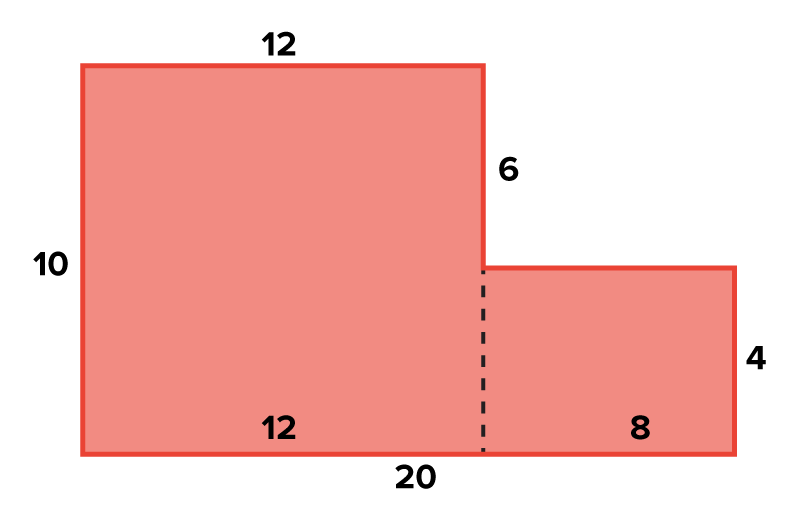
Consider the figure shown here.
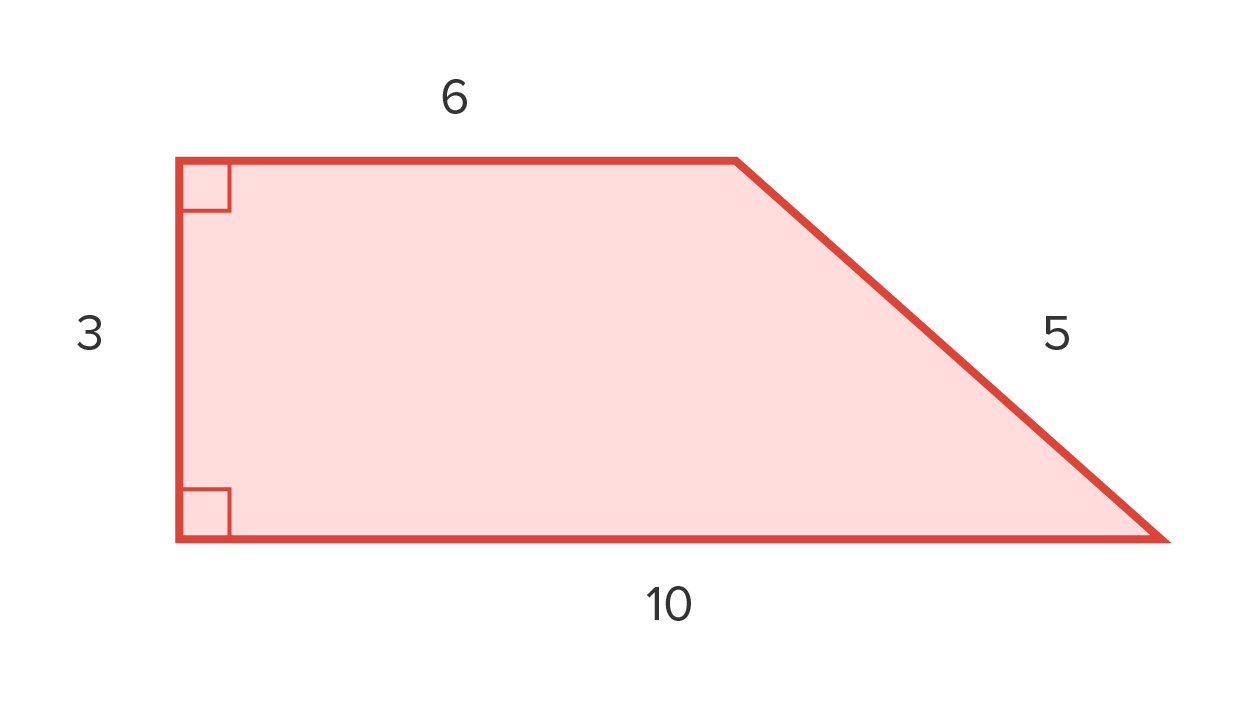
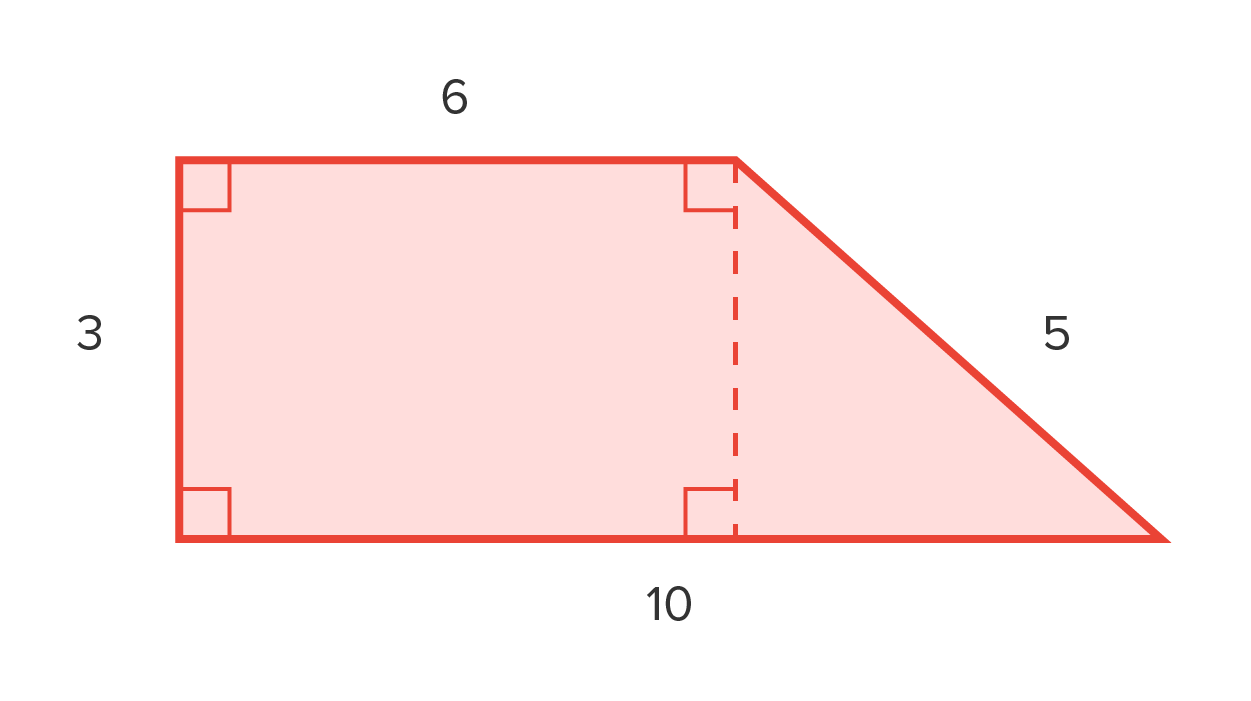
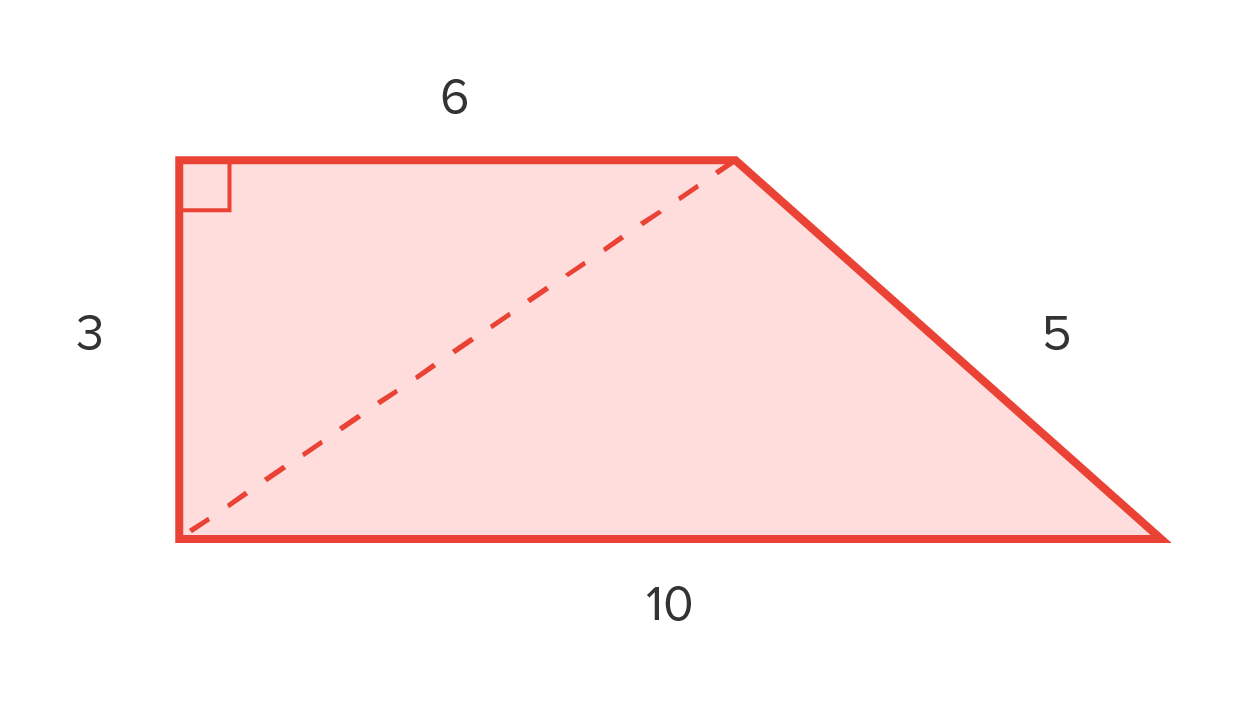
There are three ways to find the area.
 where h is the height and
  and
and  are the lengths of the parallel bases.


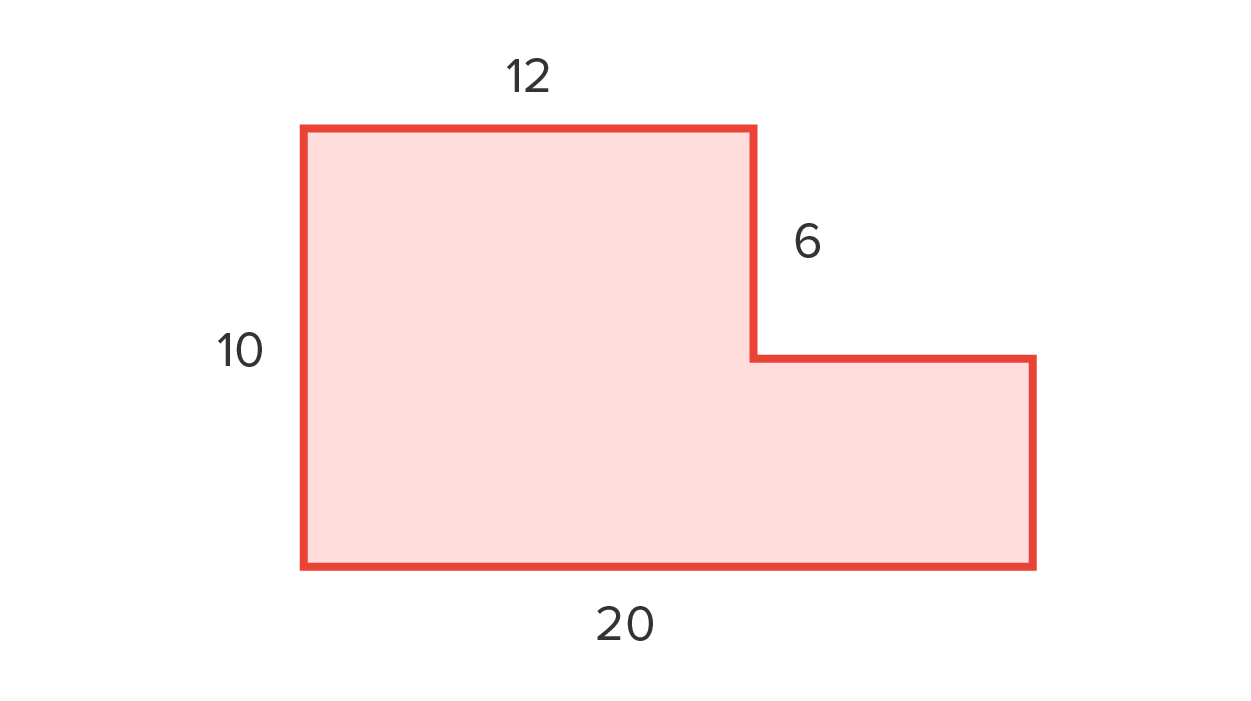


Let’s look at an example where there is a “hole” in the shape.
EXAMPLE
Find the area of the shape (represented by the shaded region), assuming each side is measured in inches.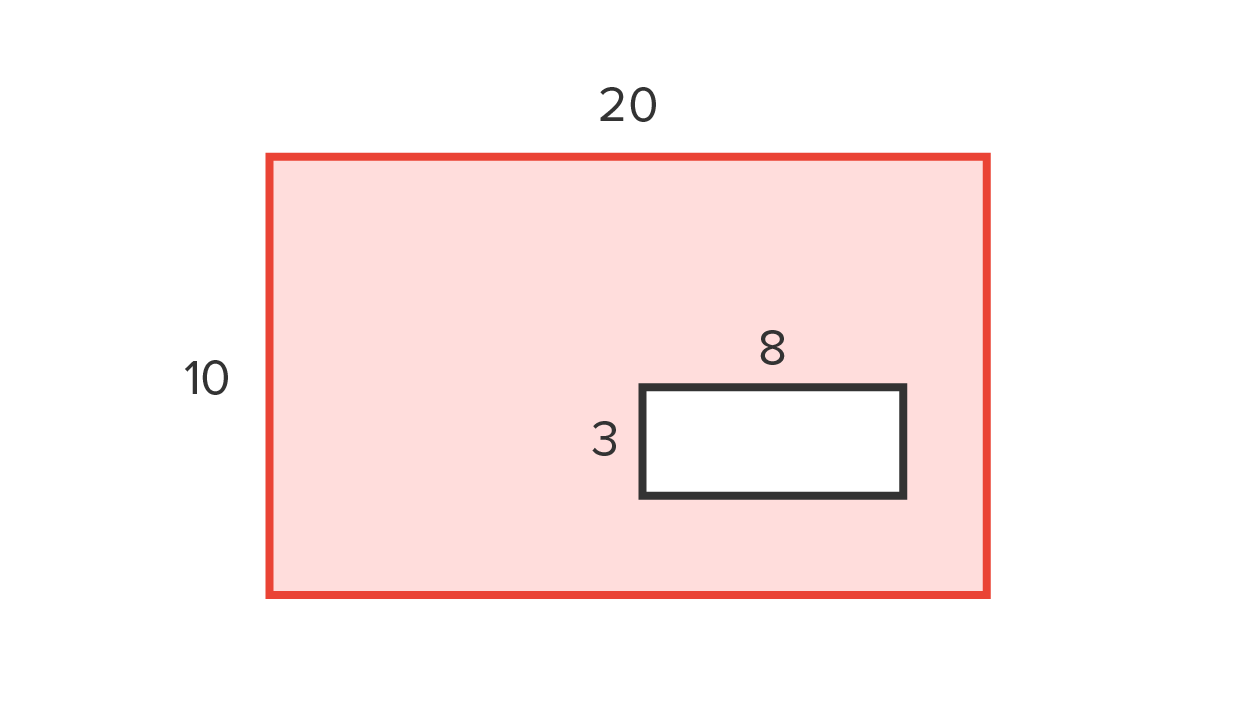
 The hole, also in the shape of a rectangle, has area
  Then, the area of the shape is the difference between the areas:
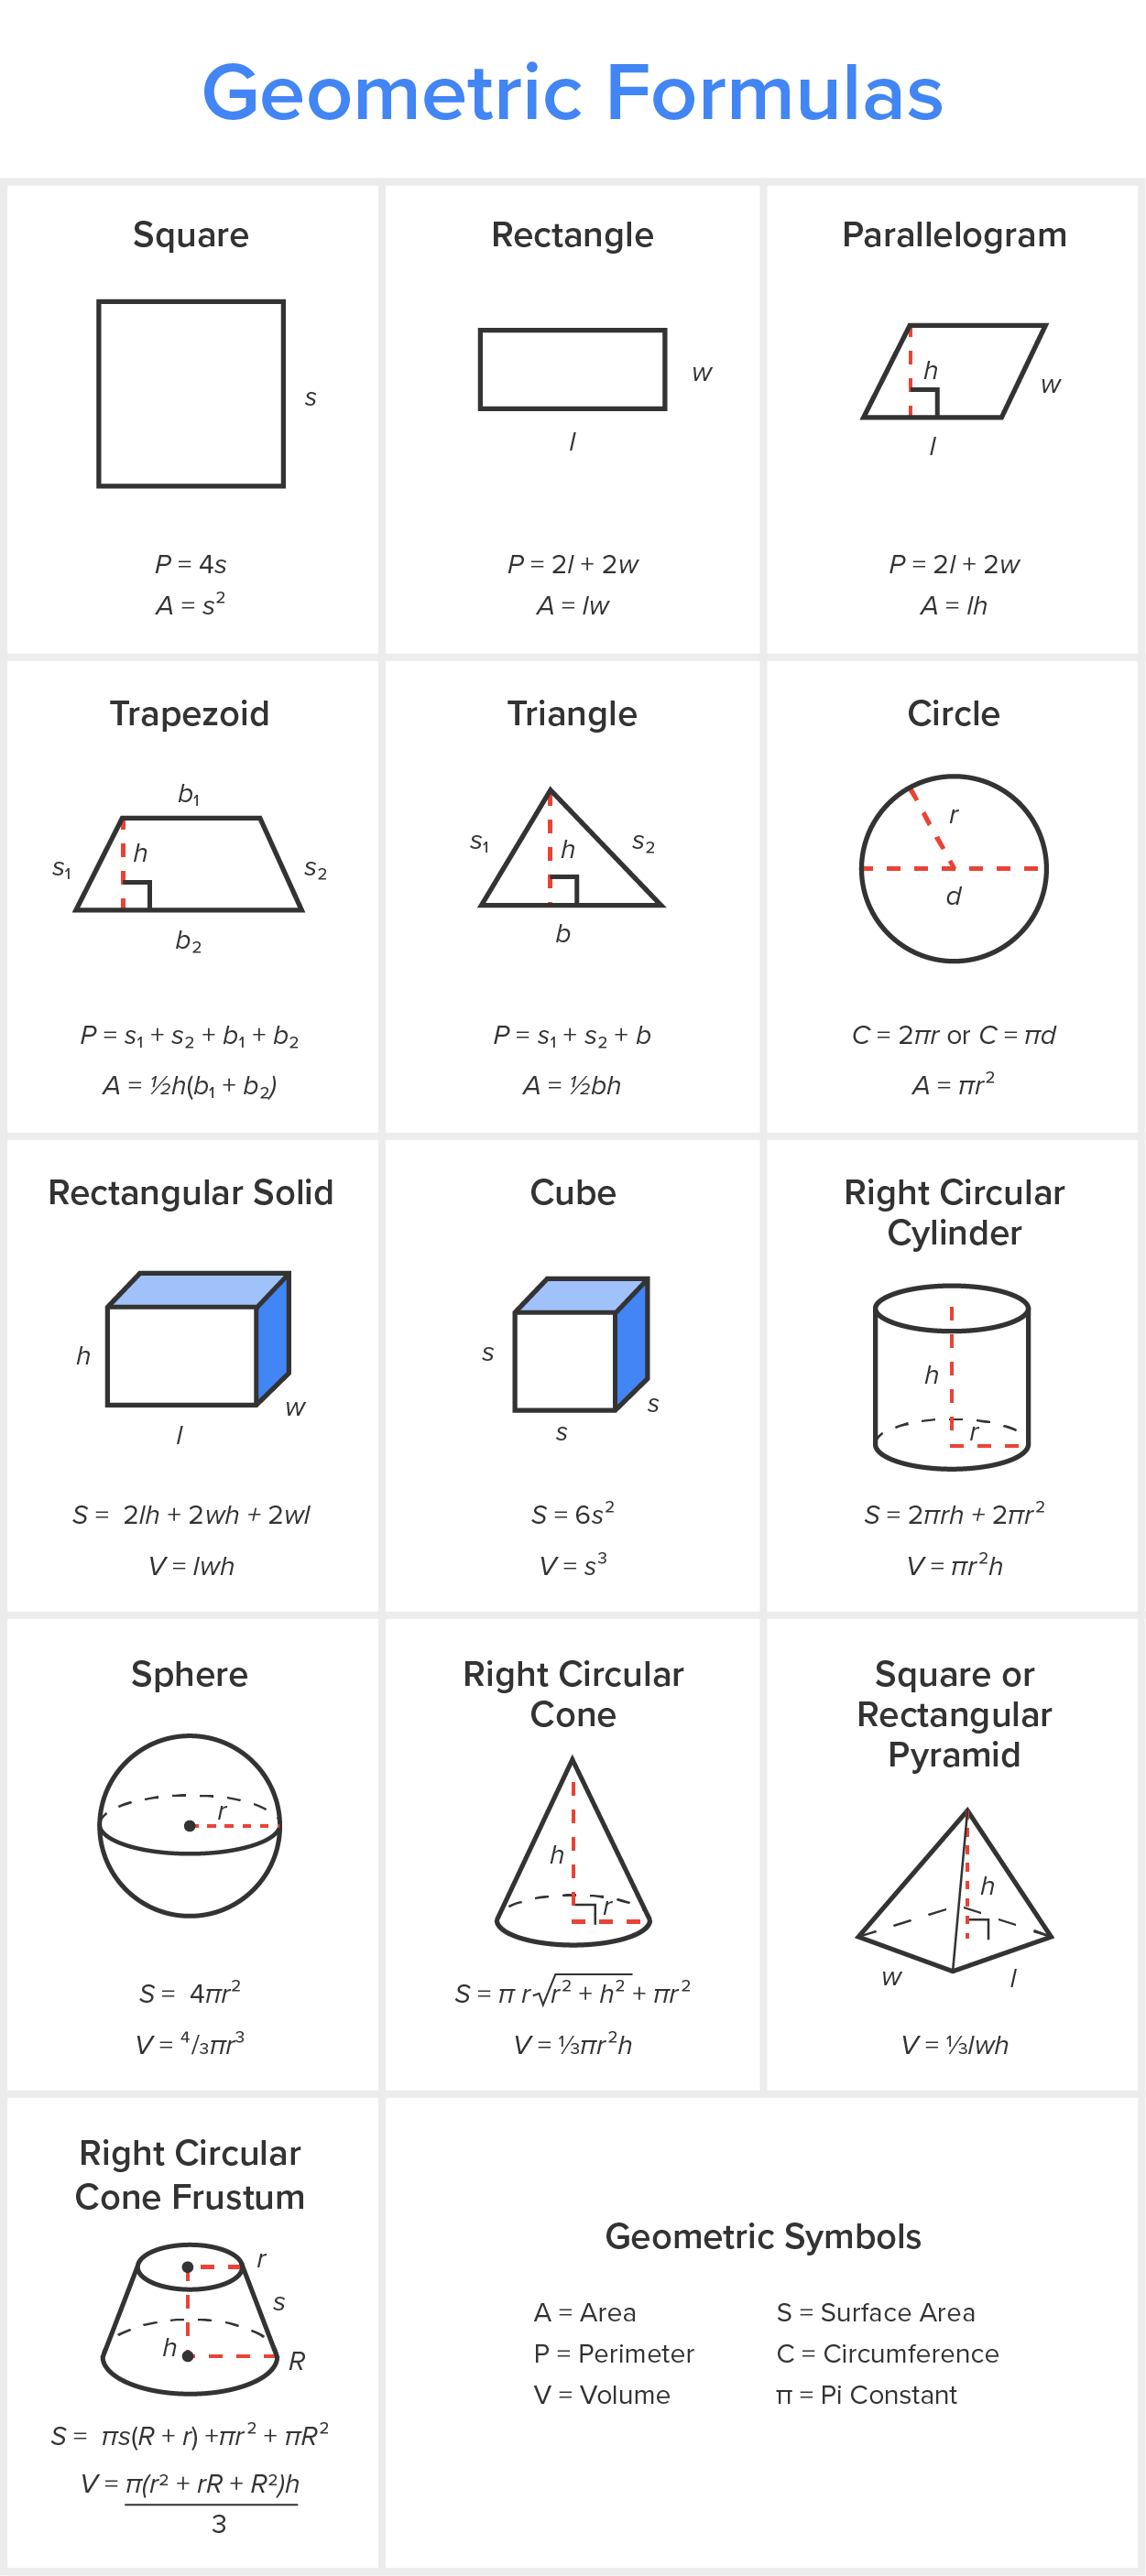
We can also find areas when certain graphs are used, since they are familiar shapes. Before diving in, here is a summary of equations that, when graphed, could form areas we know from formulas:
| Forms | Equation |
|---|---|
| Horizontal line |

|
| Slanted line |

|
| Circle with radius r |

|
| Semicircle with radius r |

|
EXAMPLE
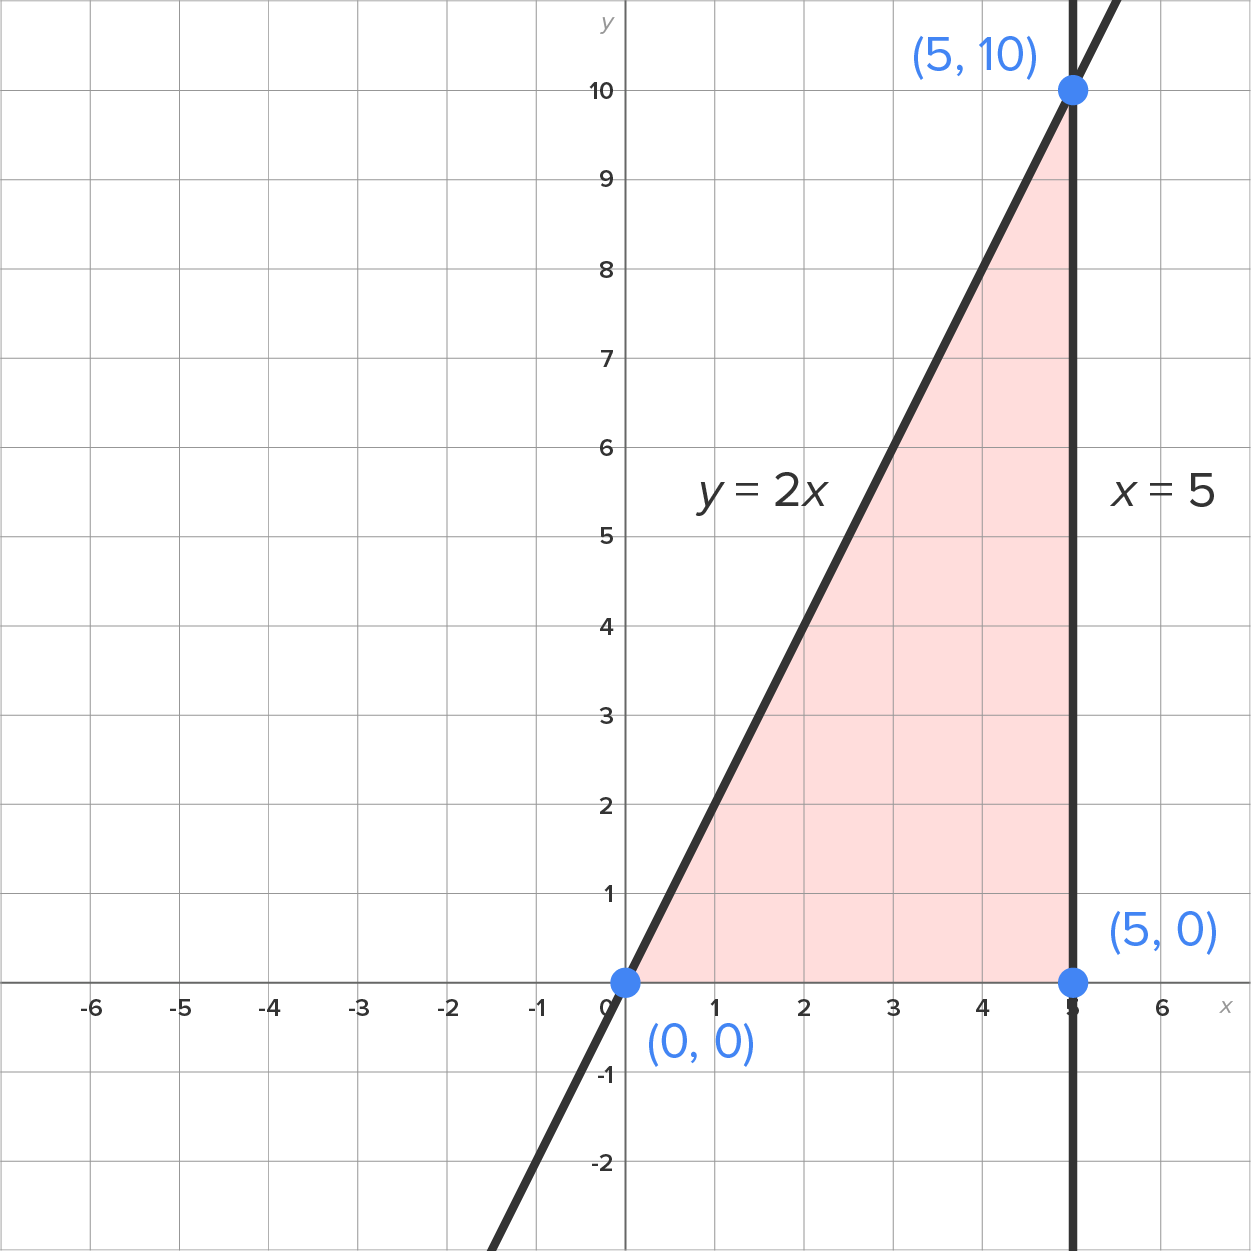
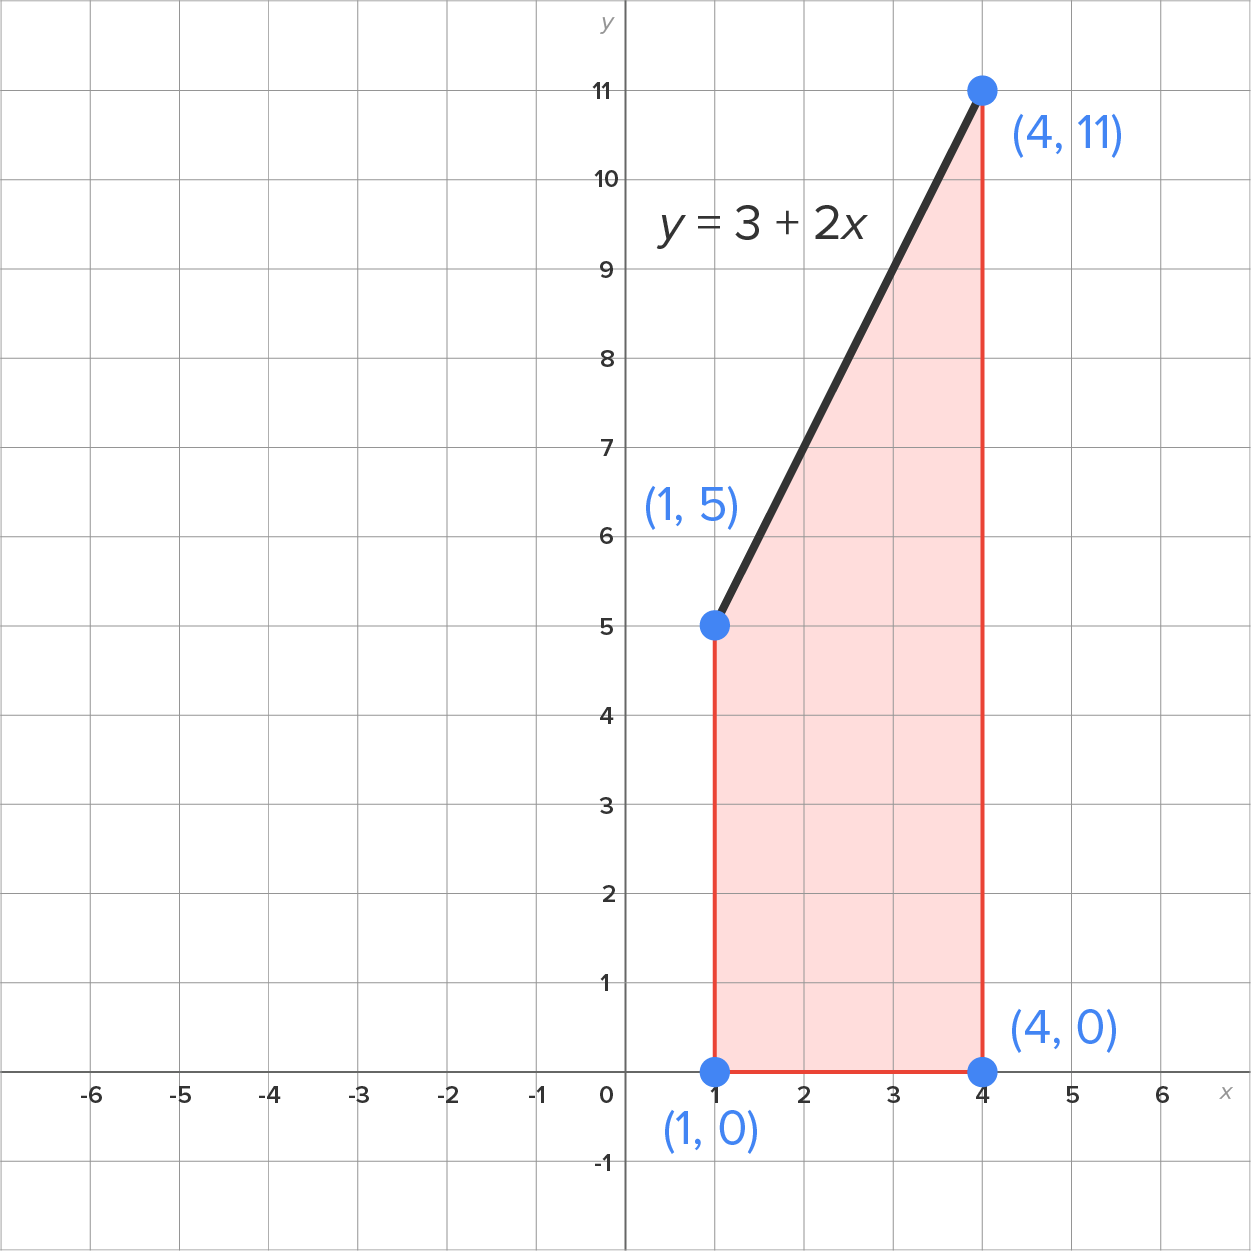
Find the area of the region bounded by the x-axis, the line , and the line
  . The graph of the region is shown in the figure below.

EXAMPLE
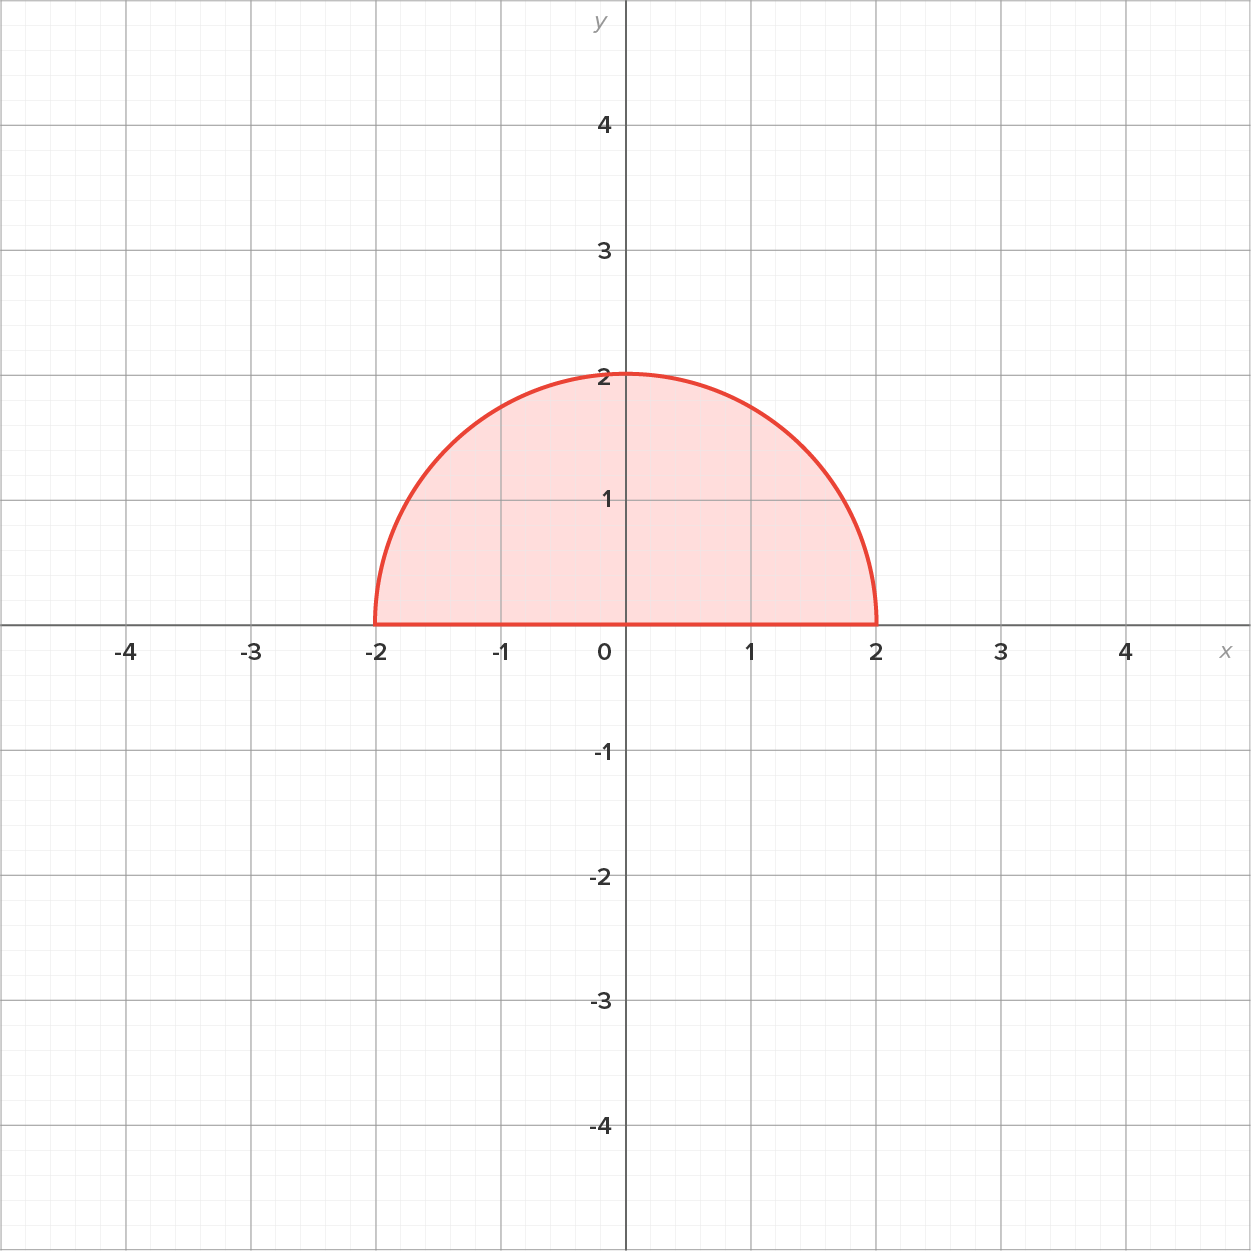
The figure below shows the graph of the region between and the x-axis. What is the area of this region?


There are some regions, particularly those which come from a graph, which cannot be found using formulas.
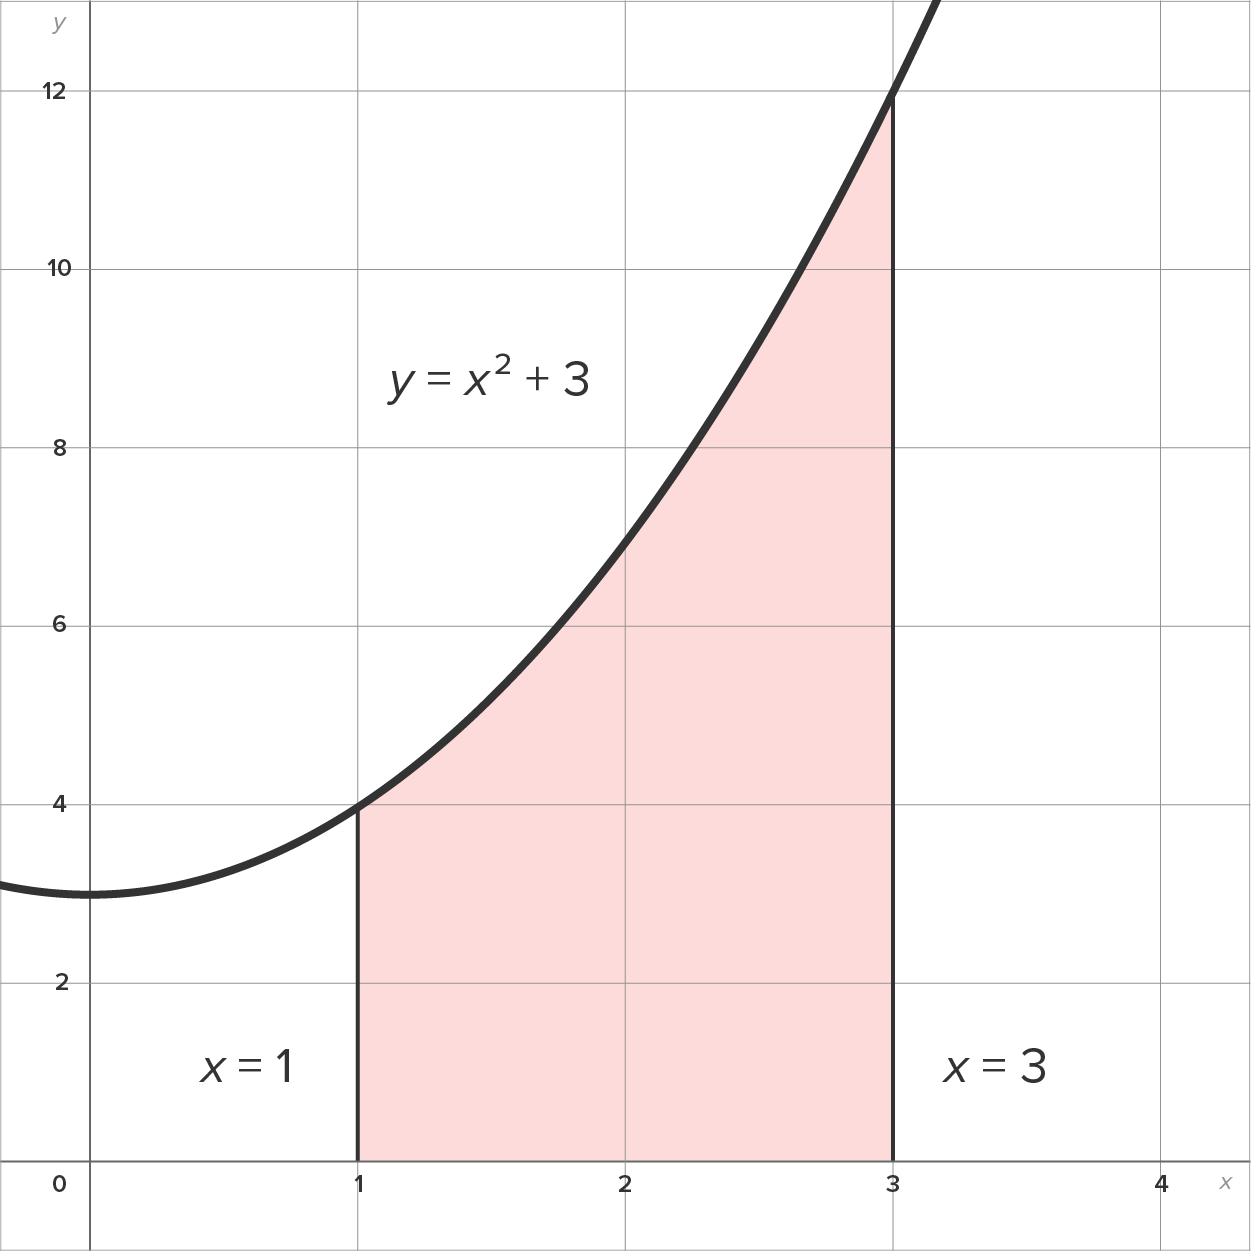
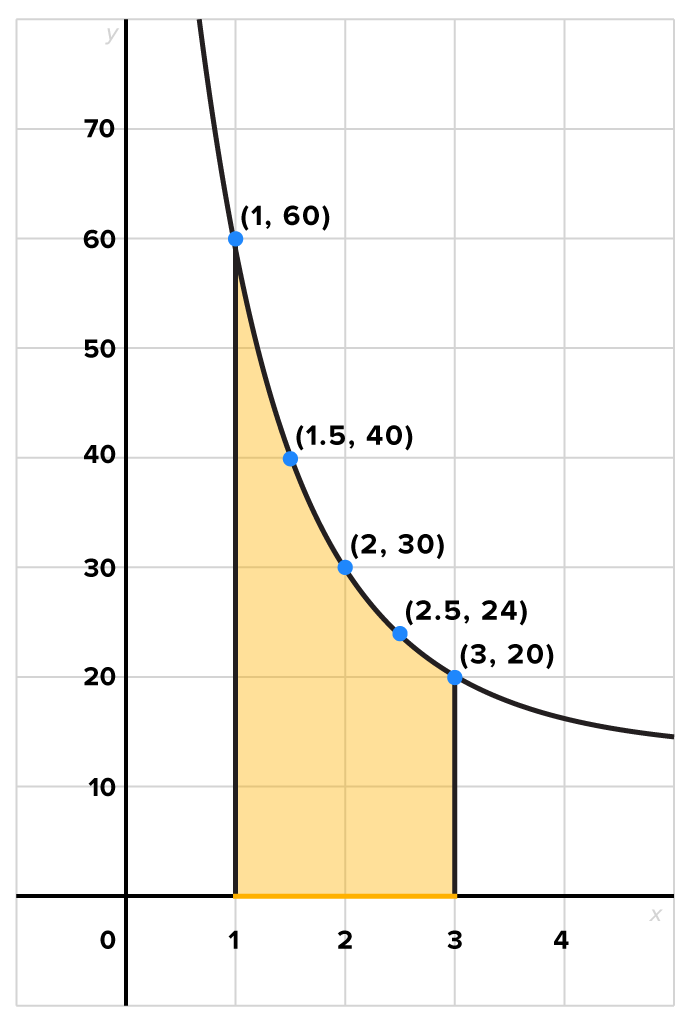
For example, consider the region bounded by the graphs of  , the x-axis, x = 1, and x = 3. The region is shown below.
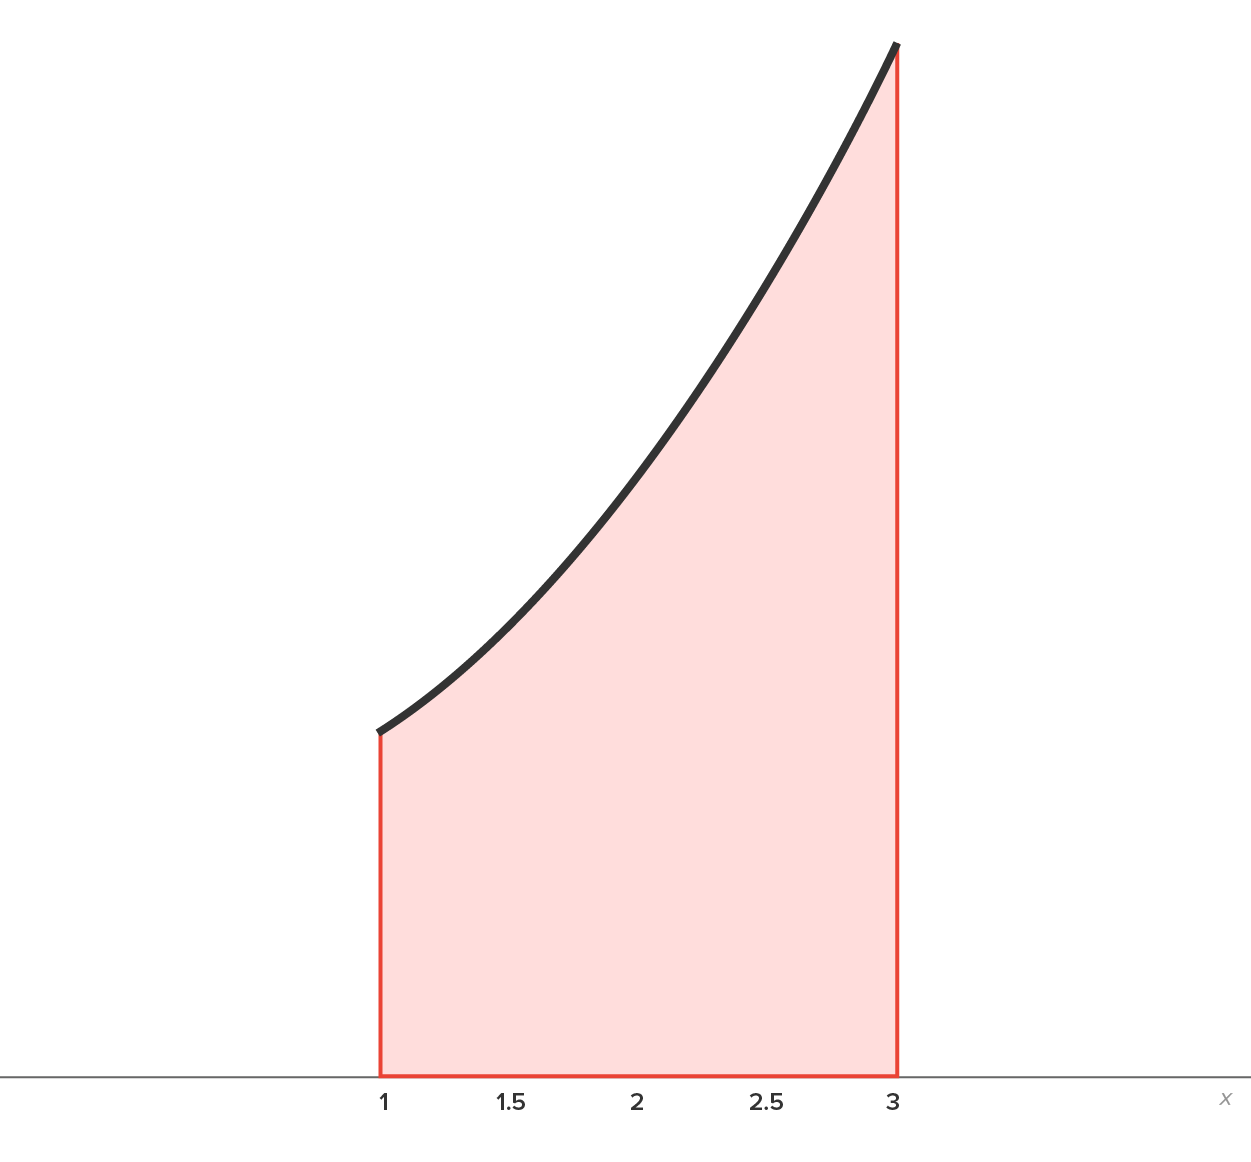
A major focus of integral calculus is being able to find areas of regions like this. For now, we need to come up with a way to estimate the area.
The most convenient way is to use rectangles whose bases are along the x-axis. This is illustrated in the next few examples.
EXAMPLE
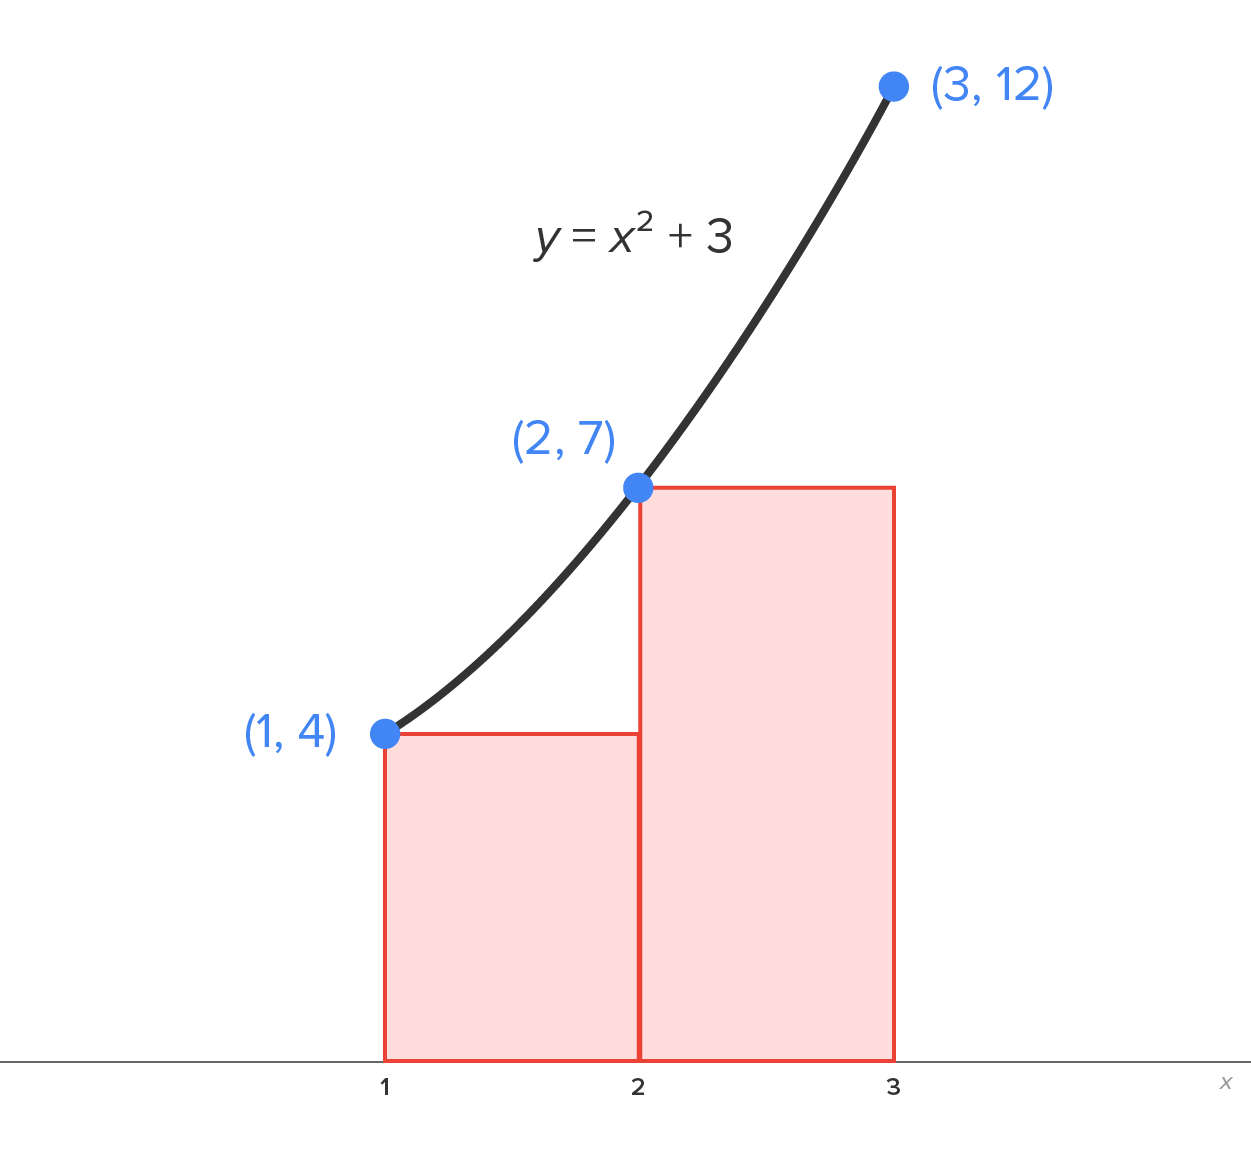
Approximate the area of the region bounded by, the x-axis, x = 1, and x = 3, as shown in the graph below:
| Graph | Description |
|---|---|
|
The rectangles used here are inscribed, meaning the largest possible rectangle drawn within the region. Notice how one corner of each rectangle is also on the curve.
 We know this is an underestimate of the actual area since the rectangles are inscribed. We know this is an underestimate of the actual area since the rectangles are inscribed.
|
|
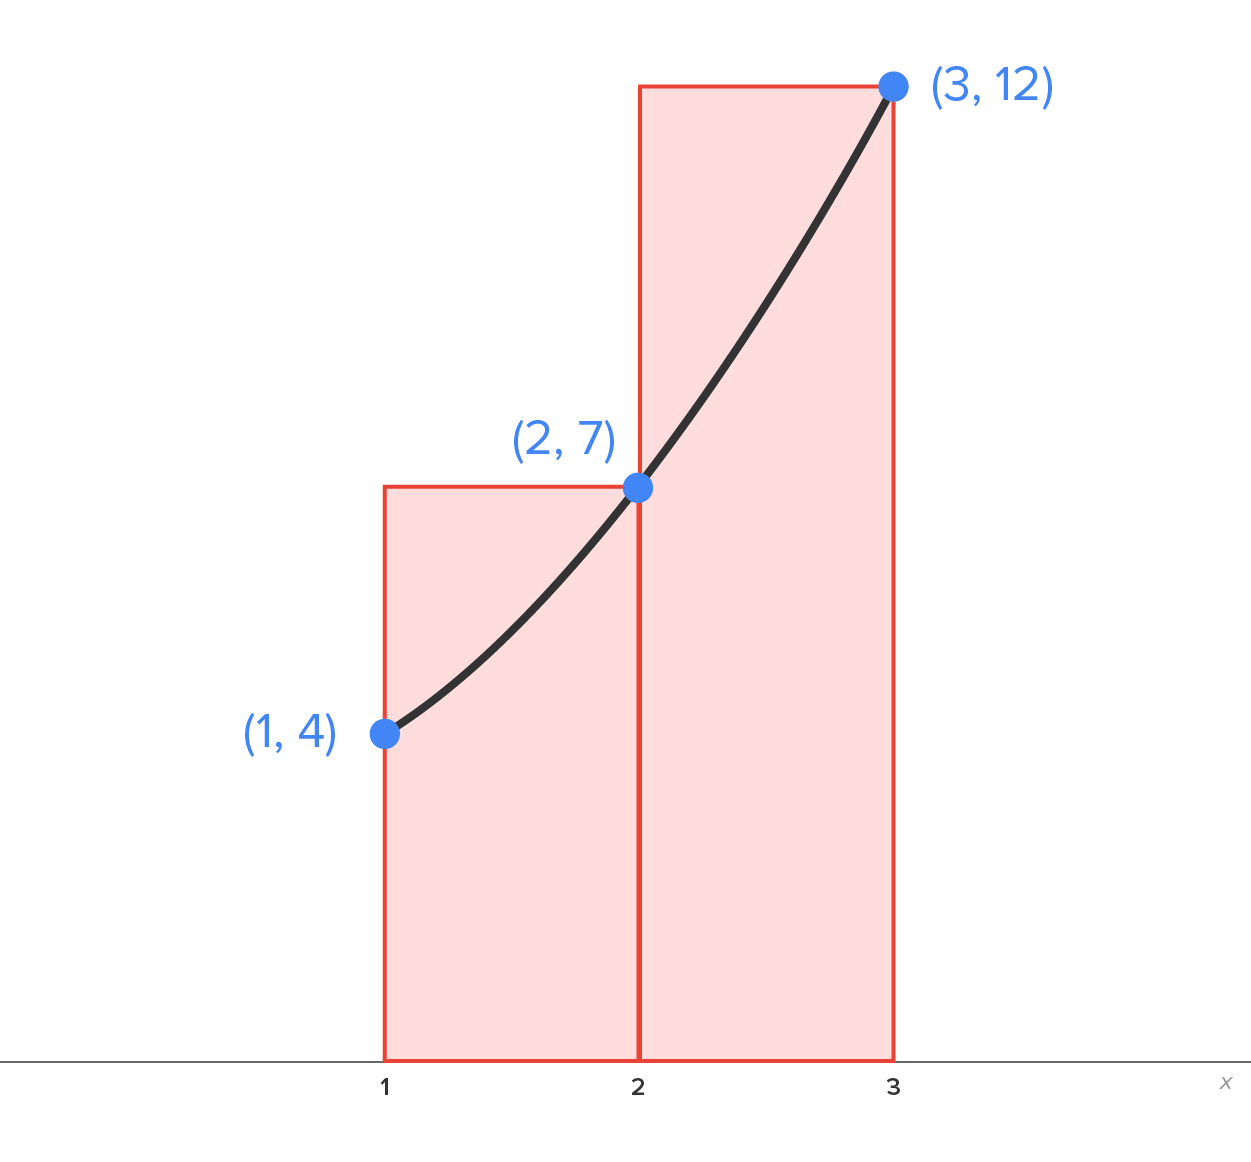
The rectangles used here are circumscribed, meaning drawn in such a way that the rectangle completely encloses the region, but is as small as possible. Notice how one corner of each rectangle is also on the curve.
 We know this is an overestimate of the actual area since the rectangles are circumscribed. We know this is an overestimate of the actual area since the rectangles are circumscribed.
|

 , the x-axis,
  , and
, and  by finding the combined area of the rectangles, as shown in each figure. Then, find the average of the estimates.
| Figure 1 | Figure 2 |
|---|---|
|
|
Here is a final example that uses more rectangles.
EXAMPLE
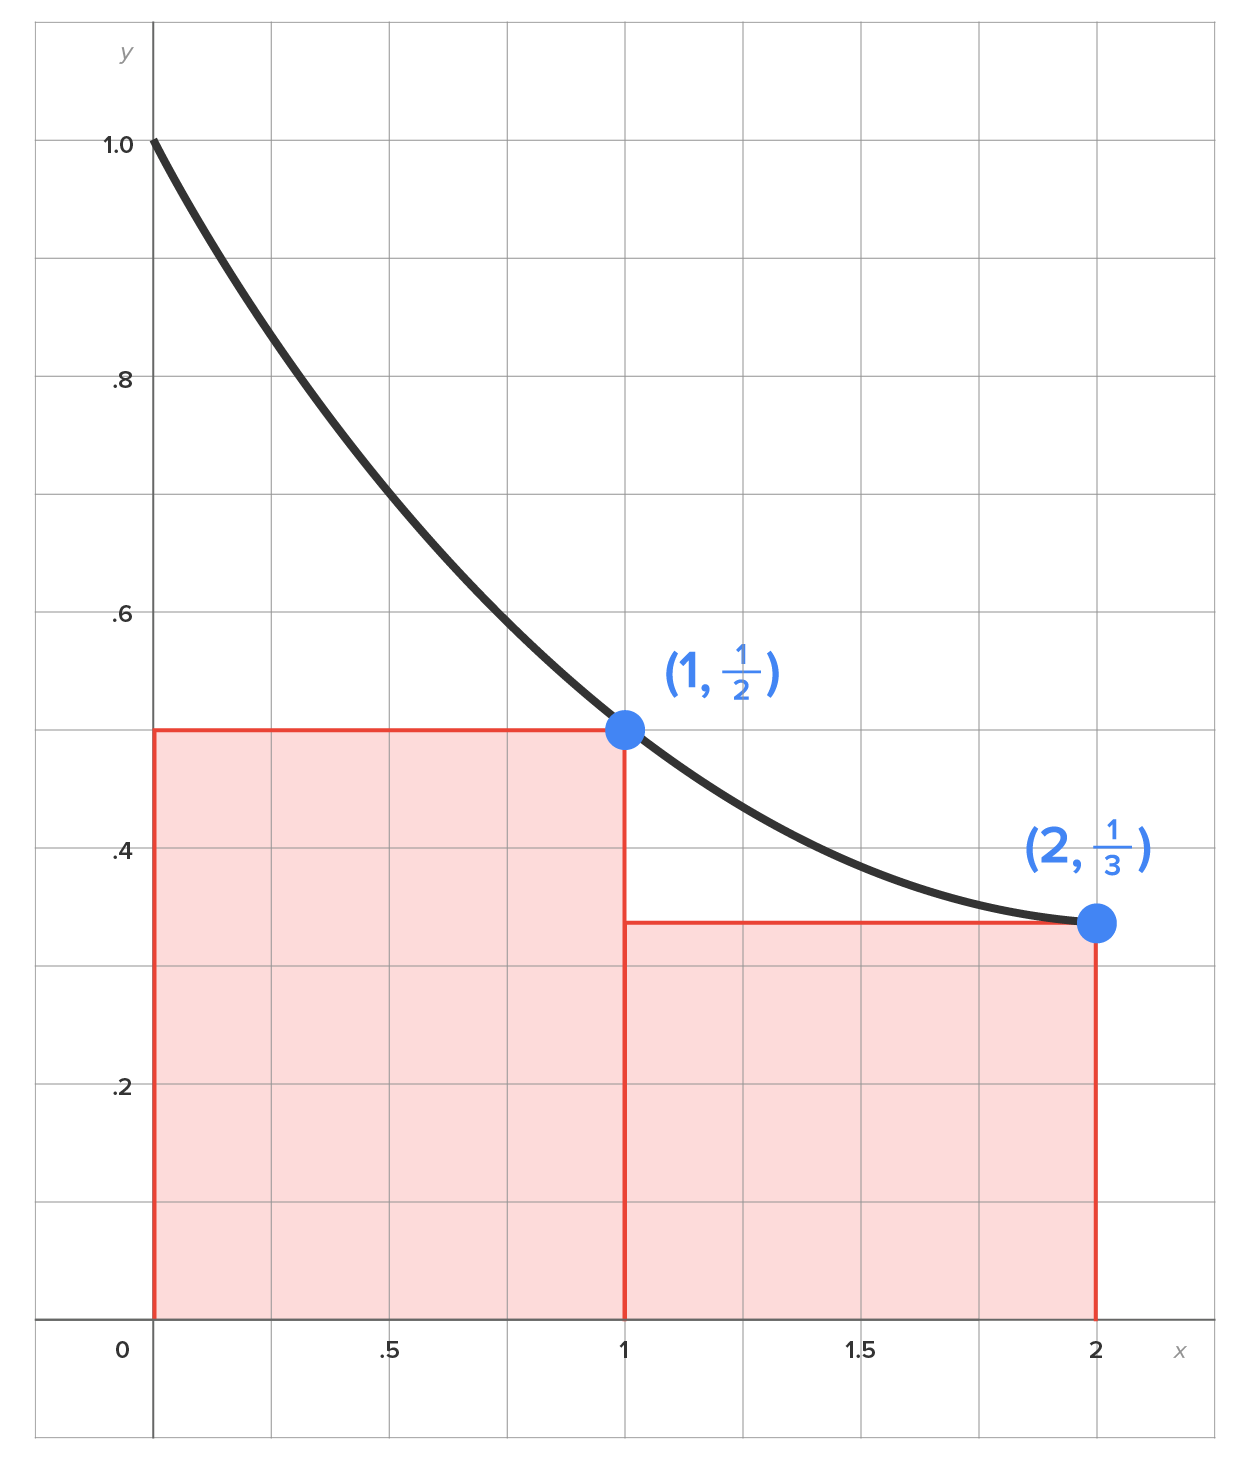
Suppose we wish to estimate the area between the x-axis and the graph of on the interval
  The graph of the region is shown below.
| Graph | Description |
|---|---|
|
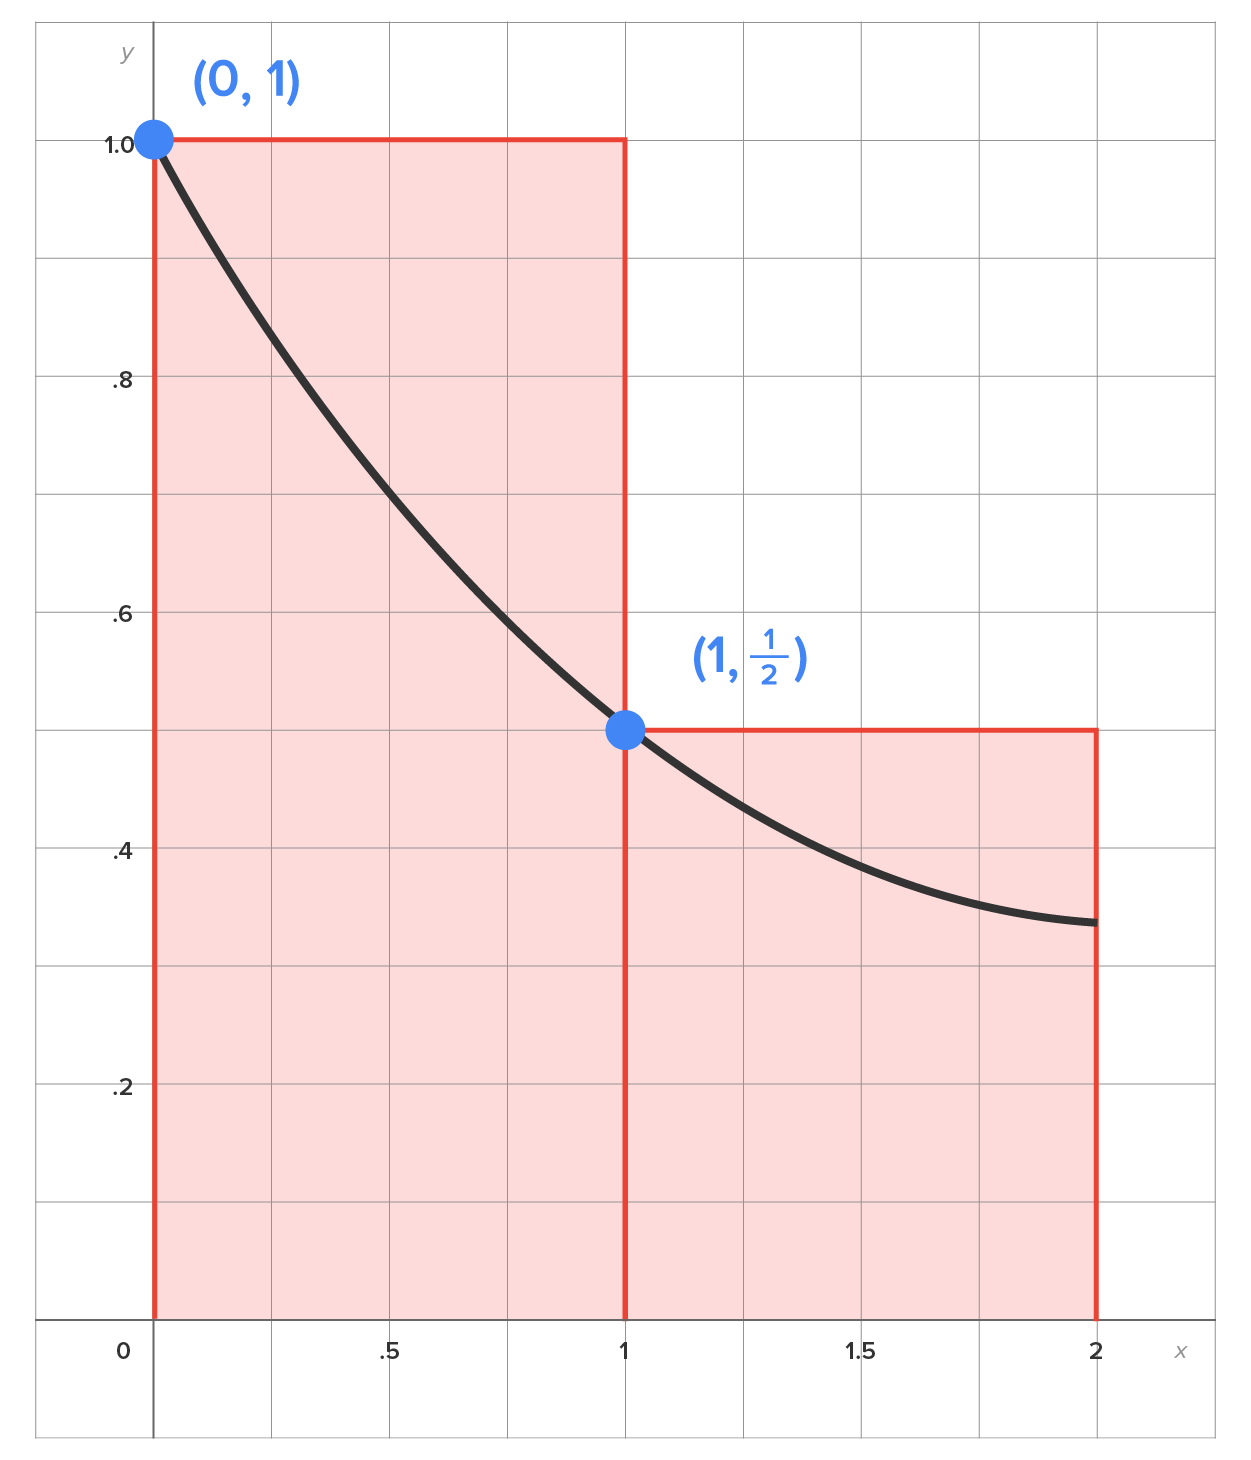
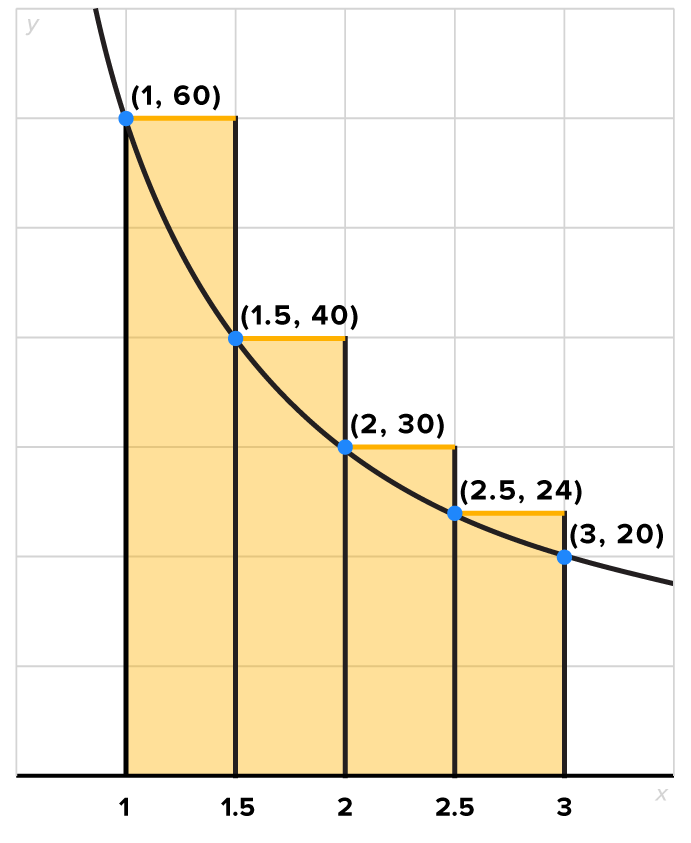
The rectangles used here are circumscribed, meaning that the rectangle encloses the region, but is the smallest rectangle possible. Notice how one corner of each rectangle is also on the curve.
Note that each rectangle is ½ unit wide. Going from left to right, find the area of each rectangle:
 We know this is an overestimate of the actual area since the rectangles encompass the region and have additional area. We know this is an overestimate of the actual area since the rectangles encompass the region and have additional area.
|
|
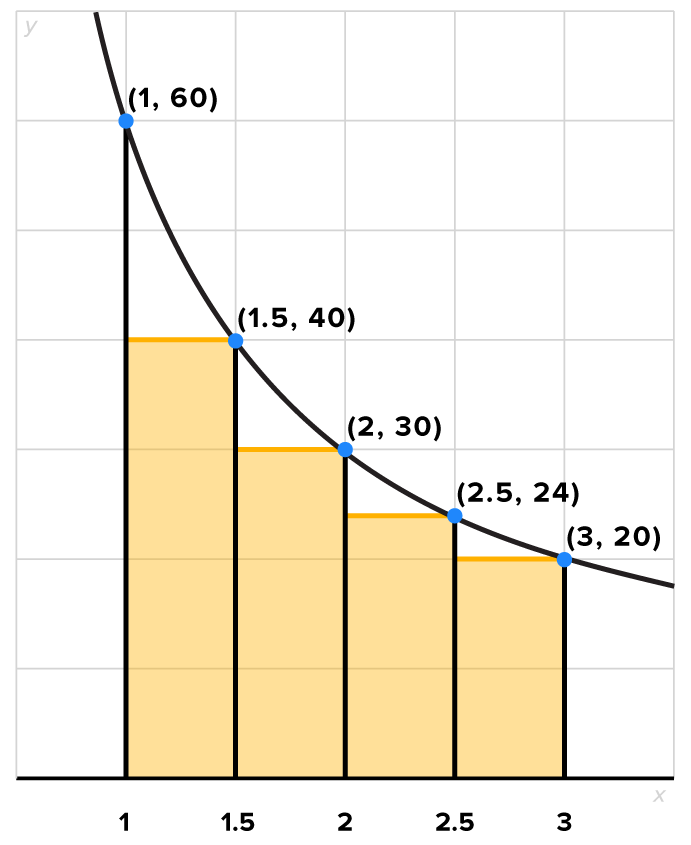
The rectangles used here are inscribed, meaning that the rectangle is within the region, but is the largest rectangle possible. Notice how one corner of each rectangle is also on the curve.
Note that each rectangle is ½ unit wide. Going from left to right, find the area of each rectangle:
 We know this is an underestimate of the actual area since the rectangles are all within the region. We know this is an underestimate of the actual area since the rectangles are all within the region.
|


Source: THIS TUTORIAL HAS BEEN ADAPTED FROM CHAPTER 4 OF "CONTEMPORARY CALCULUS" BY DALE HOFFMAN. ACCESS FOR FREE AT WWW.CONTEMPORARYCALCULUS.COM. LICENSE: CREATIVE COMMONS ATTRIBUTION 3.0 UNITED STATES.


