Table of Contents |
In many cases, small amounts of DNA are available, and it is helpful or essential to have much larger amounts for analysis. Prior to using other techniques, DNA samples are often amplified (in other words, many copies of the DNA samples are produced).
The polymerase chain reaction (PCR) is especially important because it revolutionized molecular genetics by making it possible to create huge quantities of DNA for analysis without relying on cells to copy the DNA. PCR makes it possible to rapidly produce large quantities of DNA from relatively small and impure samples.
The image and steps below summarize how PCR works. The process is now carried out by automated thermocyclers. Samples can be added, and the thermocycler is set to cycle through specific temperature changes a certain number of times.
Note that primers are needed, as in standard DNA replication. These primers bind to single-stranded DNA and determine where DNA polymerase will begin to add bases on each strand. Therefore, primers need to be chosen carefully to amplify the correct region of DNA. This differs from natural DNA replication, in which the entire molecule is replicated.
The image shows the events during three cycles out of the 25 to 40 total. It is possible to see how the primers anneal, followed by the addition of nucleotides. As the number of cycles increases, the number of copies of the target sequence increases rapidly.

It is important to note that advances in PCR are continuing to occur and the process may become easier and less reliant (or no longer reliant) on thermocyclers.
Additionally, variations of PCR add to its utility. Reverse transcriptase PCR (RT-PCR) is used to obtain DNA copies of mRNA molecules. Real-time PCR, also known as quantitative PCR (qPCR) uses fluorescence to monitor the increase in a double-stranded template during a PCR as it occurs. This produces kinetics data that can be used to quantify the amount of the original target sequence.
DNA produced by PCR or obtained from other sources can be sequenced using DNA sequencing techniques. This lesson will first introduce the basic chain termination method (dideoxy method or Sanger sequencing method) developed in 1972 and then discuss some of the newer approaches that are making sequencing more readily available for a wide range of uses.
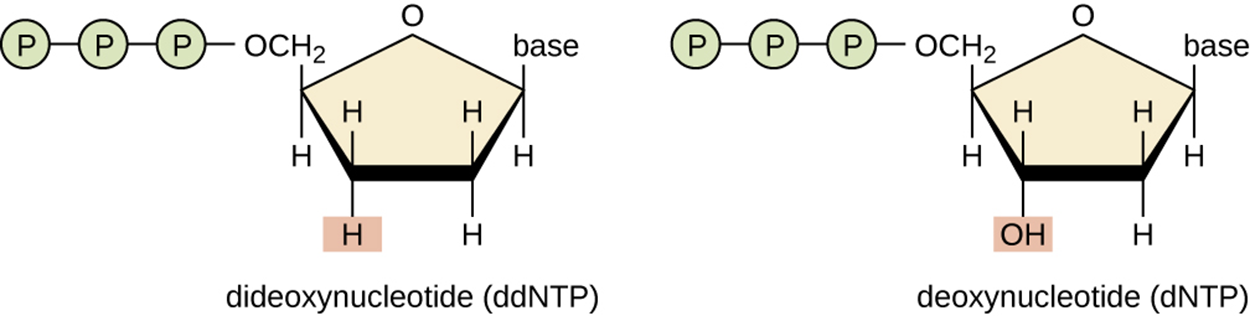
The chain termination method involves DNA replication of a single-stranded template with the use of DNA primer to initiate synthesis of a complementary strand, DNA polymerase, a mix of the four regular deoxynucleotide (dNTP) monomers, and a small proportion of dideoxynucleotides (ddNTPs). The ddNTPs are labeled with some type of molecular beacon for easy visualization and are monomers that are lacking the hydroxyl group necessary for another nucleotide to be added. Therefore, the addition of a ddNTP terminates chain elongation.
Every time a ddNTP is added during replication, the process stops. This occurs randomly, producing a range of newly replicated DNA strands of different sizes. Each strand has a labeled ddNTP at one end, allowing the identity of the terminal nucleotide to be determined. When the samples are run on a gel, they are separated by length and the nucleotides can be ordered based on their position on the gel.
In the original procedure, four separate reactions were used for each DNA molecule being sequenced. Each reaction had a different ddNTP (one for adenine, one for thymine, one for cytosine, and one for guanine). Each ddNTP was labeled with a radioactive phosphorus molecule. The products of the four reactions were placed in different lanes on a long, narrow, polyacrylamide gel (similar to an agarose gel). Electrophoresis produced bands of varying lengths in each lane that could be detected using autoradiography.
In more recent approaches, ddNTPs are labeled using fluorescent dyes and are placed in a single sequencing reaction. The fluorochromes are detected using fluorescence spectroscopy that detects each color and produces an output showing the sequence.
The image below shows the difference between a ddNTP and a dNTP. The lower left vertex of the ddNTP sugar ring, shown on the left, has an H at the same position where the dNTP on the right has an OH. DNA polymerase requires the OH to add the next nucleotide, so having an H in that position prevents the addition of another nucleotide and chain elongation terminates.
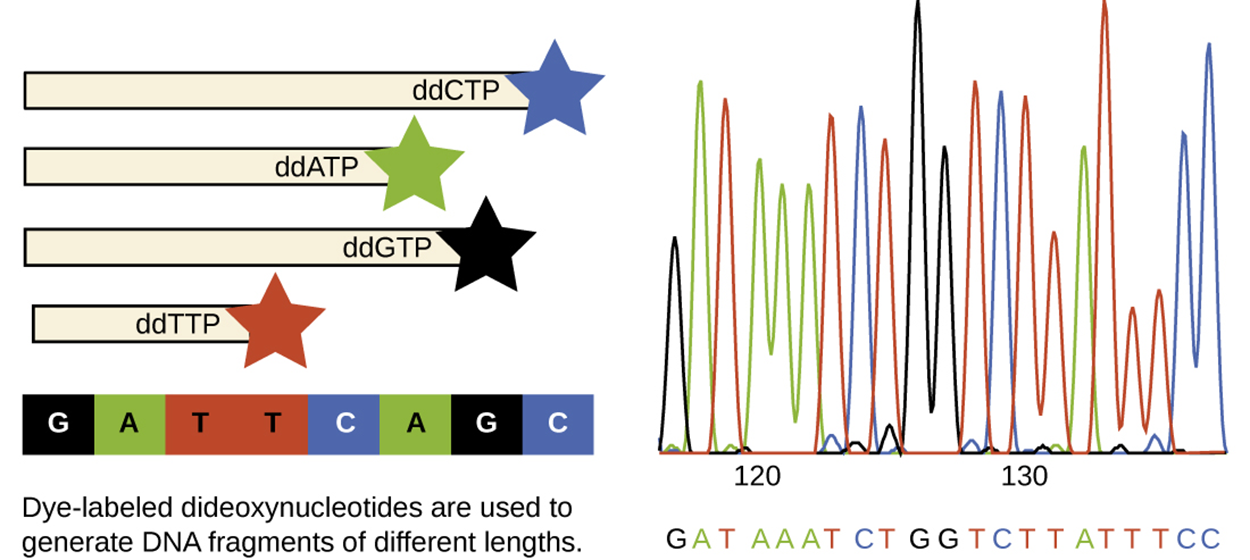
The image below shows the dideoxy chain termination method using ddNTPs tagged with fluorochromes. The end of each strand shows a different color corresponding to the nucleotide present. This is used to produce a graph that shows the nucleotide sequence as shown.
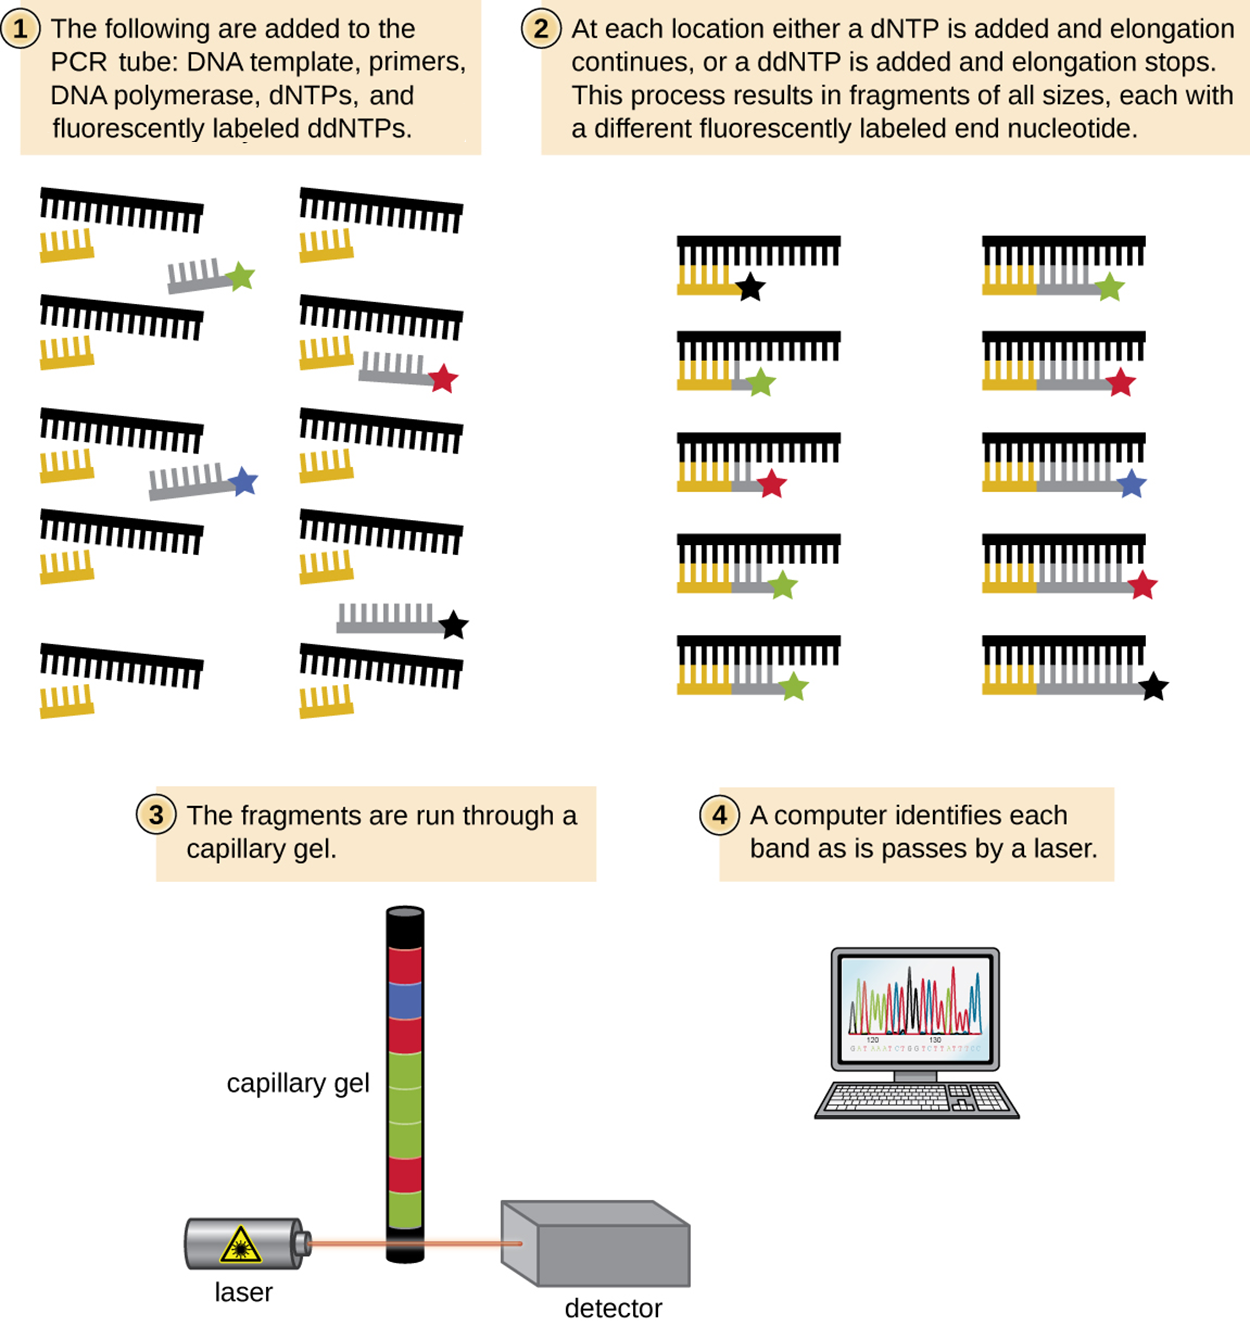
The image below shows the process in more detail. In step 1, it shows the components added to the PCR tube: the DNA template, primers, DNA polymerase, dNTPs, and fluorescently labeled ddNTPs. In step 2, it shows how complementary strands begin to grow but stop at fluorescently labeled ddNTPs. In step 3, it shows the fragments in a capillary gel. A laser passing through the gel to a detector determines the sequence for identification and visualization on a computer, as shown in step 4.
Since 2005, automated sequence techniques used by laboratories fall under the umbrella of next-generation sequencing, which is a group of automated techniques used for rapid DNA sequencing. These methods have revolutionized the field of molecular genetics because the low-cost sequencers can generate huge quantities of short fragments in a day. There are multiple devices available from different manufacturers and they have evolved to become even more effective over time. This is why sequencing is so much more accessible at present than it has ever been in the past.
Additionally, vast amounts of biological data produced by these methods are readily available to researchers. For example, the National Center for Biotechnology Information houses a widely used genetic sequence database called GenBank. Researchers can deposit information in GenBank so that it is available for others to use.
As advances in DNA sequencing have progressed, new ways to sequence RNA have followed. An important example is RNA sequencing (RNA-Seq). This technique has progressed over the years, like other types of sequencing, and now can be performed by using RNA to produce cDNA that can be sequenced using next-generation sequencing approaches (Kukurba & Montgomery, 2010).
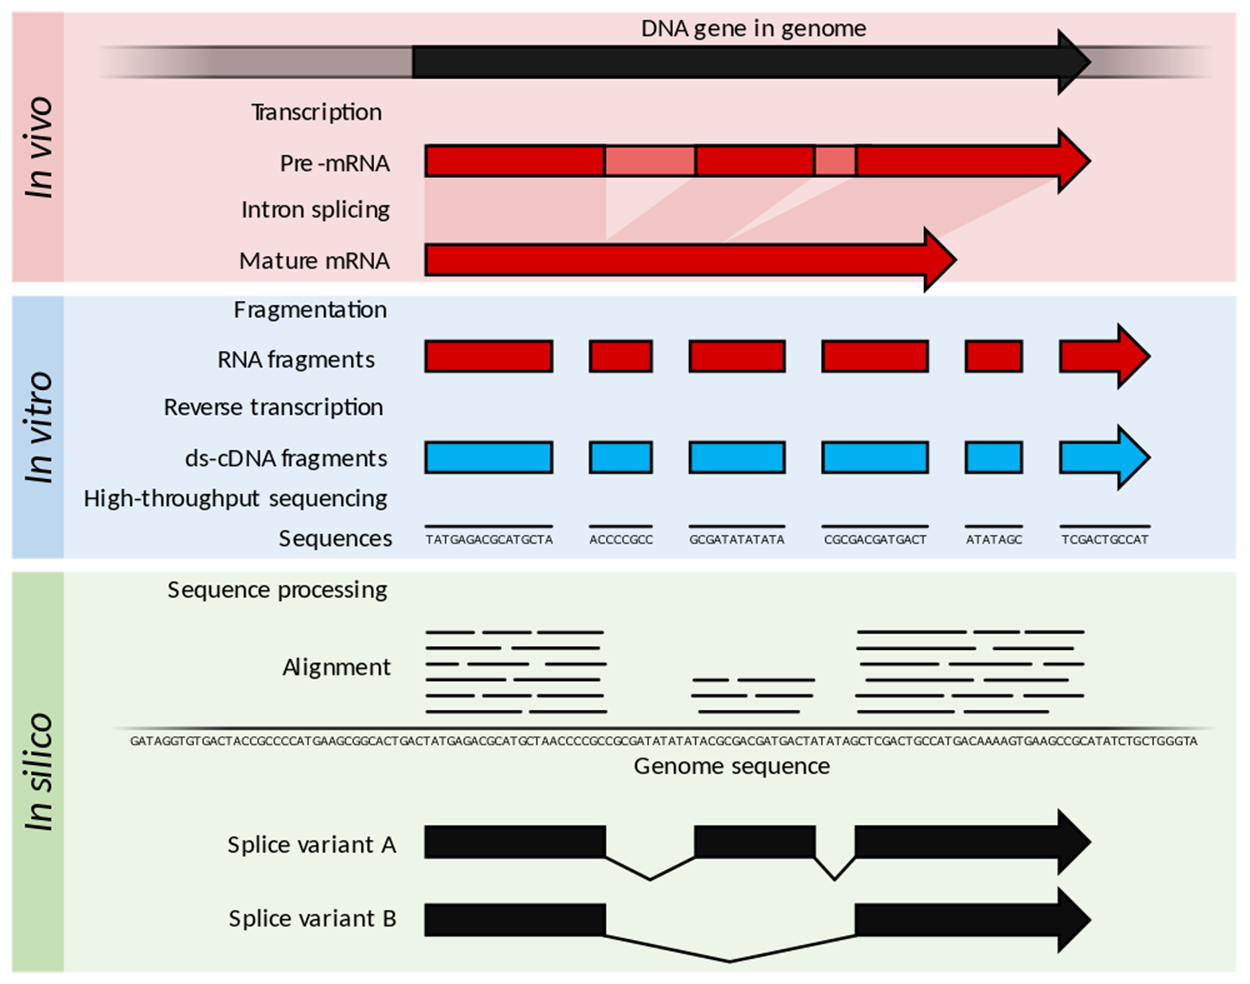
The image below illustrates some of the approaches used. For the purposes of this lesson, it is not necessary to know all of the techniques in detail. However, the image shows how RNA-Seq can be used in vitro (in the lab), in vivo (in living organisms), and in silico (using computers). For example, RNA in living organisms can be analyzed as pre-mRNA or as mature mRNA. In the lab, fragments of RNA can be analyzed, or reverse transcriptase can be used to produce cDNA for analysis. Computers can perform complex analyses to find matching sequences that indicate areas where fragments overlap, allowing them to assemble a larger molecule from fragments. These and other approaches can be accomplished using variations of RNA-Seq techniques.
Although this lesson has focused on nucleic acids, molecular analysis of proteins is also very valuable. Studying proteins can provide information about how they are actually used and distributed within a cell, as well as ways in which they change because of changes in environmental conditions or the presence of a pathogen.
Polyacrylamide gel electrophoresis (PAGE) uses a variation of gel electrophoresis to separate proteins. A polyacrylamide gel has a finer matrix than an agarose gel. Another important difference from the agarose electrophoresis techniques described above is that PAGE typically uses a vertical gel apparatus.
Because of varying charges associated with amino acid side chains, PAGE can be used to separate intact proteins based on their net charges because of the presence of the electrical field.
Alternatively, proteins can be denatured and coated with a negatively charged detergent called sodium dodecyl sulfate (SDS). SDS masks the native charges of the untreated proteins, meaning that size alone determines how far proteins move across the gel. As with nucleic acids, smaller fragments move more rapidly and therefore travel farther on the gel within a certain timeframe.
PAGE can be further modified to separate proteins based on two characteristics. This is called two-dimensional PAGE. For example, proteins may be separated based on charge at varying pH as well as size.
After separation on a gel, proteins are visualized through staining. Coomassie blue and silver stains are commonly used.
The image below illustrates SDS-PAGE. Part (a) shows how a protein with varied charges can be treated with SDS, denaturing it (changing its shape) and coating it with a uniform negative charge to replace the varied charges of the original protein. In part (b), a vertical gel is shown. Protein samples are added to the wells at the top. A molecular weight standard is added to one well for comparison. An electrical current is applied, causing the proteins to move. Because smaller proteins move faster than larger proteins, the proteins separate by size. Each fragment can be compared with the molecular weight standard to estimate its size. Part (c) shows an example of an SDS-PAGE gel stained with Coomassie blue.

Source: THIS TUTORIAL HAS BEEN ADAPTED FROM OPENSTAX "MICROBIOLOGY." ACCESS FOR FREE AT openstax.org/details/books/microbiology. LICENSE: CC ATTRIBUTION 4.0 INTERNATIONAL. Accessed by August 2022.
REFERENCES
Kukurba, K. R., & Montgomery, S. B. (2015). RNA Sequencing and Analysis. Cold Spring Harbor protocols, 2015(11), 951–969. doi.org/10.1101/pdb.top084970