Table of Contents |
Recall that  means “the absolute value of x”, which represents the distance that a number x is from 0 (on the number line).
Consider the number line shown below, with the numbers 3 and -6 marked.
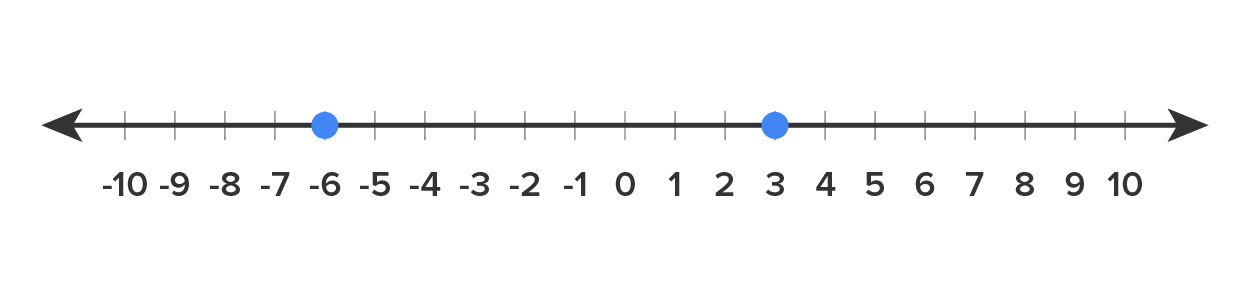
Since the number 3 is a distance of 3 units from 0, we say that 
Since the number -6 is a distance of 6 units from 0, we say that 
In general, evaluating requires two different rules, depending on what x is.
and x are the same. is the opposite of x (turning a negative into a positive).

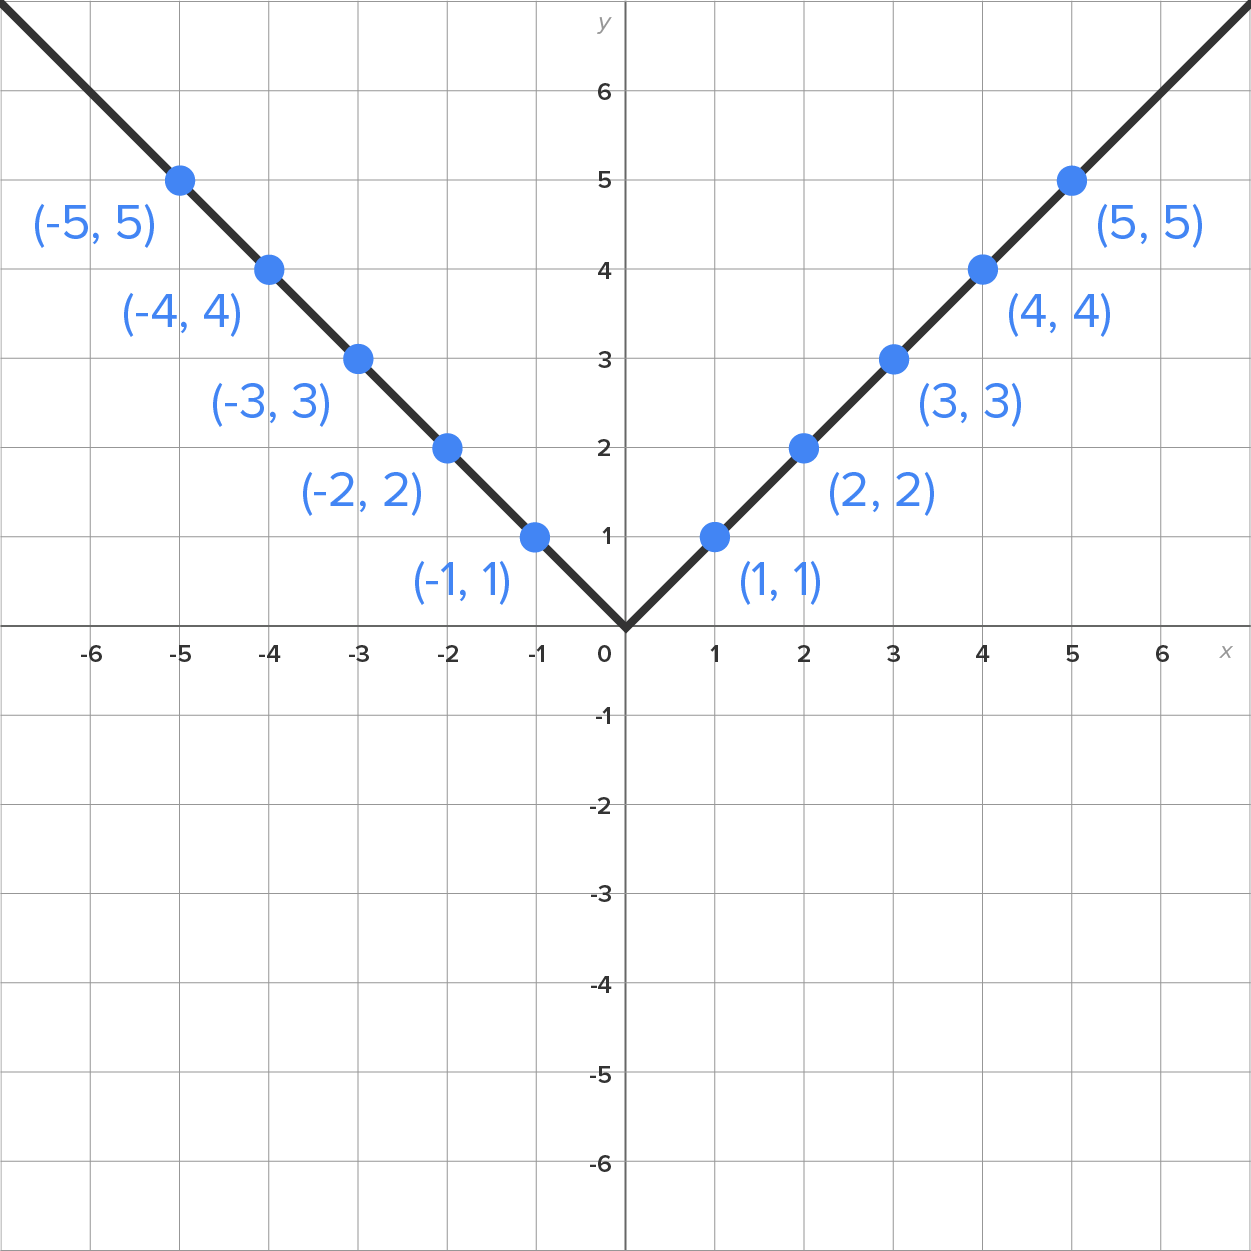
In the table below, you see several input-output pairs for 

|
-5 | -4 | -3 | -2 | -1 | 0 | 1 | 2 | 3 | 4 | 5 |
|---|---|---|---|---|---|---|---|---|---|---|---|

|
5 | 4 | 3 | 2 | 1 | 0 | 1 | 2 | 3 | 4 | 5 |
Here is the resulting graph:
From what you learned in the “Shifting and Stretching Graphs” section, you can apply these rules to the absolute value function.
| Function | Graph |
Shifts and/or Stretches from
|
|---|---|---|

|
|
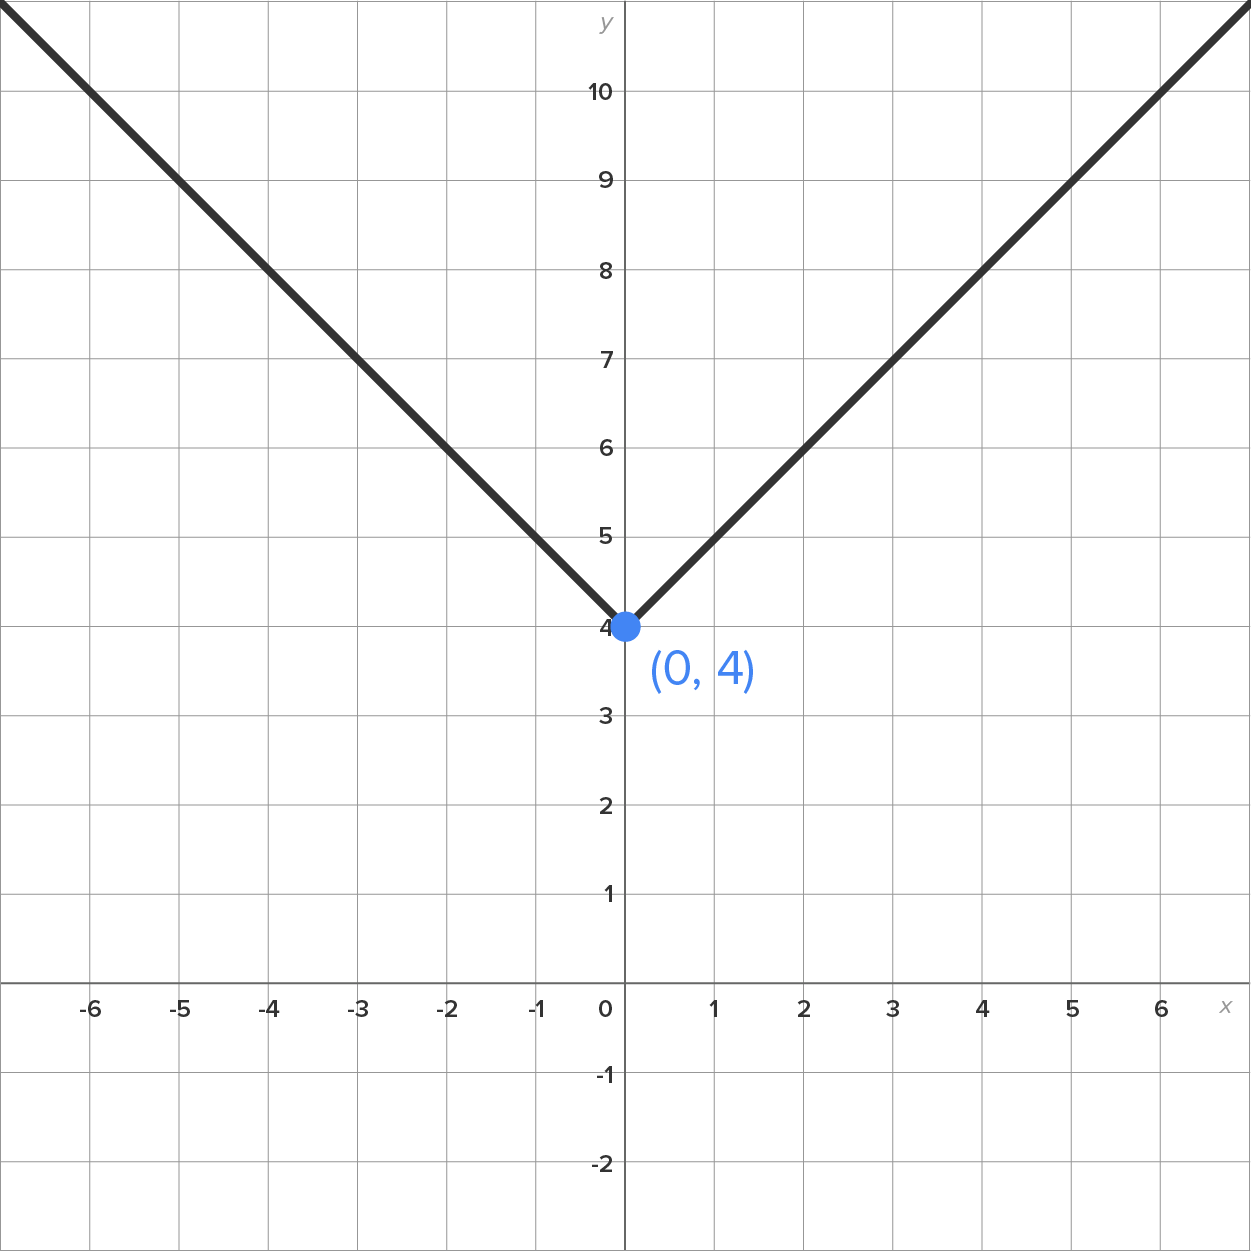
Up 4 units |

|
|
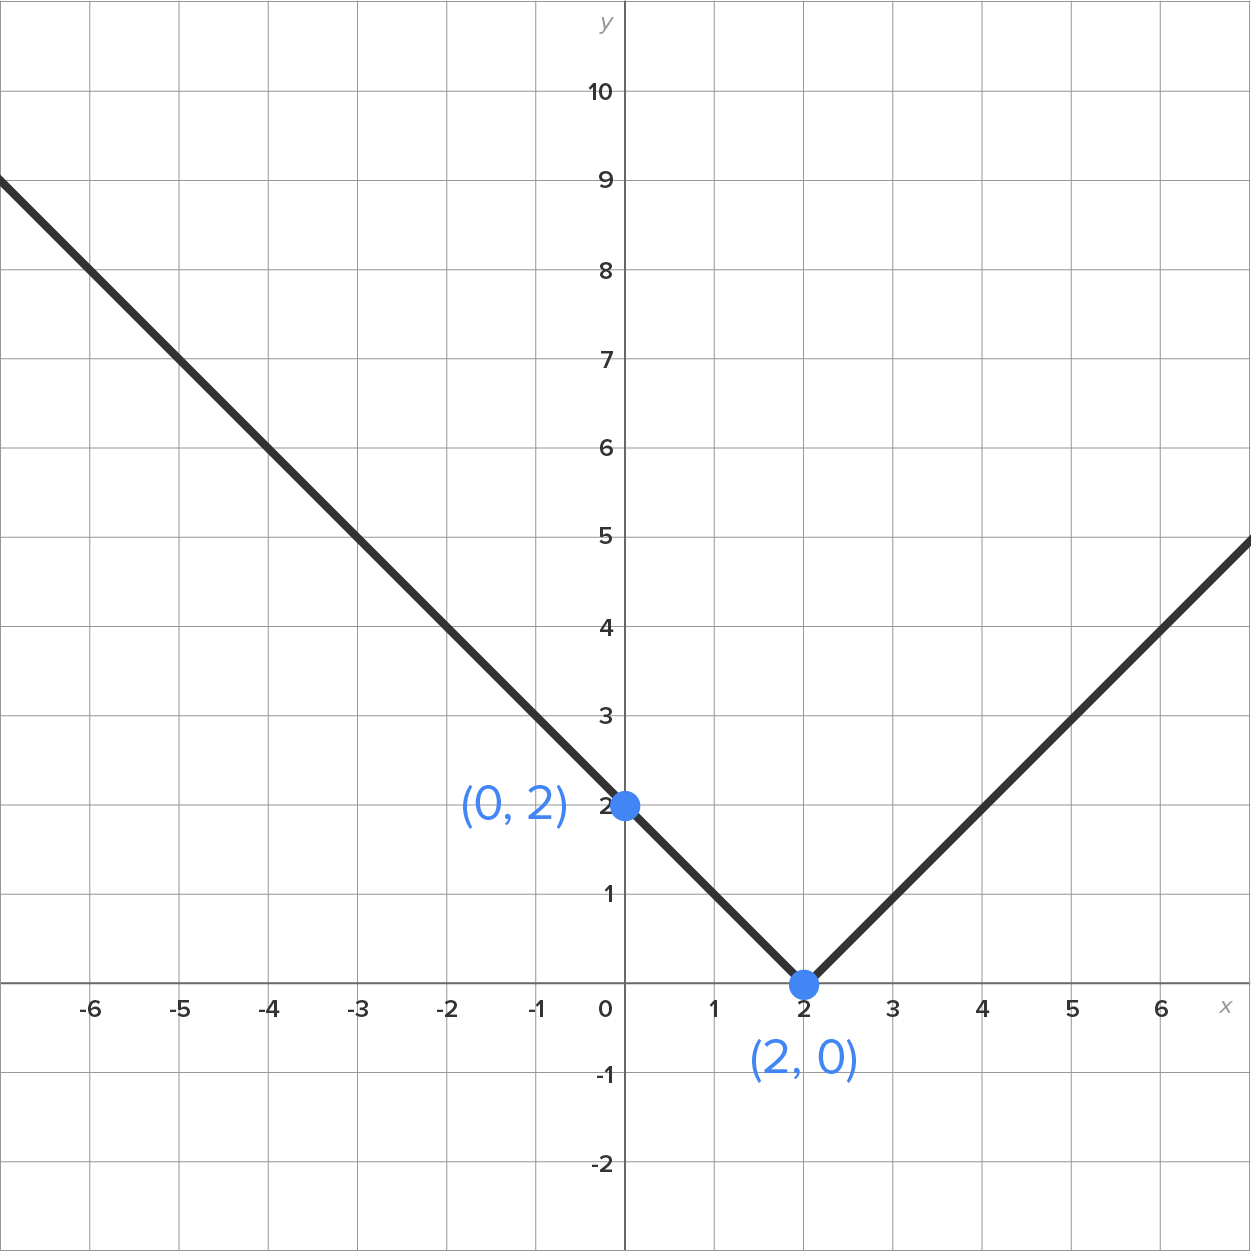
Right 2 units |

|
|
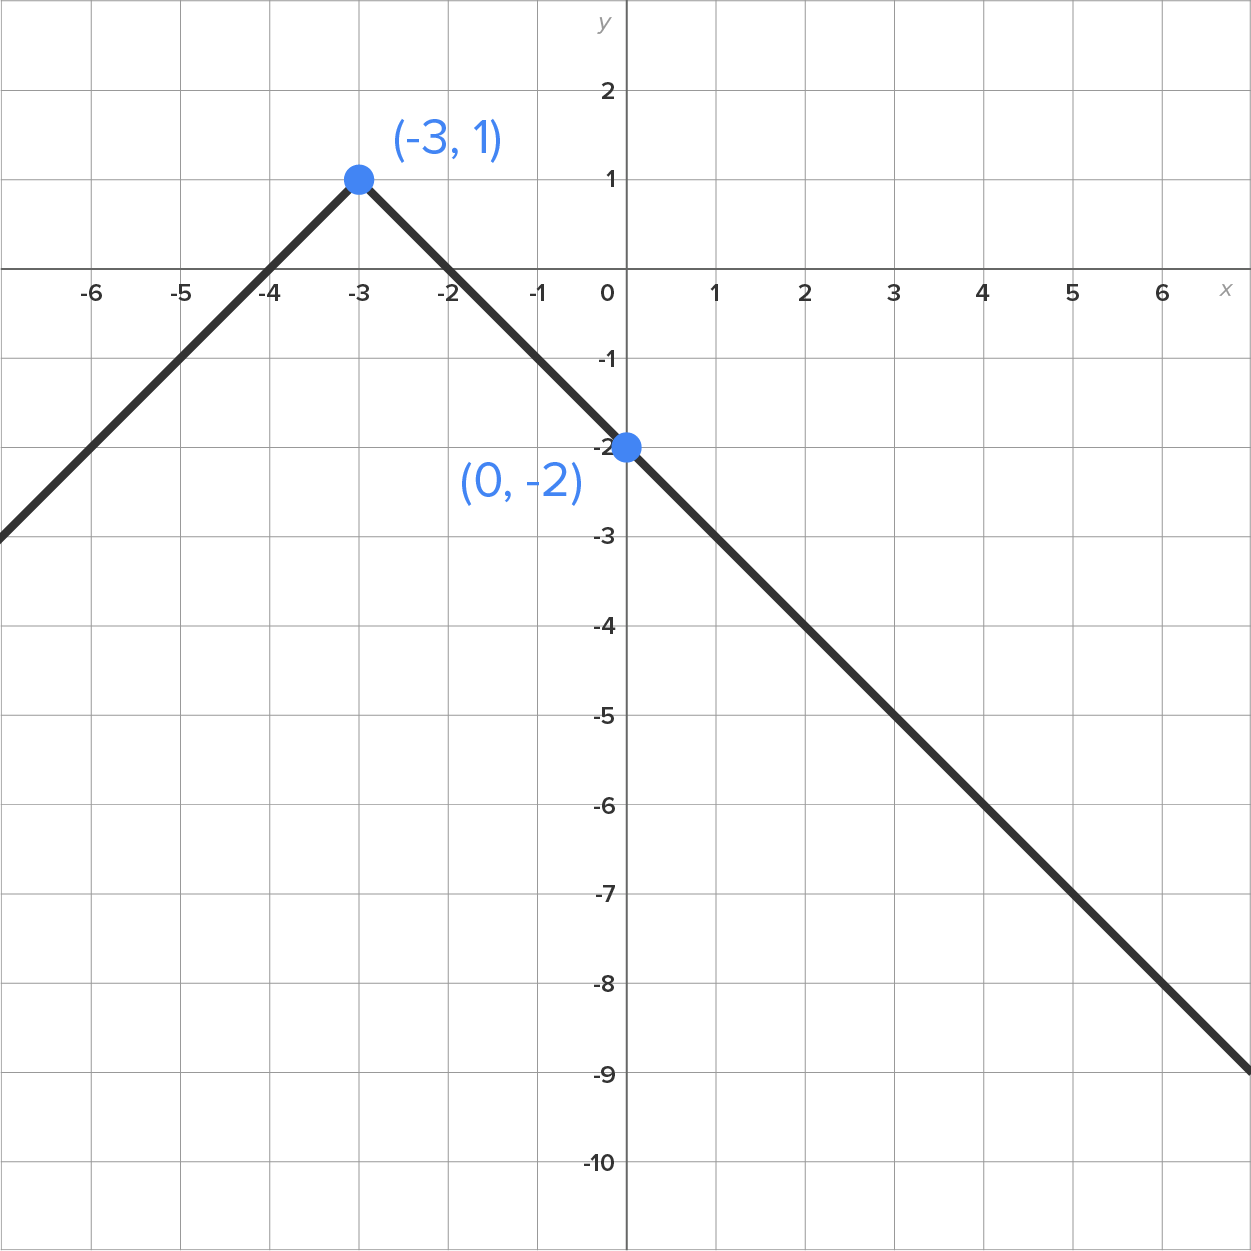
Left 3 units, reflected over the x-axis, then moved up 1 unit |
The function  can be written in piecewise form by replacing “x” with “
 .”
.”
|
|
→ |

|
We can adapt this idea to graph a function of the form  . In order to do this, think about what it means when we say
  and
and  .
.
If , this really means  , indicating that the corresponding point on the graph is below the x-axis.
If , this really means  , indicating that the corresponding point on the graph is on or above the x-axis.
Recall from challenge 1.3.4 “Shifting and Stretching Graphs” that the graph of  reflects the graph of
  across the x-axis. Thus, if , then the graph of reflects over the x-axis (to the positive side). Otherwise, the graphs of and are the same.
EXAMPLE
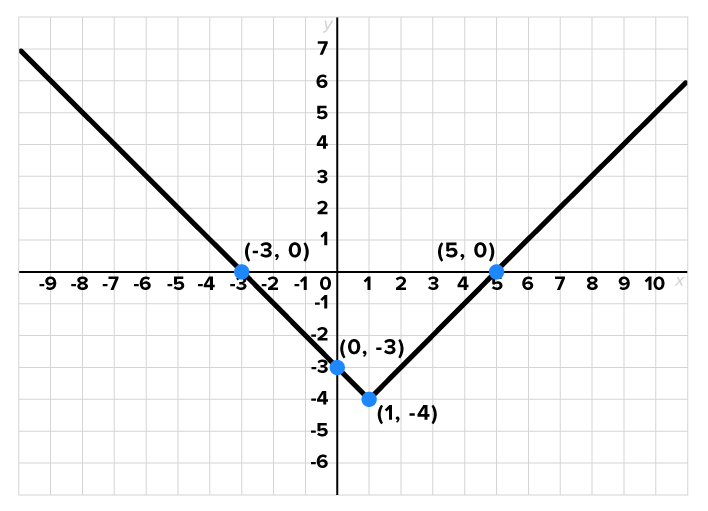
The graph of is shown below:
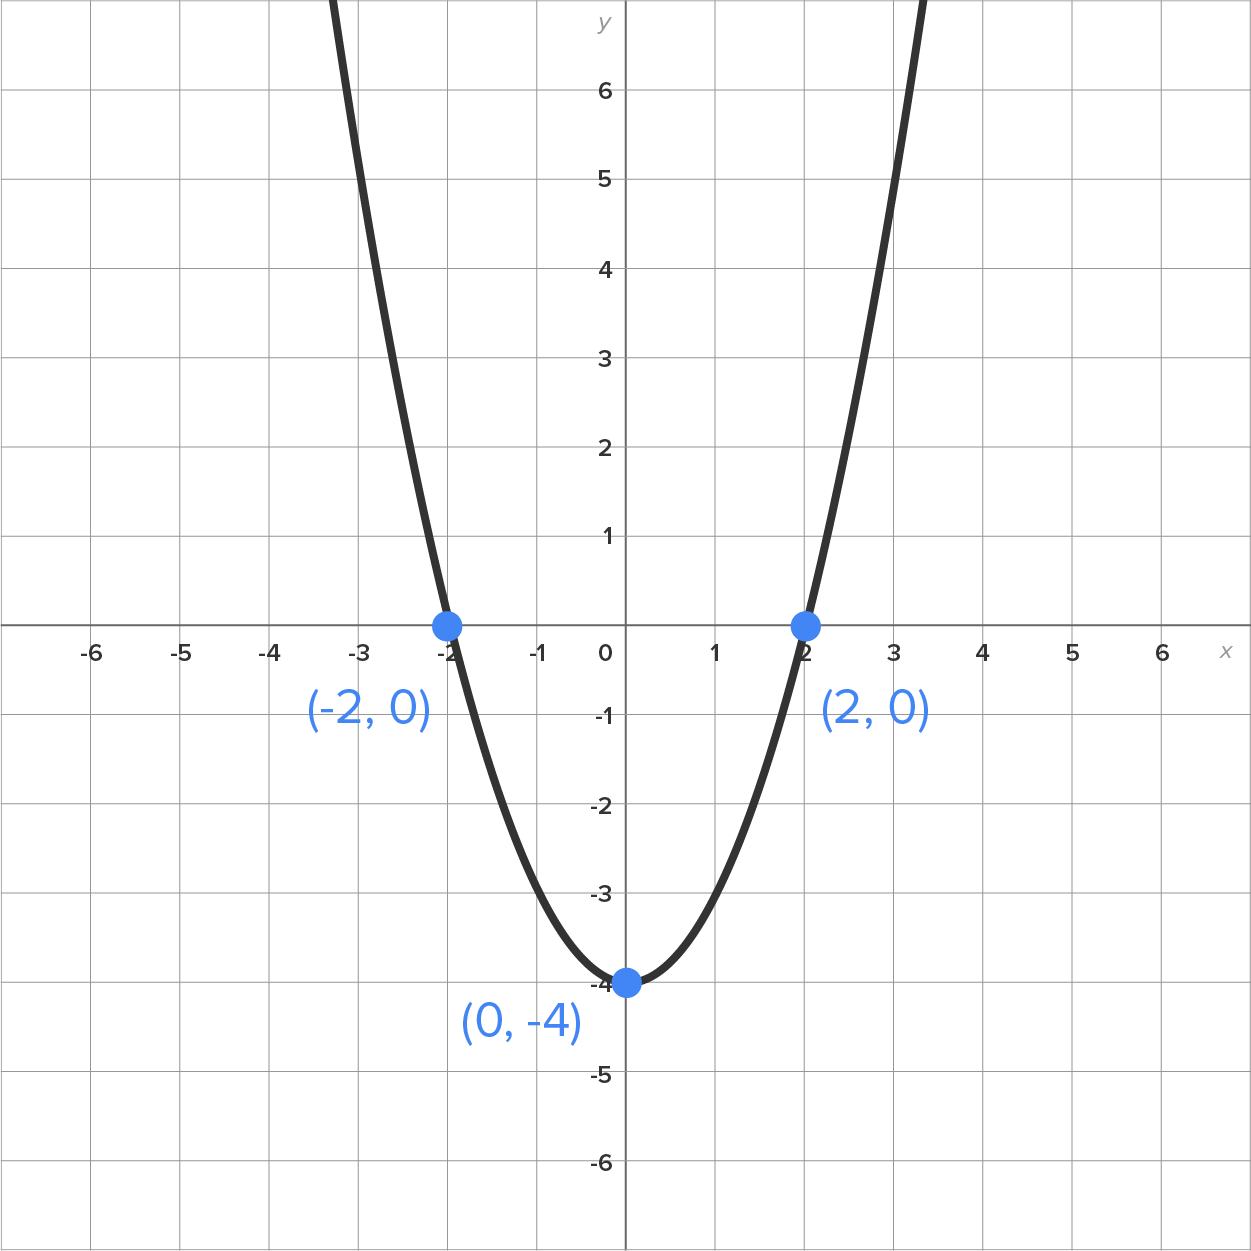
 notice that the graph of is below the x-axis between
  and
and  This part reflects over the x-axis, while the rest of the graph remains the same.
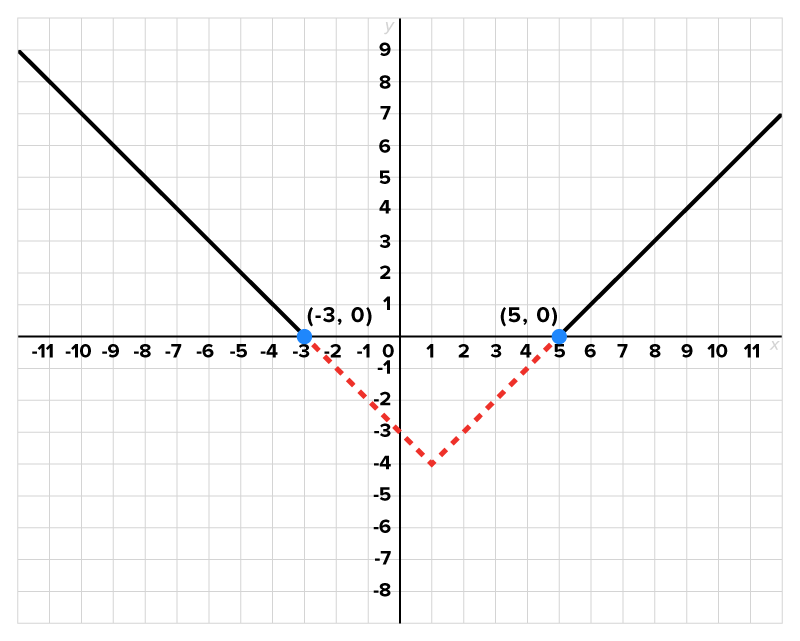
 with the graph of shown as a dashed line for comparison. On the right is the graph of
|
|
given the graph of  consider the following.
is either below or above the x-axis. first, since these are the points where
consider the following.
is either below or above the x-axis. first, since these are the points where 
EXAMPLE
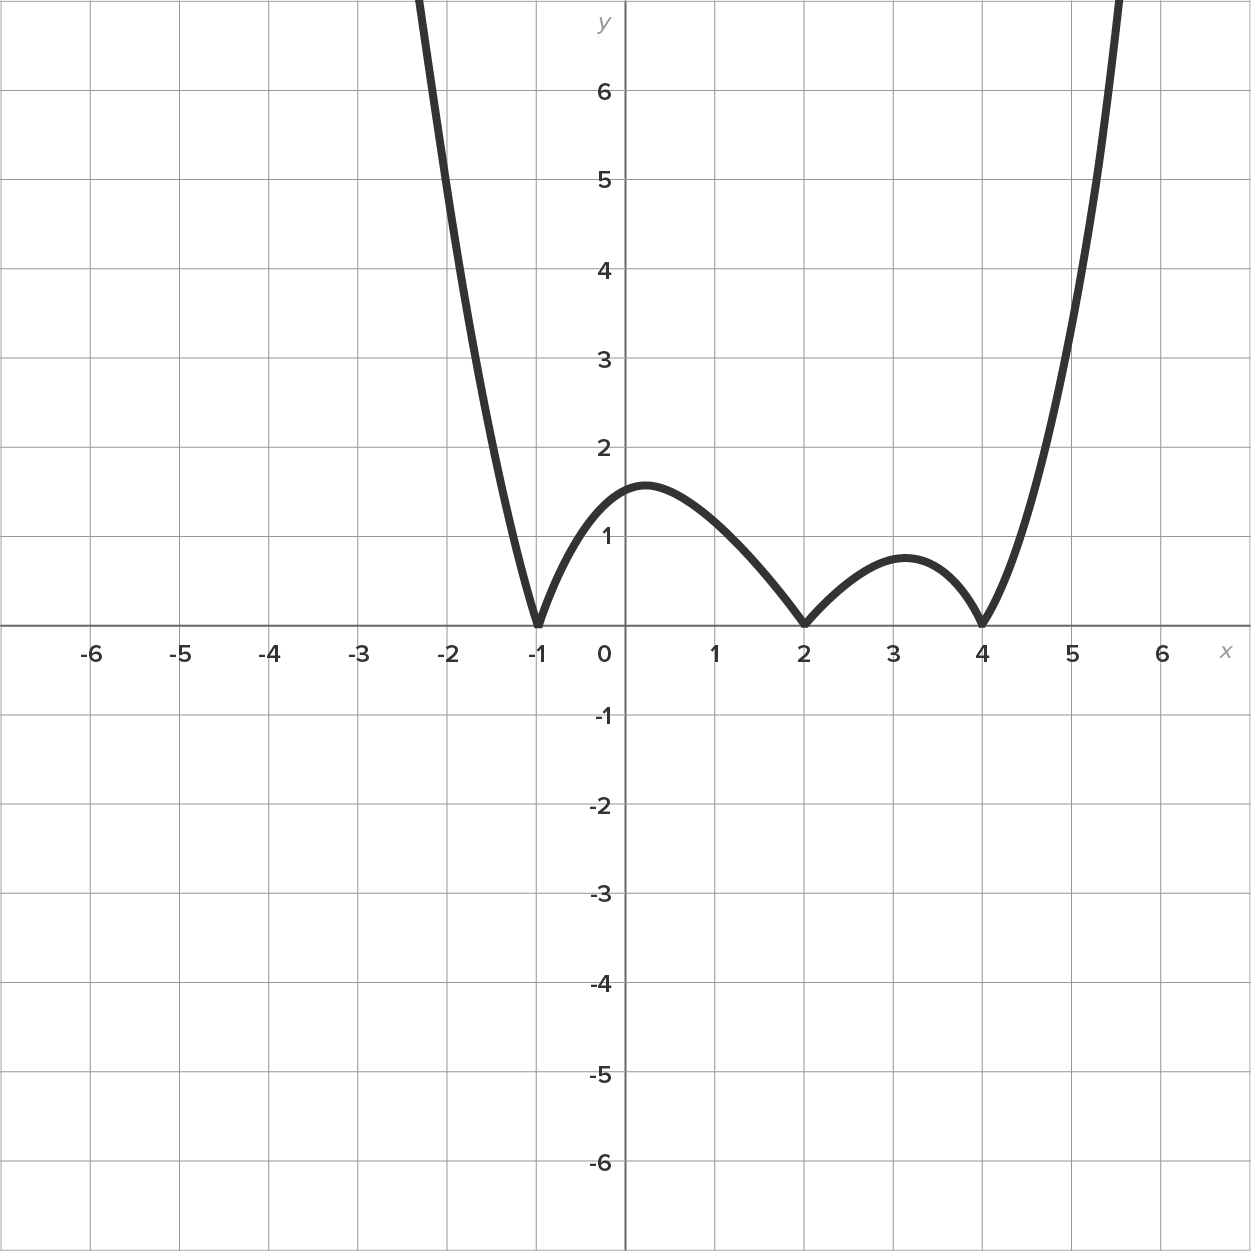
Consider the graph of shown below.

 and
and  Since the graph is above the x-axis to the left of and to the right of
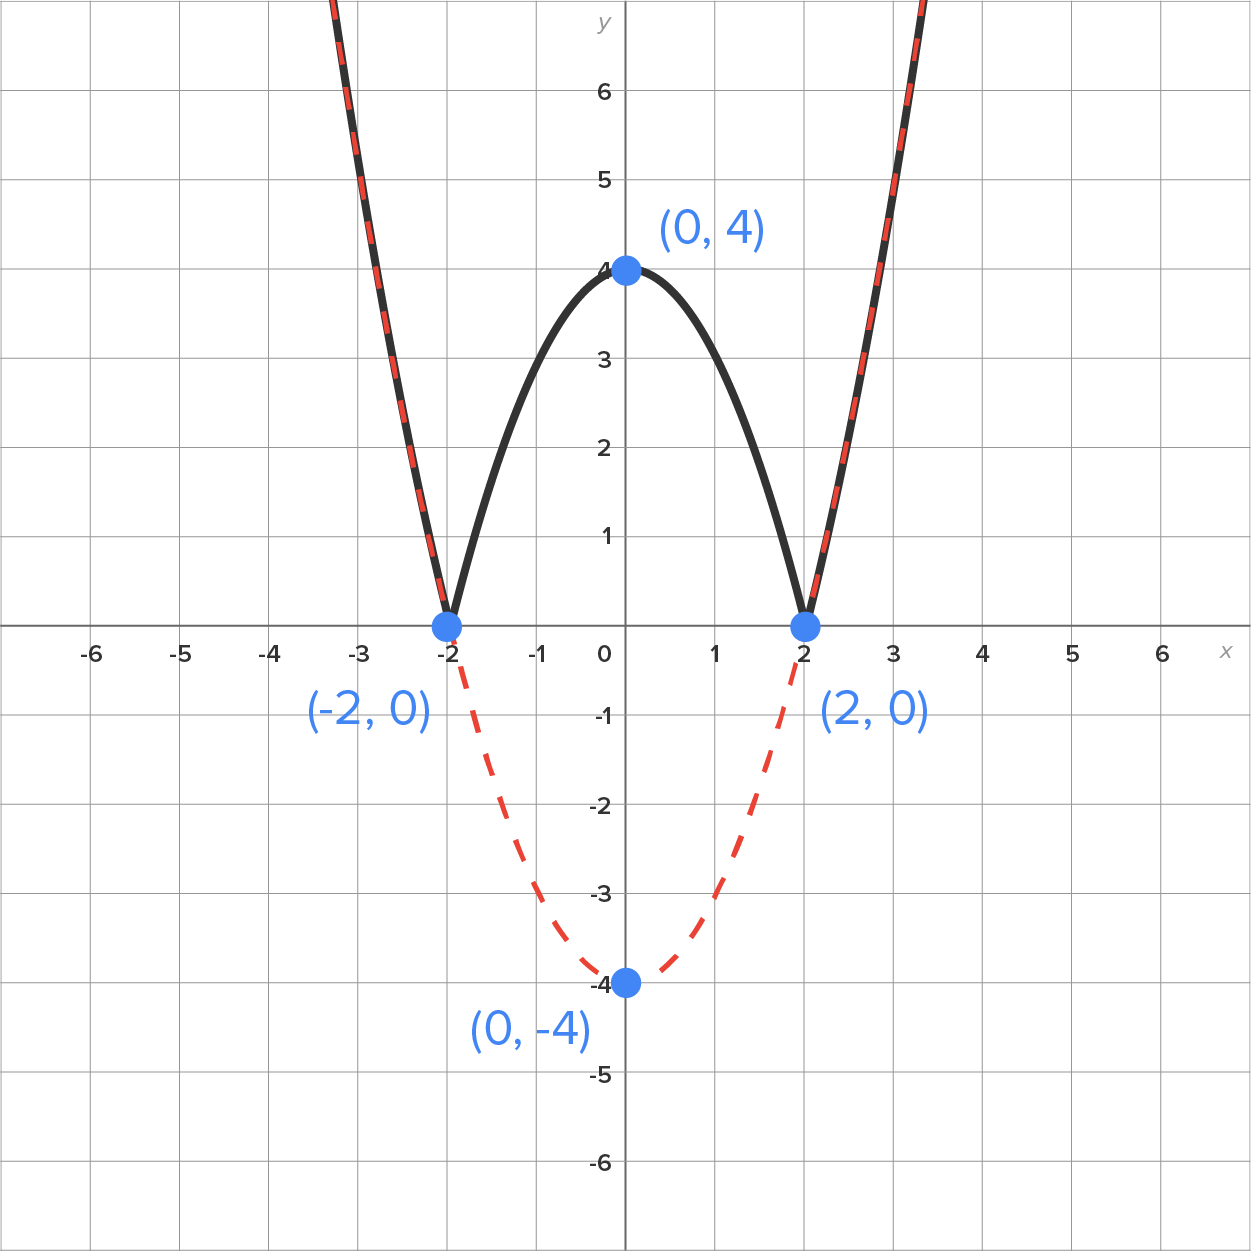
  this portion of the graph will also be above the x-axis. The graph of is shown again below, this time with the portion below the x-axis dashed instead of solid. This is the portion we need to focus on when graphing
 is shown below:
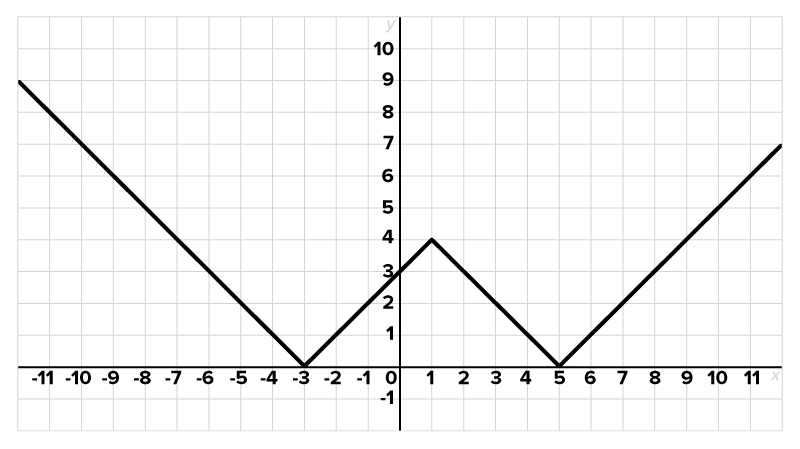 as shown below.
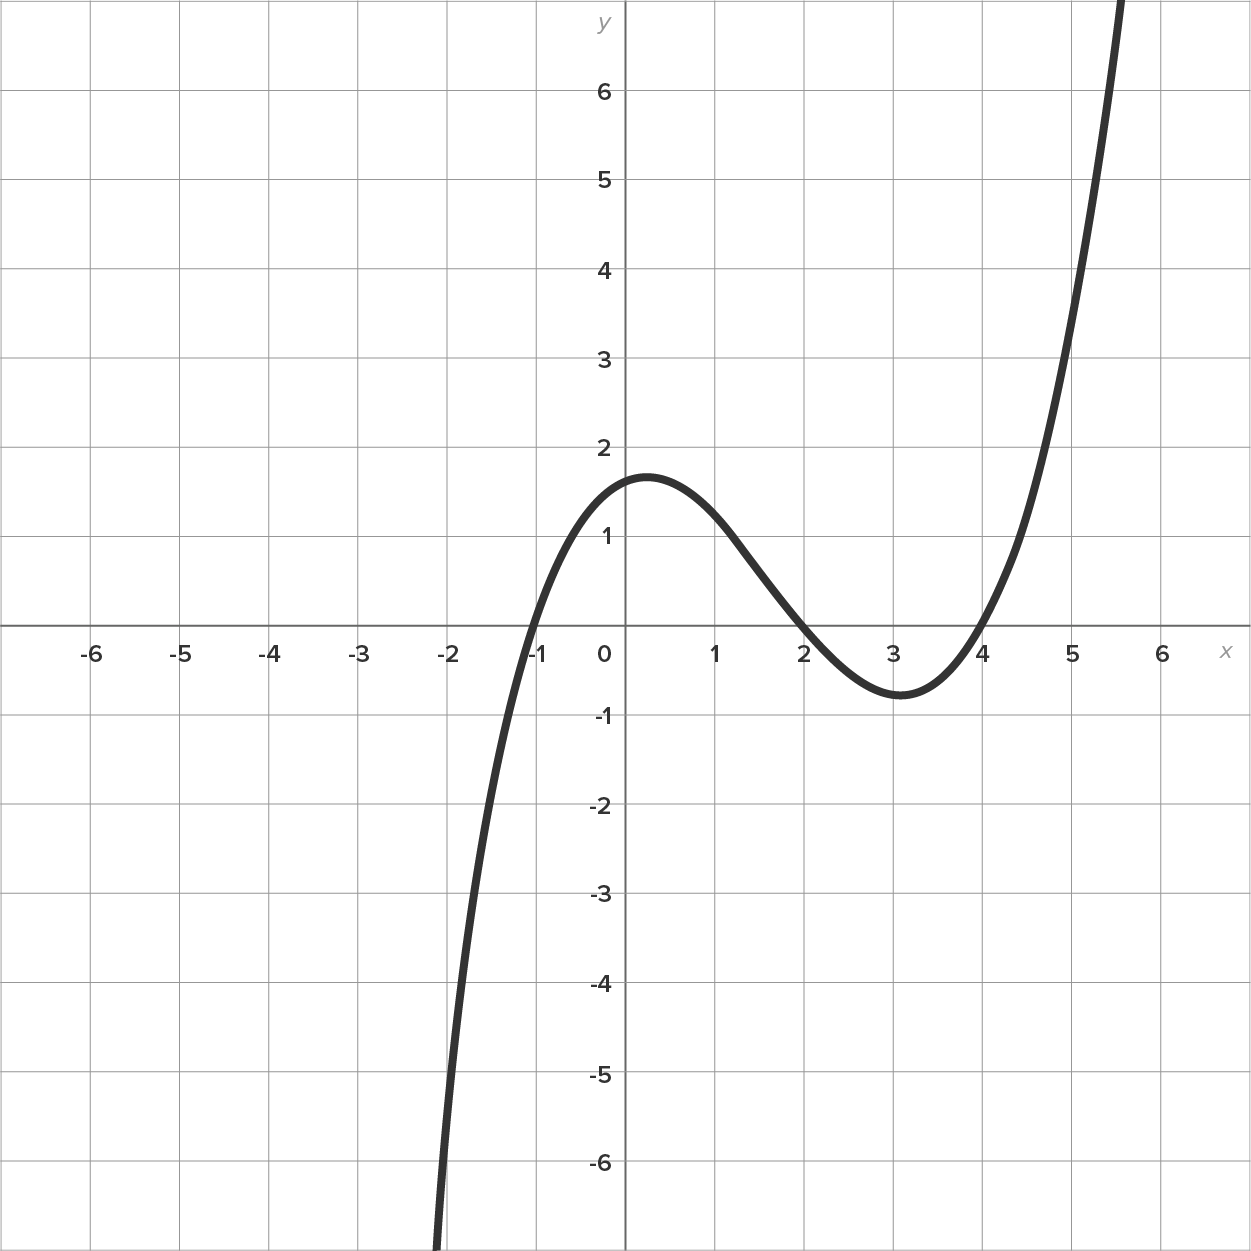
 and between
  and
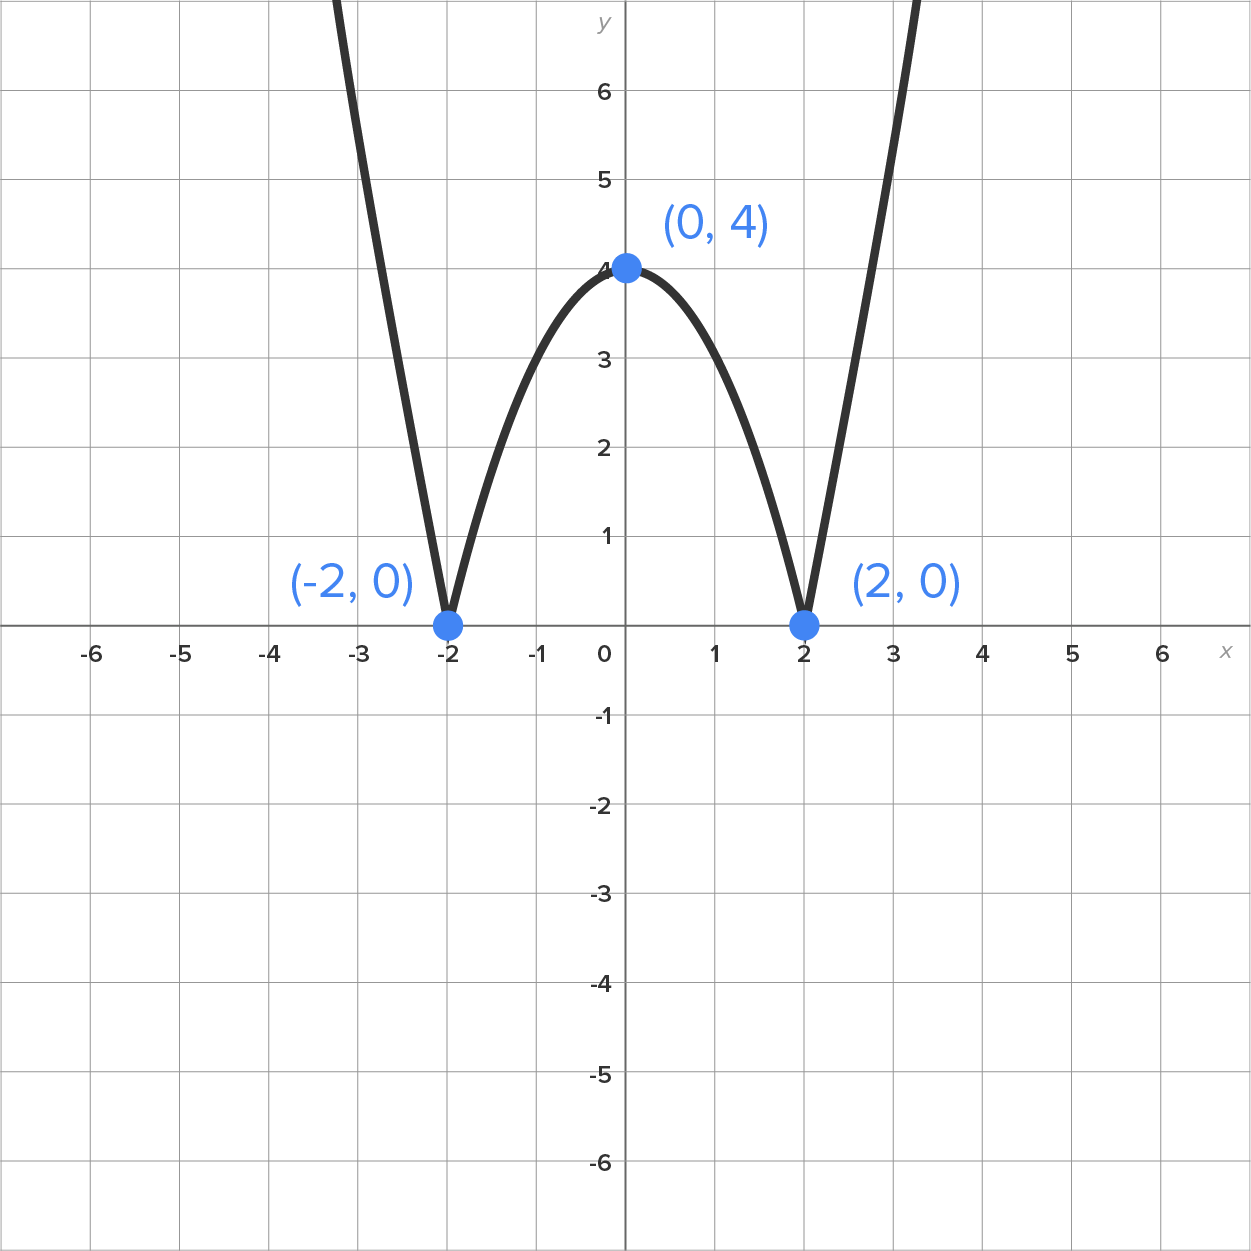
and  are reflected over the x-axis; while the rest of the graph remains the same. The graph below shows the result.
 requires two different rules, depending on what x is. It's important to remember that the absolute value function may look simple on the surface, but it has a more complicated definition beyond “turning things nonnegative.” You explored the graph of the basic absolute value function, applying rules you learned in a previous lesson to create graphs that illustrate the shifting, stretching, and reflecting of the basic absolute value function. Lastly, you learned about other absolute value graphs, noting that while the basic absolute function is simply a “V” shape, graphing requires more thought and care.
SOURCE: THIS TUTORIAL HAS BEEN ADAPTED FROM CHAPTER 0 OF "CONTEMPORARY CALCULUS" BY DALE HOFFMAN. ACCESS FOR FREE AT WWW.CONTEMPORARYCALCULUS.COM. LICENSE: CREATIVE COMMONS ATTRIBUTION 3.0 UNITED STATES.