Use Sophia to knock out your gen-ed requirements quickly and affordably. Learn more
×

68-95-99.7 Rule

Author: Sophia

what's covered
This tutorial will explain the 68-95-99.7 rule. Our discussion breaks down as follows:

Table of Contents

1. The 68-95-99.7 Rule

The 68-95-99.7 rule applies to normal distributions and states that 68% of all data points fall within one standard deviation of the mean, 95% of all data points fall within two standard deviations of the mean, and 99.7% of all data points fall within three standard deviations of the mean.

To understand this rule, let's start with the normal distribution. As you can see below, the normal distribution is single-peaked and symmetric. Thus, this distribution can be described exclusively by its mean and standard deviation.
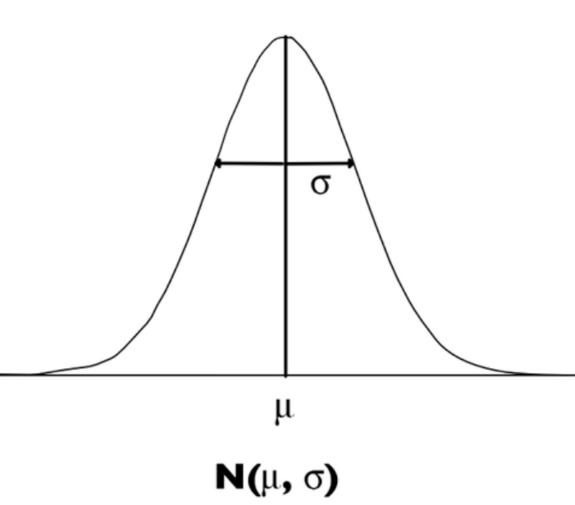
A symmetrical bell curve with a vertical line at the center, labeled ‘μ’. A double-sided arrow is drawn between the edges of the curve and is labeled σ on the right side of the arrow. The notation N(μ, σ) is present below the graph.

All normal curves, all normal distributions, look the same, and exactly like this. The only thing that might make these distributions look a little different is that they may have a wider standard deviation or be centered at a different place. However, since that is all the difference, we can describe the distribution with the notation above (N, mean, standard deviation).

When you learned to calculate standard deviations, you were taught that a good amount of the data points would fall within one standard deviation of the mean. In a normal distribution, you get a good amount of the data points in the first standard deviation.

How many of the data points will fall in the first standard deviation? Well, 68% of all the data falls within the first standard deviation of the mean, from one standard deviation below the mean to one standard deviation above the mean.
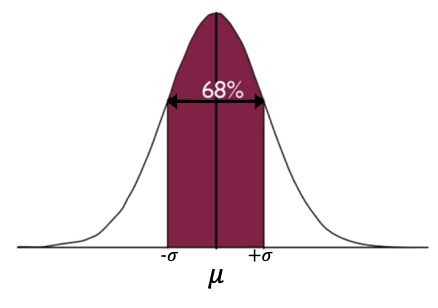
A symmetrical bell curve with a vertical line running through the center, labeled ‘μ’. The region between −σ and +σ inside the symmetrical bell is shaded, and a horizontal double-headed arrow is drawn across this shaded section and labeled 68%.

If you go out another standard deviation—now you are two standard deviations below the mean to two standard deviations above the mean—you get 95% of the data points.
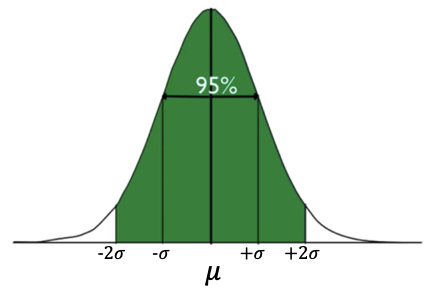
A symmetrical bell curve with a vertical line running through the center, labeled ‘μ’. The horizontal axis shows −2σ, −σ, +σ, and +2σ.  The region between −2σ and +2σ is shaded, and a horizontal double-headed arrow is drawn and labeled 95%. Vertical lines are drawn from either ends of the arrow down to −σ and +σ.

If you go all the way out to three standard deviations below the mean and three standard deviations above, you get almost the entire set of data: 99.7%.
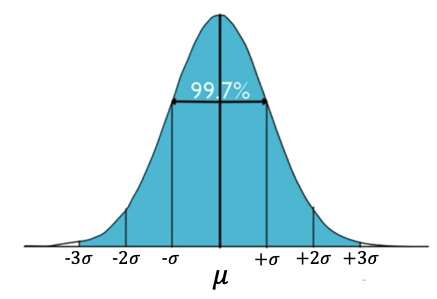
A symmetrical bell curve with a vertical line running through the center, labeled ‘μ’. The horizontal axis shows −3σ, −2σ, −σ, +σ, +2σ, and +3σ.   The region between −3σ and +3σ is shaded, and a horizontal double-headed arrow is drawn and labeled 99.7%.  Vertical lines are drawn from either end of the arrow down to −σ and +σ. Similar vertical lines starting from the curve meet the horizontal axis at all the other labeled points.

This is why it's called the 68-95-99.7 rule.

  • About 68% of the data values are within one standard deviation of the mean.
  • About 95% are within two standard deviations above or below the mean.
  • About 99.7% of the data, almost all the data, fall within three standard deviations of the mean.
term to know
68-95-99.7 Rule
A rule that applies to normal distributions, stating that 68% of all data points fall within one standard deviation of the mean, 95% of all data points fall within two standard deviations of the mean, and 99.7% of all data points fall within three standard deviations of the mean.


2. Finding More Percents

Because of the symmetry of the normal distribution, you can examine this rule further.

You can say that 68% of the data falls within one standard deviation, but because of the symmetry, 34% falls between one standard deviation below the mean, and another 34% falls between the mean and one standard deviation above.
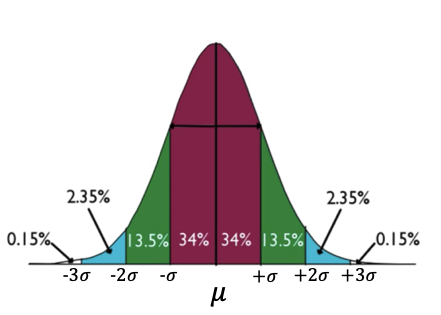
A bell curve diagram centered at μ (mean), with sections marked by standard deviations. The horizontal axis shows −3σ, −2σ, −σ, μ, +σ, +2σ, and +3σ. The middle section from −σ to +σ is shaded and labeled 34% on each side of the mean. The sections from −2σ to −σ and from +σ to +2σ are shaded and labeled 13.5% each. The outer sections from −3σ to −2σ and from +2σ to +3σ are labeled 2.35%, and the extreme ends beyond −3σ and +3σ are labeled 0.15% each.

You can continue with this logic: the green bars—between one and two standard deviations below and above the mean—each contain 13.5%. That 13.5% is obtained because we know that the two standard variations on each side of the mean contain 95% of the data points. Since 68% is within the red portion—one standard deviation above and below the mean—then the remaining 27% (95–68) must fall within the two green bars. Also, because they have the same area, they must each contain half of that remainder, or 13.5%.

Using that same logic again, you can see that about 2.35% of the data points fall within the blue bars.

Way out in the tails, you get almost none of the data points. To make up the full 100%, another 0.15% falls within each of those tails farther out than three standard deviations away.

EXAMPLE

A particular battery from a company has a lifetime that is normally distributed with a mean of 500 hours, and a standard deviation of 18 hours. What percent of batteries last between 482 and 518 hours?
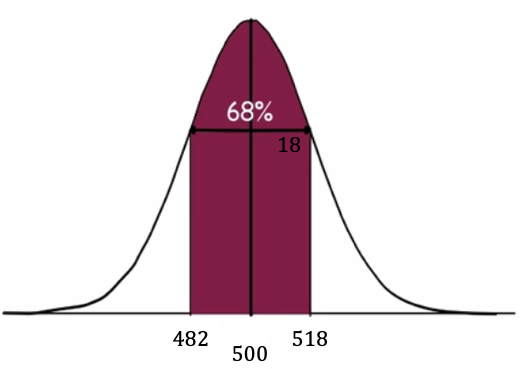
A bell curve centered at 500, with the middle section shaded. The shaded area runs from 482 to 518 and is labeled 68%. A vertical line marks the center at 500, and the distance from the mean to one side is marked as 18.
Also, 482 and 518 are exactly one standard deviation above and below the mean of 500. Using the 68-95-99.7 rule, we can say that 68% of batteries last between 482 and 518 hours.

EXAMPLE

What percent of batteries from this company last between 446 hours and 536 hours?
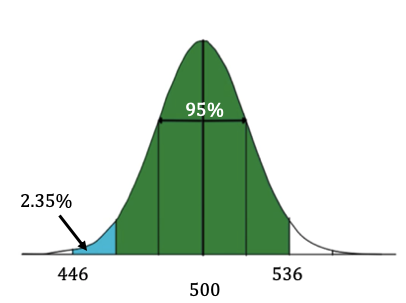
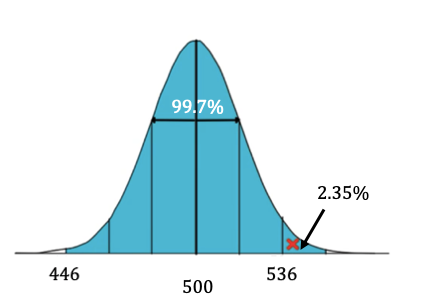
Well, 446 is three standard deviations below the mean and 536 is two standard deviations above the mean. So, there are two ways to calculate the answer to this question.

1. You could calculate it as the full 95% (the green area) plus the 2.35% (one of the blue bars).
A bell-shaped curve centered at 500 on the horizontal axis. The middle section of the curve is shaded and labeled ‘95%’. The left section has a small shaded area labeled ‘2.35%’, pointing to a value near 446. Another value, 536, is marked on the right side of the curve. Vertical lines divide the curve into sections.
95% + 2.35% = 97.35%
2. You could also have calculated it as 99.7% (all of the blue area) and subtracted the extra 2.35% (the blue bar to the far right).
A bell-shaped curve centred at 500 on the horizontal axis. Most of the curve is shaded and labeled ‘99.7%’. The rightmost side has a small highlighted section labeled ‘2.35%’, marked near the value 536 with an X. The value 446 is marked on the left side. Vertical lines divide the curve into sections.
99.7% - 2.35% = 97.35%

Either way, you end up with 97.35%.


EXAMPLE

What percent of batteries last longer than 464 hours?
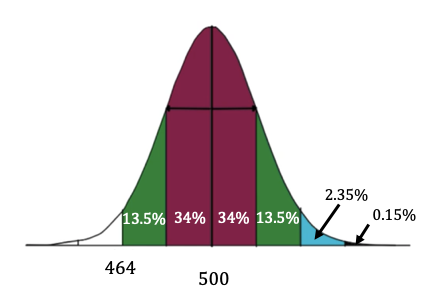
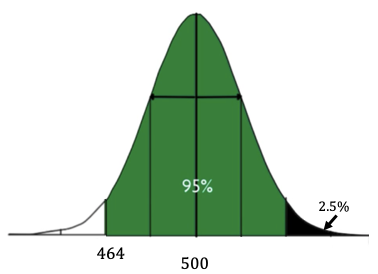
Well, 464 is two standard deviations below the mean, so there are a few different ways to do this calculation.

1. You could just start adding each area above 464.
A bell-shaped curve centered at 500 on the horizontal axis. The middle section is shaded and split into two parts labeled ‘34%’ each. On both sides of this are shaded sections labeled ‘13.5%’. Further to the right, a small shaded section is labeled ‘2.35%’, followed by a very small section labeled ‘0.15%’. The value 464 is marked on the left side. Vertical lines divide the curve into sections.
13.5% + 34% + 34% + 13.5% + 2.35% + 0.15% = 97.5%
2. You could add the 95% plus the remaining 2.5% in the upper tail.
A bell-shaped curve centred at 500 on the horizontal axis. The central portion of the curve is shaded and labeled ‘95%’, spanning roughly from 464. A vertical line marks the center at 500, with additional vertical lines dividing the shaded region. On the right side, a small tail section beyond the shaded area is highlighted and labeled ‘2.5%’.
95% + 2.5% = 97.5%
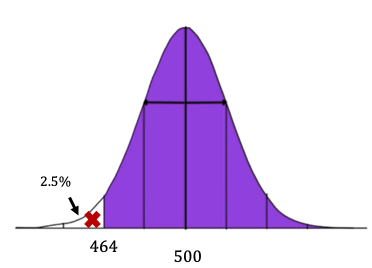
3. The entire curve is 100%, and the only part you don't want is the 2.5% on the left.
A bell-shaped curve centered at 500 on the horizontal axis. Most of the curve is shaded purple, covering the central region. On the left side, a small tail area is unshaded and labeled ‘2.5%’, with an arrow pointing to it. A red X marks a point near 464 on the left side. Vertical lines divide the curve, including one at the center.
100% - 2.5% = 97.5%

However you calculate this, you should end up with the same answer: 97.5% of batteries last longer than 464 hours.

summary
The 68-95-99.7 rule is a way to generate approximate percents of values that will be within a particular interval of the normal distribution. You can combine this rule with your knowledge of the symmetry of the normal distribution to find more percents than just 68, 95, and 99.7. This rule will not work if the values are not at integer standard deviations, meaning whole numbers of standard deviations away from the mean.

Good luck!

Source: THIS TUTORIAL WAS AUTHORED BY SOPHIA LEARNING. PLEASE SEE OUR TERMS OF USE.

Terms to Know
68-95-99.7 Rule

A rule that applies to normal distributions, stating that 68% of all data points fall within one standard deviation of the mean, 95% of all data points fall within two standard deviations of the mean, and 99.7% of all data points fall within three standard deviations of the mean.